Our Fibonacci Pinball method provides market context in a way I have never seen with any other methodology. It gives us very strong warnings as to when a rally is near completions as well as when a decline is near completion. It also allows us to tune out all the noise and emotion that is prevalent throughout the rest of the market and only focus on what matters.
As one of our members once aptly said, “The goal of EW analysis is to analyze sentiment, not participate in it!”
Below are just a few examples of the successful market calls we’ve had with this method:
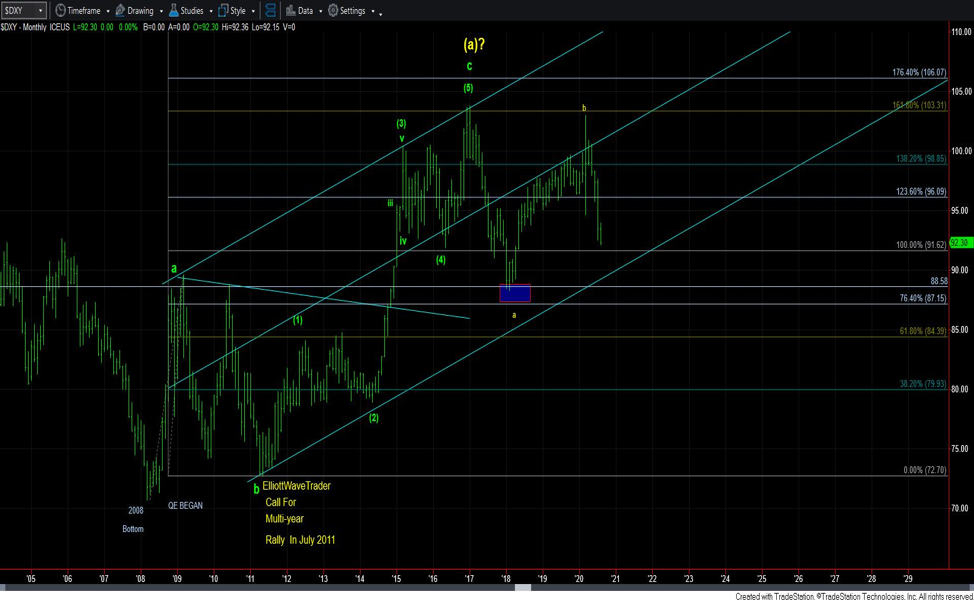
While it’s not a market call that I discuss very often, many of our members think this may have been one of the one of the most remarkable market calls we have made through the years. Back in 2011, when the US Dollar Index (DXY) was in the 73 region, we called for a multi-year rally with a target in the 103.53 region.
For those that do not trade much in the forex world, calling for a 40% rally in currency is really a significant expectation -- especially when you consider that the Fed was heavily involved in its QE programs at the time, which caused everyone and their grandmother to be certain that the dollar was about to collapse. Meanwhile, we were calling for a 40% rally in that environment, and many people were looking at me like I was simply crazy.
As we know today, not only did the dollar rally in the face of this unprecedented QE that supposedly was going to cause it to crash, it reached a high of 103.82 by late 2016. That was within 30 cents of our long-term target, which had been set back in 2011.
That’s just one example of the type of calls we have had.
Another example is gold. Back in the summer of 2011, gold would rally as much as $50 in a single day, and everyone in the market was certain that we were going to exceed the $2000 mark that year. In fact, in the way the pundits, analysts, investors, and everyone else was talking that summer, not only was $2000 a forgone conclusion, the real argument was really about how much beyond $2000 we were going to go.
On August 22 of that summer I wrote the following on Seeking Alpha: “Since we are most probably in the final stages of this parabolic fifth wave ‘blow-off-top’, I would seriously consider anything approaching the $1915 level to be a potential target for a top at this time.”
As we now know, gold topped within $6 of our target. Even before gold topped, I outlined my expectations for where a pullback can take us. I noted that if we broke a certain level of support, which is about the .382 retracement, I could easily see gold dropping back $700 to $1000 region from the $1900’s. Remember, I wrote this while gold was still in the midst of a parabolic run while everyone was certain it was going over $2000, and I started talking about $1000 as the target.
I’m sure you can understand how everyone who read this analysis viewed it. Let’s just say the kind commentators told me that I was absolutely crazy.
As we now know, gold dropped down to the $1050 region before it bottomed.
However, what was really incredible about that was that during that entire decline, all the fundamentalists, who were uber-bullish gold at the highs in 2011, remained bullish all the way down. It was absolutely remarkable. I was stunned watching it.
But what was even more incredible, as we were approaching the $1000 region in 2015, they began to turn bearish. It was astounding to watch it happen in real time. And almost in unison, the belief became that gold would certainly drop to $1000 before we could even consider a bottom being struck.
But again, we began looking the other way when the boat became a little too heavily weighted.
In fact, the night gold actually struck bottom in December 2015, I told our members I was on the phone with Doug Eberhardt of BuyGoldandSilverSafely.com buying a large order of physical gold. I wrote this in my in my metals report on December 25: “I strongly believe that 2016 will be the year that we declare the resumption of the long term metals bull market.”
In addition, I had begun buying mining stocks and launched our popular Metals, Mining & Agriculture (formally Mining Stocks Portfolio) service in September 2015, which was actually the low point in most miners.
Back in 2015, I outlined to our members that I expected the S&P 500 to top out at the 2100 region, drop down to the 1800 region, and then begin a global melt-up within the next few years thereafter, starting early 2016. This was during the time when the Fed was reducing its balance sheet, and there was, again, unanimous certainty that my expectation was a complete impossibility when the Fed was no longer standing behind the market. Everyone thought that with the Fed reducing the balance sheet, the marked was bound to crash.
I think we know that was not the case. My staff actually outlined my calls throughout 2016 as we caught every twist and turn that year.
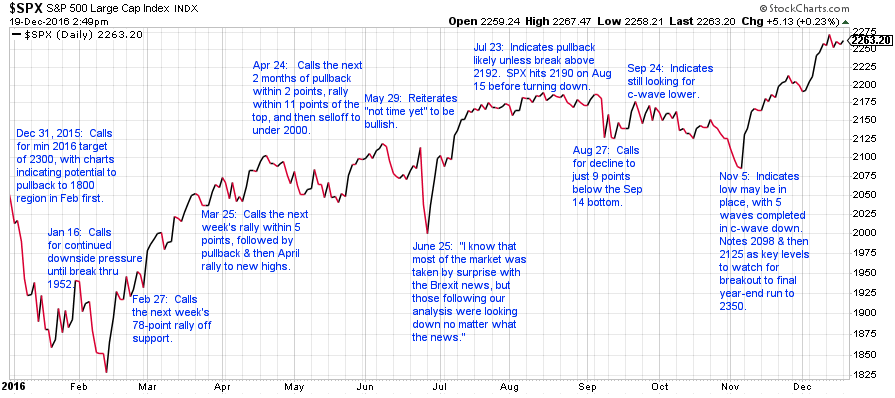
As we went into the 2016 election, I reiterated my perspective that the market was setting up to rally strongly over the 2600 region. Mind you, we were at the 2100 region at the time, and I was looking for a rally to at least 2600, with the potential to extend to 3000. I said this and I kept quoting this: “NO MATTER WHO WON THE ELECTION.”
If you remember that time period, the common expectation was that if Trump was elected, the market was going to crash. But I continued to pound the table that we were likely headed over 2600 no matter who was elected.
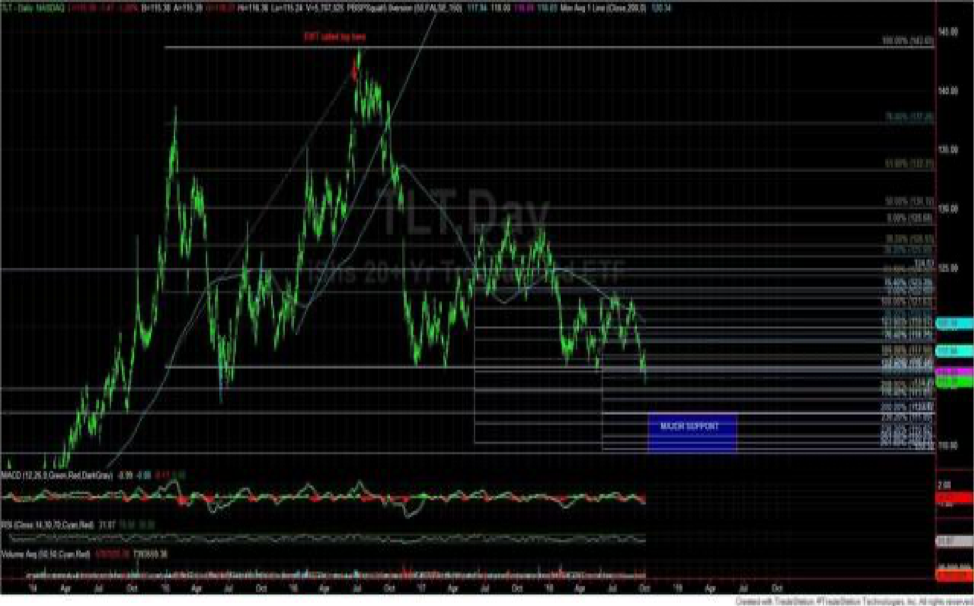
For one last example, let’s take a look at the bond market. For many years, many were calling for an end to the bond market almost weekly. As you know, they have been continually wrong. But on June 27, 2016, I wrote an update for our members, entitled “Beware of Bonds Blowing Up.” Within that article, I was calling for a local top to the bond market, not necessarily an end to the bond market, but with the expectation of a large correction.
When I was calling for this top, I was getting quite a bit of pushback from our members because the Fed was still lowering rates. I was told that we simply cannot fight the Fed. But as we now know (and you can see it on the chart), within two weeks of that article, the TLT struck a local top and proceeded to drop 22%.
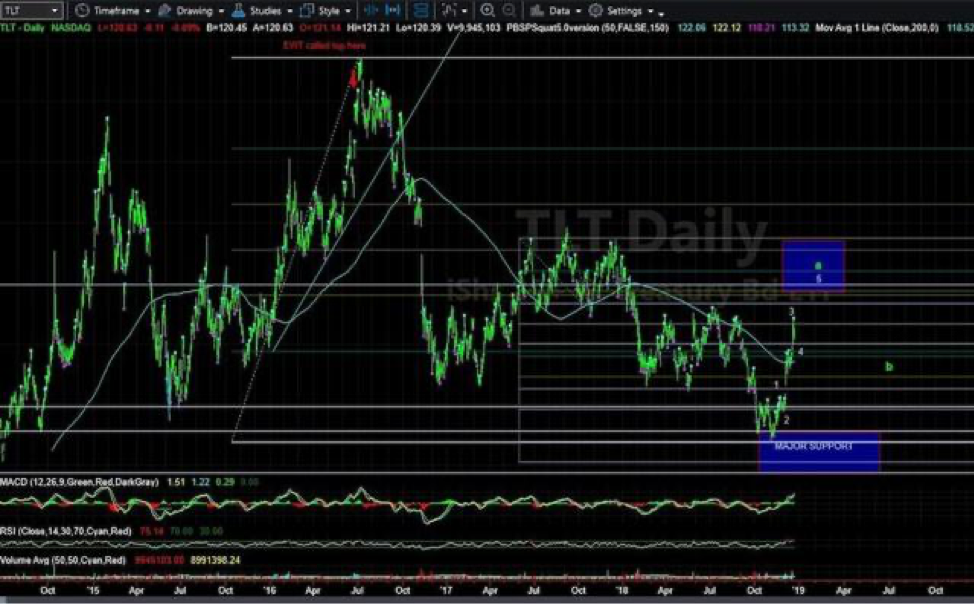
Then, in November 2018, I was again telling those who follow my analysis that the bonds were looking like they were finally bottoming. As we approached my major support region (noted on this chart). In fact, I noted in our chat room that I was buying TLT when we struck 113. My first target was in the 124 region, where I thought we would see a pullback, and then head much, much higher.
If you remember that time period, also, the Fed was strongly signaling that it was continuing down the path of raising rates at the time. Again, I was getting pushback because you simply cannot fight the Fed. Well, we know how it turned out. The market did exactly what we expected. It bottomed right at our support and began a strong rally to our first target, and then as we know where bonds are sitting right now, bonds have gone significantly higher.
I am sure many are wondering how we did in 2020. To be honest, I am embarrassed to say that we have been doing extraordinarily well, as has been one of our best years to date.
Towards the end of 2019, I caught the bottom at 2350, and expected it to rally to 3000-3100 region. I will admit that the S&P 500 blew through my upside expectation, which was initially at 3100, and continued to rally, as we know, to 3400. But, once it moved to 3100, it became too rich for my blood. So, clearly, I did not capture the last 300 points in early 2020. But, the reason I did not capture it was because many other charts were saying that the SPX was giving us a very dangerous blow-off top.
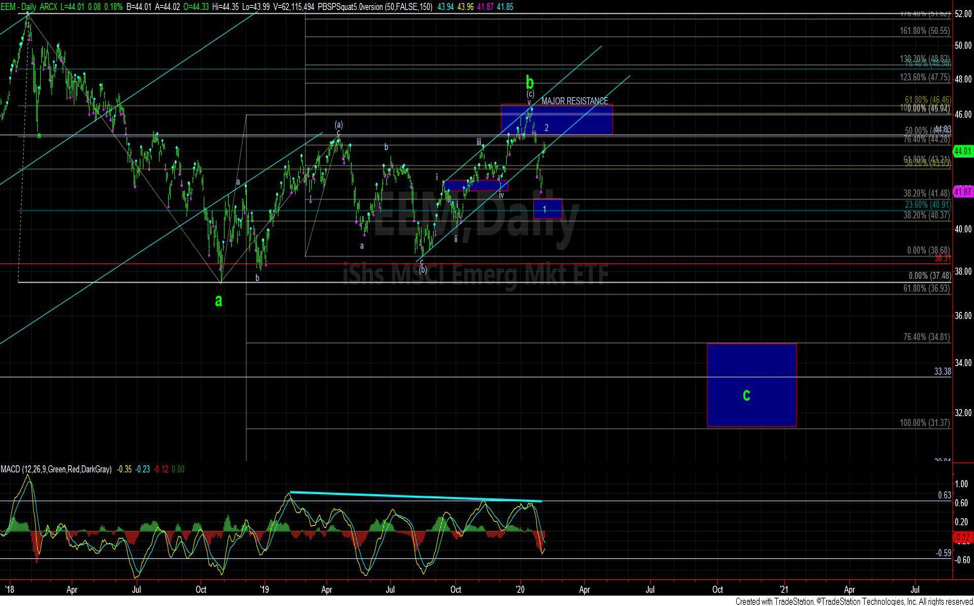
In fact, in February, I outlined a short trade for our members in the EEM, and presented it below. As you can see on the chart, I was looking for a short position in the 44-45 region with an ideal target below the 1.0 extension in the 31 region. Yes, this was in the face of a strongly rallying SPX chart, in which I did not want to participate on the long side once we got over the 3100 region. The reason I chose this chart to short was because it provided us with the lowest risk opportunity from a risk management standpoint and gave us wonderful trade parameters.
Now, as we know, the EEM not only hit our target of 31, it even spiked a bit below it before it went back up strongly.
In fact, as we were analyzing the SPX, we presented an ideal bottom target at 2187, and the SPX bottomed out within four points of that target at 2191.
If you remember what that feeling was at that time, it was pure pandemonium in the market, and the fear was absolutely palpable.
So, when the market broke down below 2300 on the S&P, I told the members in our trading room that I was buying back into the market, and I’m sure you can understand how our members thought I may have a screw loose. In fact, when I asked my wife to buy back into the market with our children’s 529 college funds because we were 100 percent cash during that time, she even gave me a strange look and asked me “are you sure.” And, I was continually reiterating (even at the lows) that I expected the market to rally from the 2200 region to 4000+.

I live Finance. 80hrs a week corp finance. I trade as a hobby and in my opinion this is the best site in the world for someone to learn about markets... i rue the day when it is no more or its core is changed. there is NO BETTER SITE IN THE WORLD to get the off-cuff input/feedback/knowledge across ALL MARKETS like this site... Thank you to the analysts here who grind out thousands of charts each week."GibsonDog" - Trading Room
My faith in God and my faith in Avi and his team. God lead me to this service over 10 years ago. For a decade I have heard Avi point his bat at this very moment in time calling this S&P level. Though the years I have witnessed him point his bat months, even years before metals hit their highs and lows with almost perfect big picture accuracy. Against every other analysts opinion. I have seen him bullied relentlessly on his public articles on SA and stick to his guns and proven so correct with no one ever apologizing or admitting he called it."sdmavrick" - Seeking Alpha
My AUM has grown exponentially because of you and I can't thank you enough. My biggest regret is not signing up sooner! You've done more good than you will ever know."AAMilne" - Trading Room
I’ve subscribed for 5 years now and I have to say I see that you’ve been right on this the whole time. Who would’ve thought gold and silver would’ve rallied with rates this high for this long and the markets continued higher as well. Always thought your charts were good but always thought in the back of my mind that rate cuts and other news actually led. So now that I’ve admitted defeat u are free to gloat. Well deserved"Lil_G" - Seeking Alpha
I worked on trading desks at top investment banks for 10 years, then traded on my own for another 8. I've seen 100s of research from the best analysts in the business. Avi and EWT is the only one I'm willing to pay for right now."tzeyi" - Seeking Alpha
“I was 100% in equities and been killing it for 2 years, but I heeded your warning and took everything off the table. I've been cautiously trading your recommendations and now when everyone I know is getting wrecked, I'm still profiting. Thank you so much for what you do, my family and future are safe because of it.”"DoctorBeat" - Trading Room
This service has not only made me money in trades but equally important it got me out of the market before the meltdown."BigDaddyTuna" - Trading Room
"Your service and insight is phenomenal, and has definitely changed my outlook on the market. I’ve been actively working on recruiting new members to your service. It’ll save their financial life.""Bidking82" - Trading Room
"Today, I achieved my highest weekly profit ever ....I see this as a testament to the power of the guidance available here. I ignored all narratives and traded the charts with discipline. I set clear parameters for each trade, immediately placing OCO (One Cancels the Other) orders with both stops and limits. I made some adjustments as the charts evolved, but kept the orders in place, and allowed the process to unfold. Sincere thanks to all the analysts and members who help make this such an incredible community—especially Avi, Zac, Mike, Levi, and Garrett. I'm incredibly grateful!""Dre-" - Trading Room
CNBC had a stat this morning that over the last 20 years 86% of money managers/hedge funds have underperformed the market. They couldn't figure out why that’s the case given how 'smart' these people are. . . . I know my performance since joining the site has skyrocketed!"HenryH" - Trading Room