2016 Bullish Expectations In The Metals
As we move into the 5th year of this correction in the metals, I would like to take us back a bit in history before we move forward to our expectations, which should be instructive as to how we will be turning bullish in 2016. I also want to review how we treat corrections, so that you understand our process a bit better.
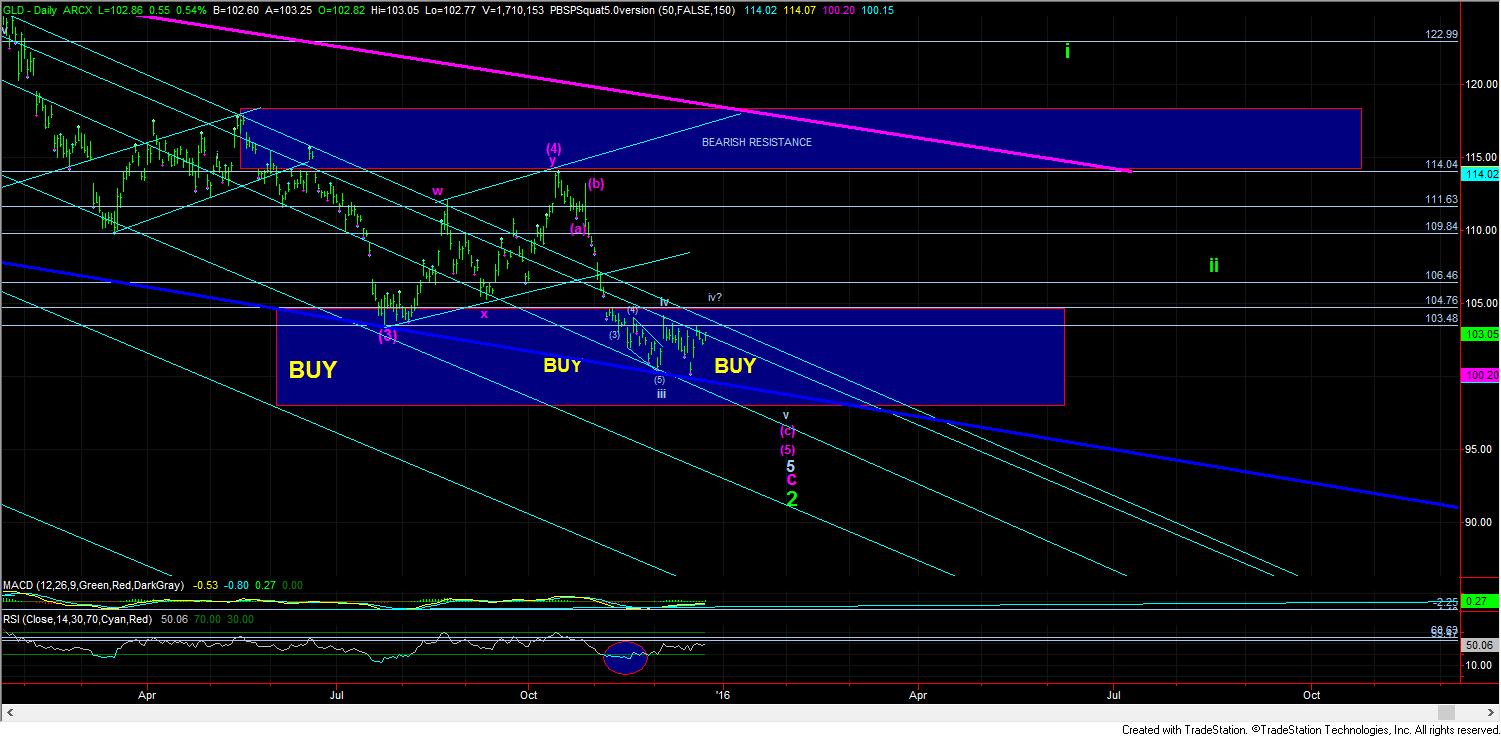
For those that have been following me since we opened Elliottwavetrader.net in 2011, you will remember that we were looking for gold to top in the $1,915 region, and then drop down to a 145 first target region in the GLD. (We moved into charting GLD over gold since that is what our members requested at the time, and I have maintained that perspective, while one of our other analysts – Arkady Yakhnis – analyzes spot gold). Gold then topped within $6 of our expected target, and then dropped down to 148, where it initially bottomed.
At the time, I noted that this “could” be the entire correction in gold, and we will need to seek confirmation for a further rally to our next higher target well over $2,200. However, we noted quite clearly that if we do not see confirmation, then it opens the GLD to drop to our next lower target in the 98-105 region. And, since we never received confirmation that the market bottomed at 148GLD, we began to look towards our lower target level three years ago, despite much disbelief by most that read our analysis at the time.
Now, even before we topped in 2011, I had noted that my ideal target for the correction in gold was the $700-$1,000 region. So, it is still “possible” that we drop down as low as the $700 region, but there is nothing on the chart right now that is suggestive of us breaking below $1,000. In fact, just like everyone was so certain we would exceed $2,000 after we moved through $1,900, it seems everyone is just as confident now that we will break $1,000. But, to be honest, I am not quite as confident, as the market does not often do what most expect. However, should the set up develop, I will certainly alert all our members at Elliottwavetrader.net so that you may prepare.
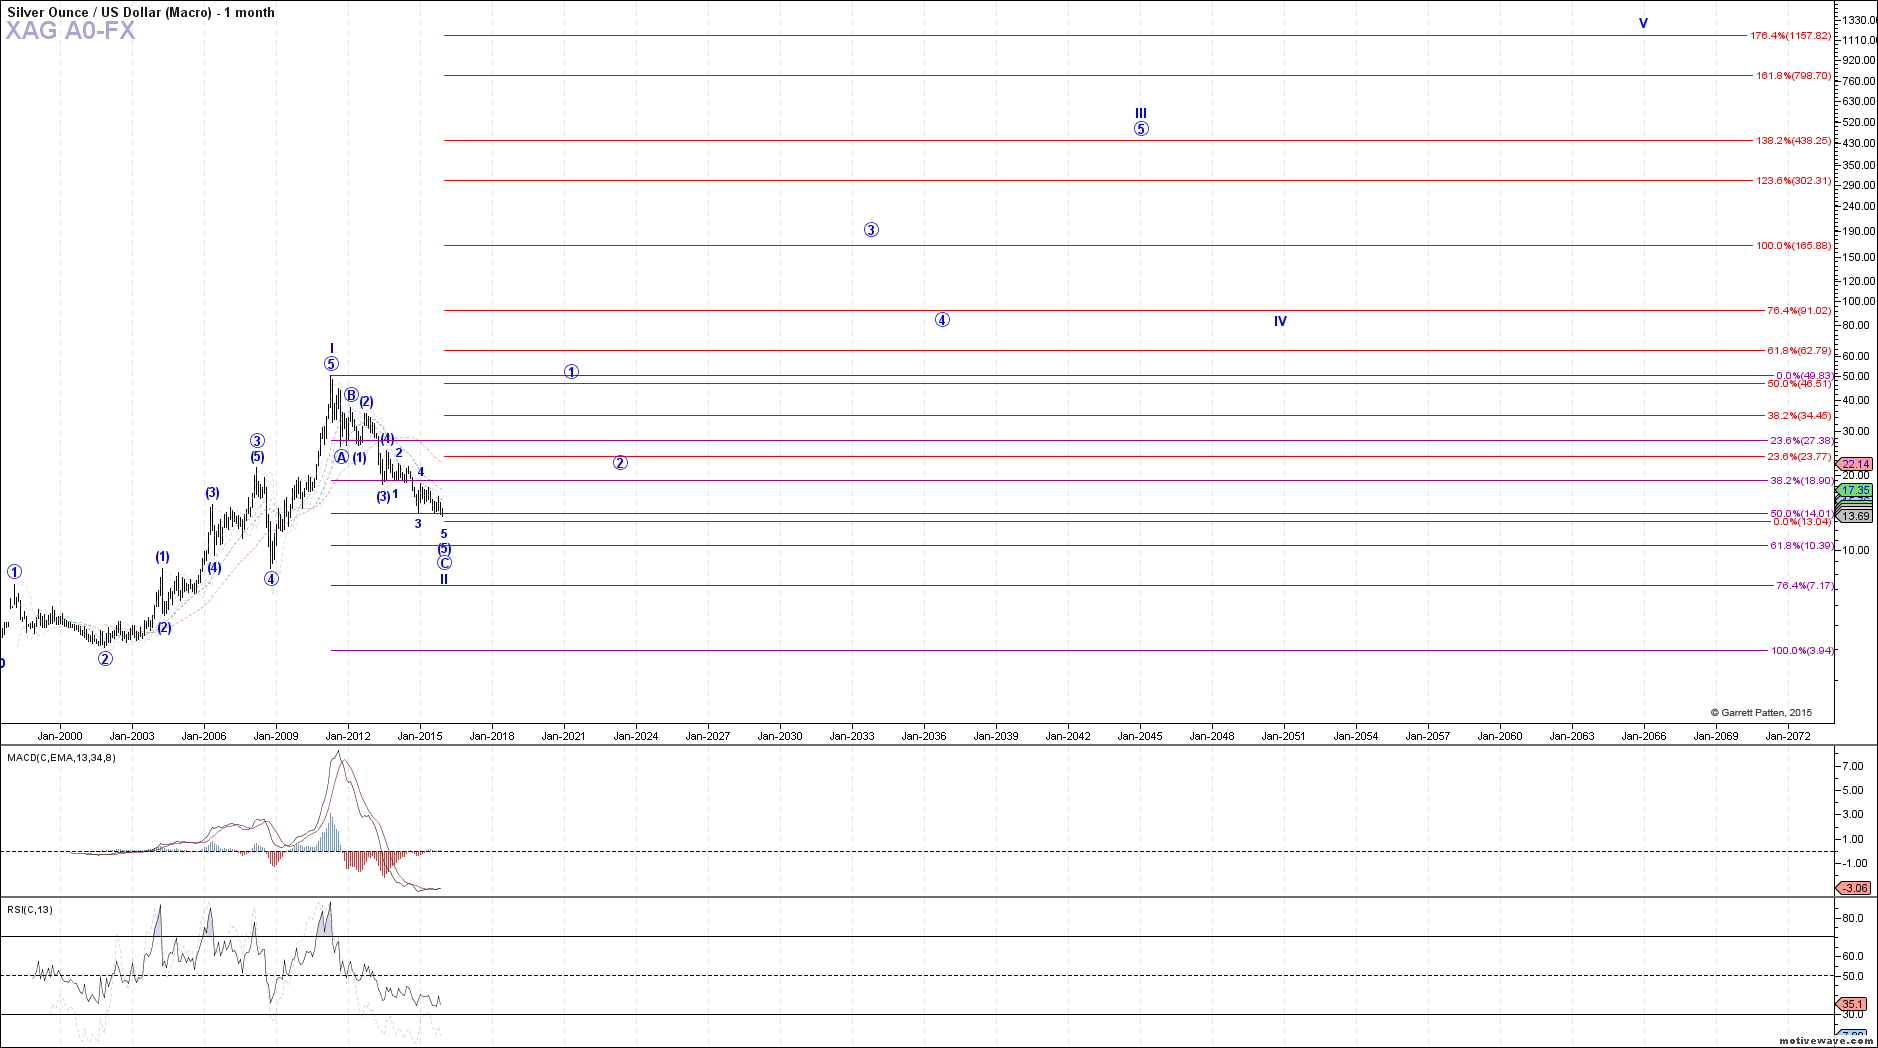
Whether the bottom will be at just over $1,000 (which is preferred at this time), or at $875, or at $700 – all 3 being strong Fibonacci target regions for the bottom in the long term gold correction - once the market finally strikes a bottom, we will go through the exact same confirmation process that I used at the 148GLD region. We will need to see a 5 wave structure off that low, followed by a corrective pullback, and then a rally over the high of the initial 5 wave structure. Until I see that play out, I will not be able to confidently state that the long term bull market has resumed. But, I will also warn you that, as we are completing an ending diagonal, the upside reaction can be quite violent once the final bottom has been struck.
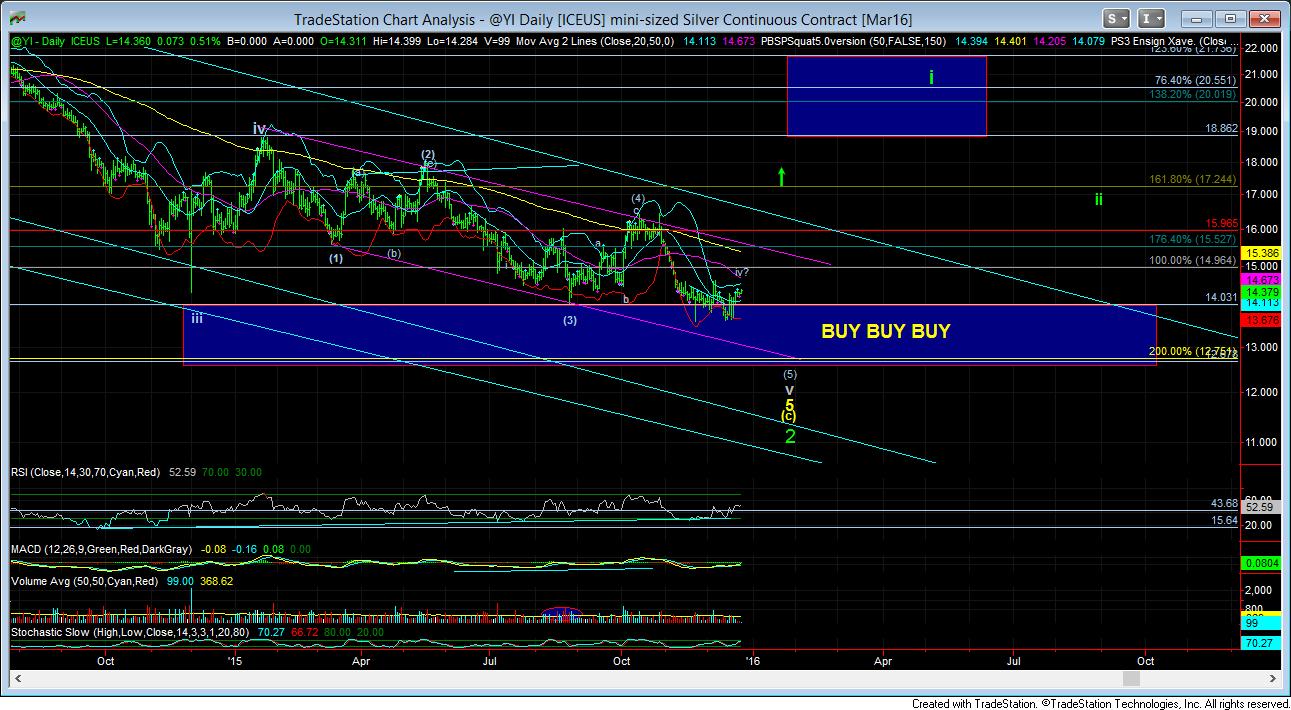
Now, to be honest, I believe that confirmation was much more important if the market would have provided a high level correction, such as in the 145-150GLD region. But, when we have dropped over 70% in the silver market from its 2011 highs, I can actually be a bit more confident that a final bottom has been struck once we hit our lower targets, and then see a strong 5 wave move off that low. So, this is what I will be seeking out once we strike our lower targets.
Moreover, due to the fact that this last segment of the correction in GLD has taken the form of an ending diagonal, it suggests that the last move down in the market will likely be a spike down, followed by an even stronger spike back up, which “should” signal the resumption of the long term bull market. And, such reversals from ending diagonals often target the region from where the ending diagonal began, and in quick fashion. That means that once we strike the bottom in the GLD, we will likely see a very strong and fast rally right back towards the 122-132 region to complete the first impulsive wave that will mark the resumption of the long term bull market. And, I strongly believe that 2016 will be the year that we declare the resumption of the metals bull market.
I would like to conclude by addressing one more issue, which should also provide some insight into how to properly approach technical analysis. Over the years, I have been questioned why I had several targets for this correction. The answer is based upon the fact that financial markets are non-linear.
You see, there is never something that will provide you with 100% certainty in the financial markets. Rather, when you trade or invest in financial markets, you are dealing in probabilities, not certainties, and your goal should be to focus upon the stronger probability scenarios. Furthermore, one has to have a very objective standard as to when one’s primary expectation is wrong, and you need to be able to make such determinations early enough so that you can realign your portfolio quickly to maintain on the correct side of the market.
So, when a market enters into a correction, there are several Fibonacci targets the market may strike during the correction. While the first target may become the final target, it is most often the second lower target which marks the bottom for the correction. But, if you automatically assume that the second target must be struck, and the market actually does bottom at the first, then you are left behind scratching your head as the market runs away from you.
So, several years ago, when the market struck our first target – which, by the way, was identified even before we began the correction – we needed to watch for confirmation or invalidation that the market was going to bottom at that first target. Once the market made it clear that the first target was not going to maintain the bottom of the market for this correction, we began looking towards our next lower target region. Even though we began looking much lower in the market in early 2013, many did not believe our lower targets, since, at the time, they seemed so low to most. But, now, we are finally within reach of the ideal targets we set even before the market topped in 2011.
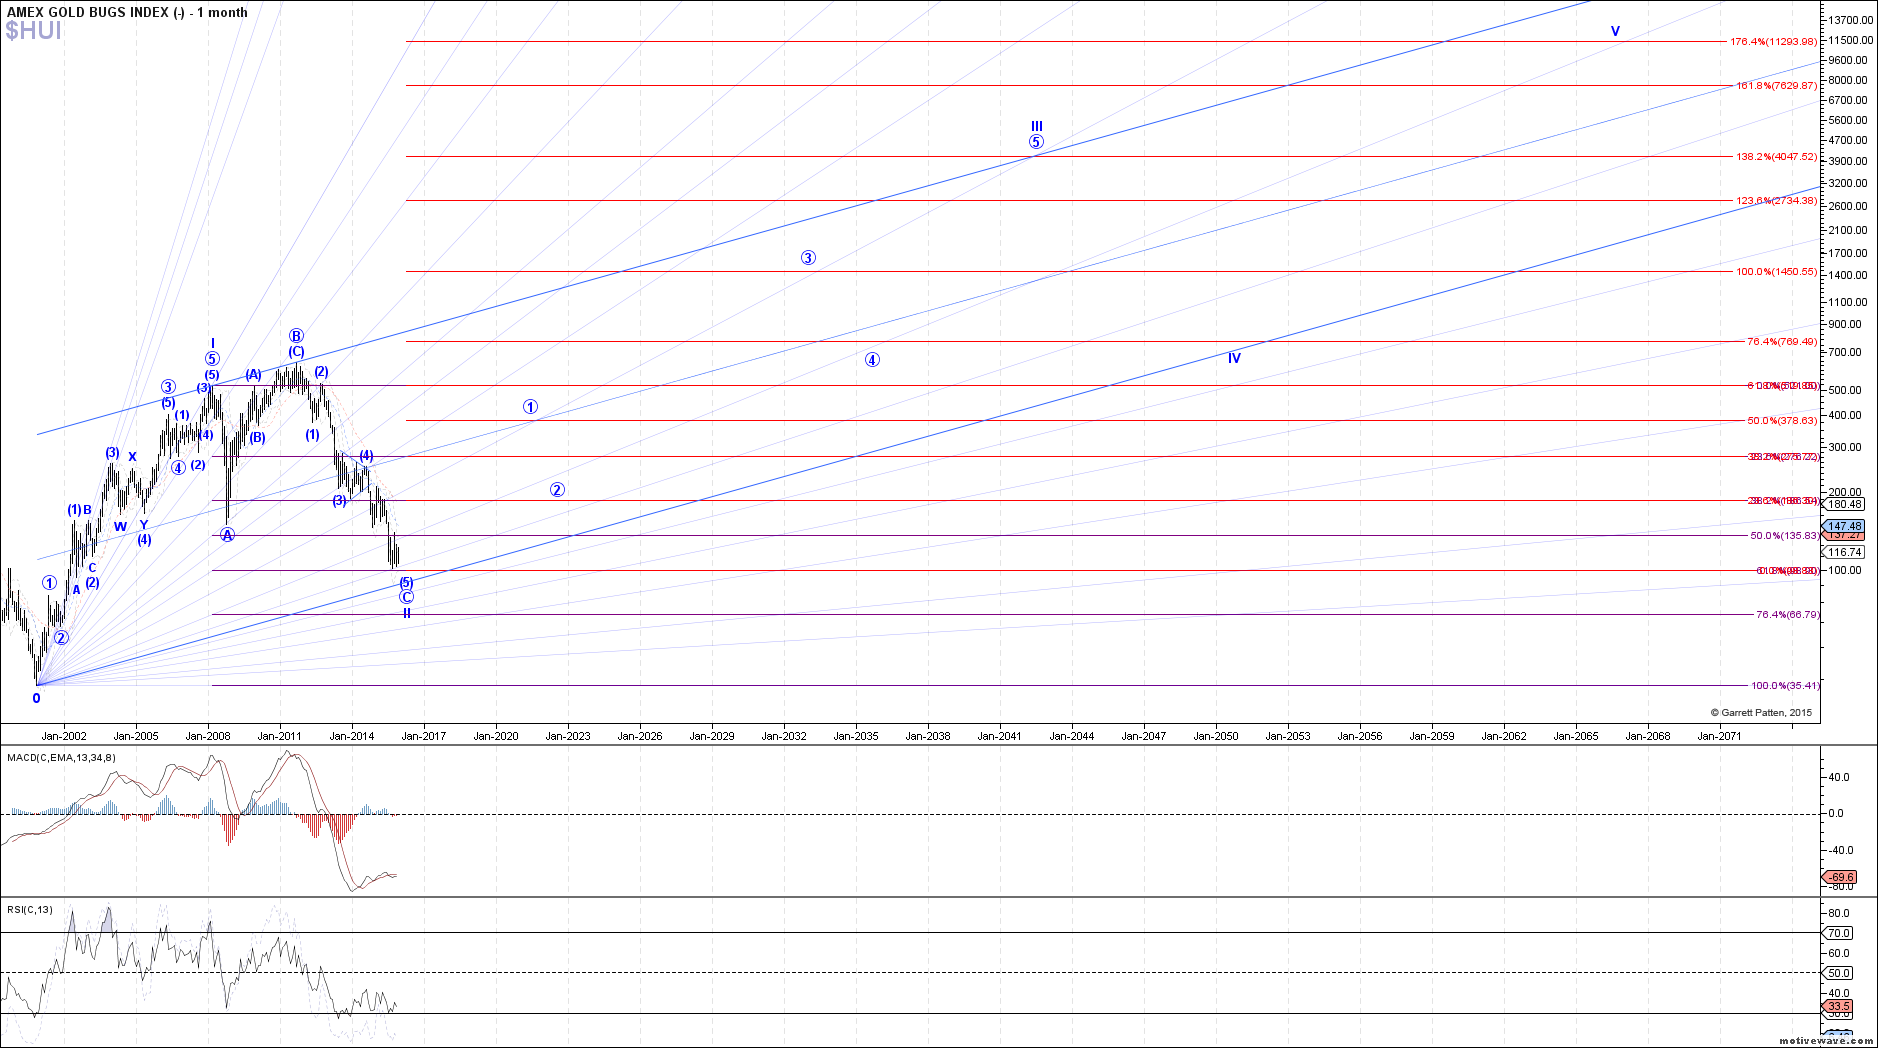
So, as we approach those lower target regions, we are doing so with an almost complete Elliott Wave corrective structure. This tells me that the next drop to lower lows which approach our long term targets can very well represent the final lows these markets see for many years to come. For this reason, I have finally been suggesting to investors that it is time to redeploy your capital to the long side in this market when it comes to the physical metals. And, for those that have been following us for some time, you will know that we are expecting a multi-decade bull market to begin in the metals complex once this correction completes.
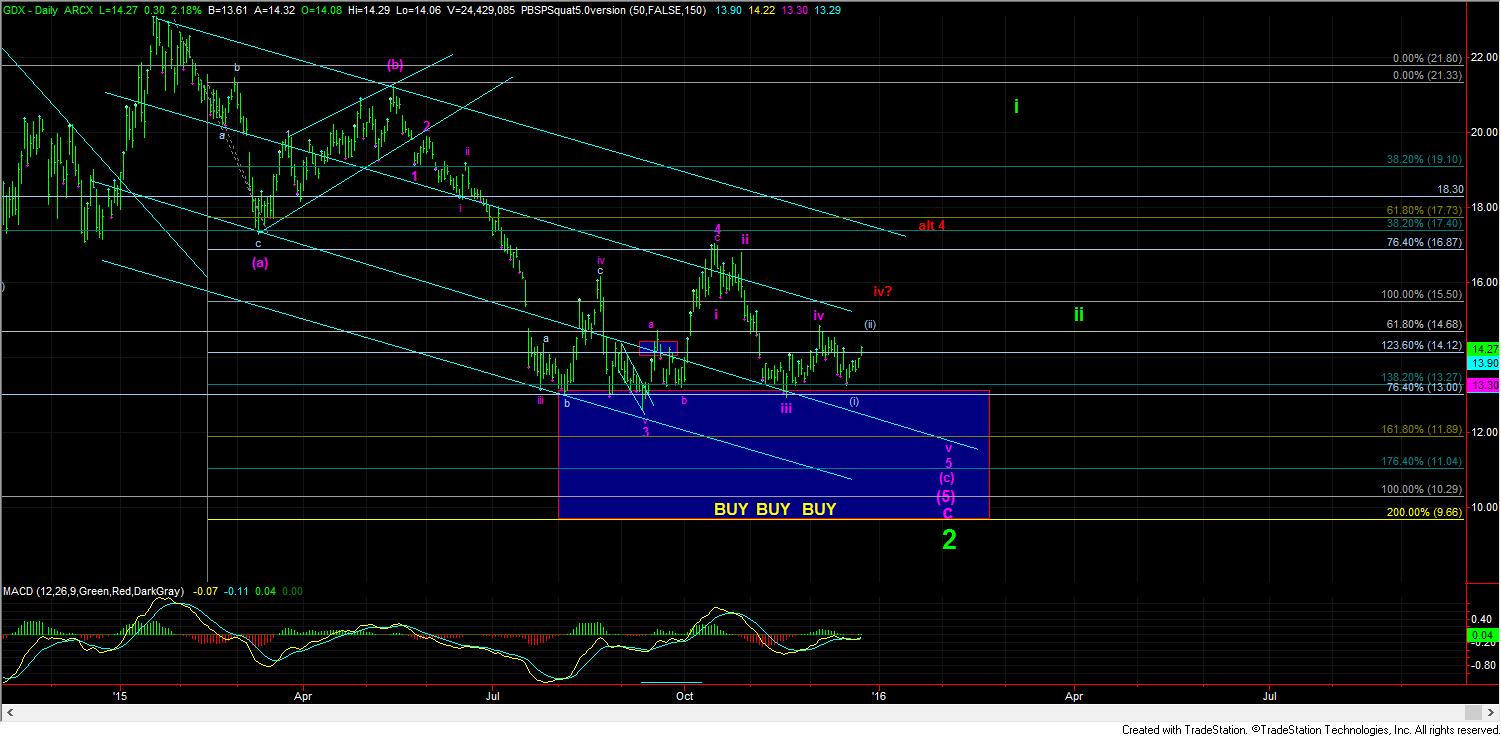
As for those that are looking to move into individual mining stocks, I am going to suggest much more caution. This past fall, we, at Elliottwavetrader.net, rolled out a Miners Portfolio service. Our management team that oversees this portfolio includes Zac Mannes, Garrett Patten, Larry White (who has led his subscribers to total returns exceeding 400% in 2015 trading miners), and myself. We often meet to review the mining stocks in which we are interested for our portfolio, which is focused upon the long term.
When reviewing the various miners, we have run across many mining stocks which clearly have not bottomed yet, some of which have set ups which suggest they could be filing bankruptcy before this correction completes. So, unless you know the market very well, and have extensive experience in this complex, I am suggesting you may want to hold off aggressively investing in mining stocks – especially the junior miners – until we have seen a confirmed bottom in this complex.
In conclusion, I want to reiterate my 2016 perspective that I mentioned above:
I strongly believe that 2016 will be the year that we declare the resumption of the long term metals bull market. And, even though I believe those interested in the long term prospects in this market should be looking at deploying their money back into physical metals, more caution is needed when it comes to mining stocks, as there is more immediate danger in that segment of the complex (especially the junior miners) until a confirmed bottom is seen.
For those that are looking to buy physical metals, I would highly suggest you visit a site of one of our trusted members, Doug Eberhardt – http://buygoldandsilversafely.com/EWT