Capitalizing On Fibonacci Price Clusters
Fibonacci price clusters are a great way to trade the stock index futures. The definition of a Fibonacci price cluster is the coincidence of at least three Fibonacci price relationships that come together in a relatively tight range.
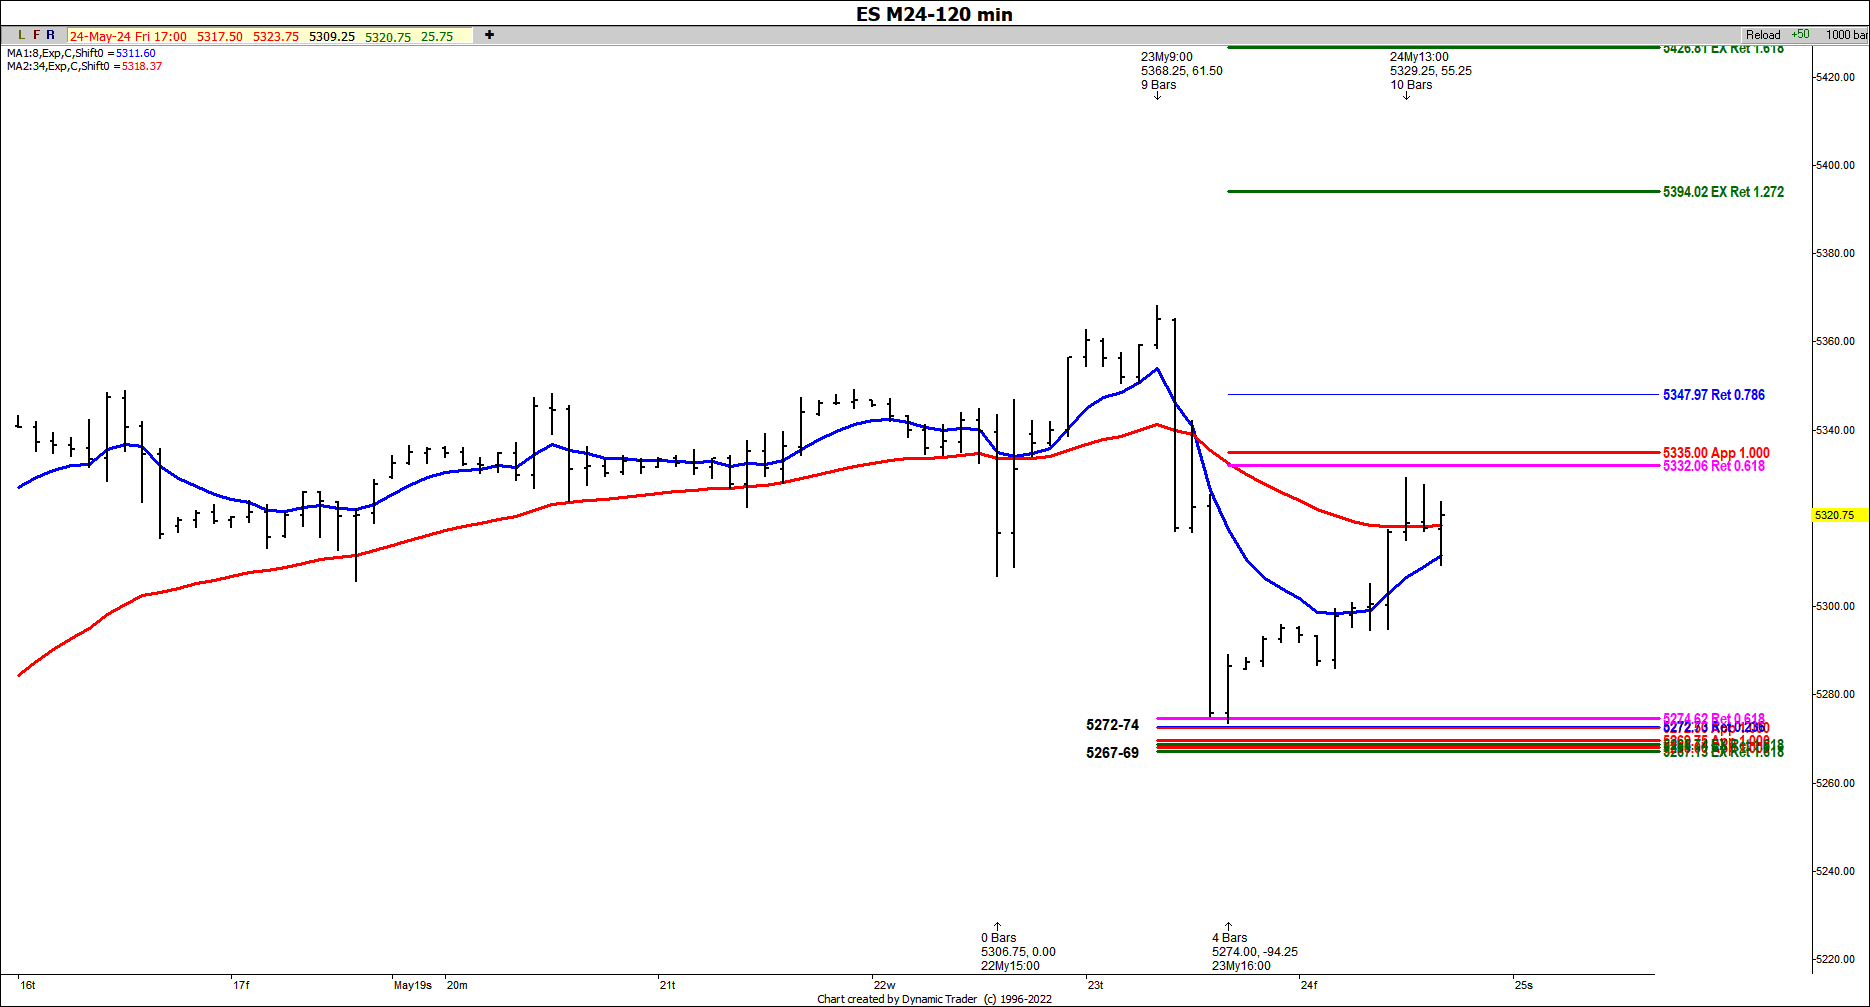
Here is a recent example of a few of the clusters we were watching in Thursday's session as the market collapsed before us.
The 120-minute ES chart illustrates these clusters. The actual low was made in the first price cluster area on this chart at the 5272-5274 area. After a hold and a price trigger against this zone, we saw a rally of $55.25 points. (More about triggers and our strategy here.)
We do currently have a hurdle of resistance we would need to clear if the rally is going to continue. If we do clear the hurdle, then bigger picture target one comes in at 5394.


