Let’s start by discussing the price analysis we run every day in the markets. There are three different types of Fibonacci price relationships we use: price retracements, extensions and projections.
First we run price retracements of prior swings for possible support or resistance using the ratios of .382, .50, .618, and .786. We also run price extensions of prior high-to-low or low-to-high swings using the ratios of 1.272 and 1.618 for possible support or resistance. The third type of price relationship we look at is what I call price projections, which are calculated using three points on a chart. This is where we are actually comparing swings in the same direction. For projections we measure a prior low-to-high swing and project from another low, or measure a high-to-low swing and project from another high. For the price projections we mostly use 100% and sometimes 1.618. (Many technical analysis packages actually call the tool using three points an extension tool rather than a projection tool.)
By running all possible price relationships on any particular chart, we work to identify one of the three trade setups every day: Fibonacci Price Clusters, Symmetry setups, and Two-Step pattern setups.
Fibonacci Price Clusters: The coincidence of at least three Fibonacci price relationships that come together within a relatively tight range. These clusters identify a key support or resistance decision.
Symmetry: The definition of symmetry is similarity or equality of swings in the same direction. We find symmetry setups by running a 100% price projection or “measured move” of a prior swing and then projecting the results from a new high or low (depending on what direction you are coming from). The only symmetry setup I like to focus on is when swings are similar or equal within the context of the trend. For example, if we are in a clear uptrend, I will measure the prior corrective declines within an uptrend and project 100% of those from any new high to help you enter the market in the direction of the trend. A single symmetry projection IS considered a setup, but the existence of additional price relationships strengthens the setup.
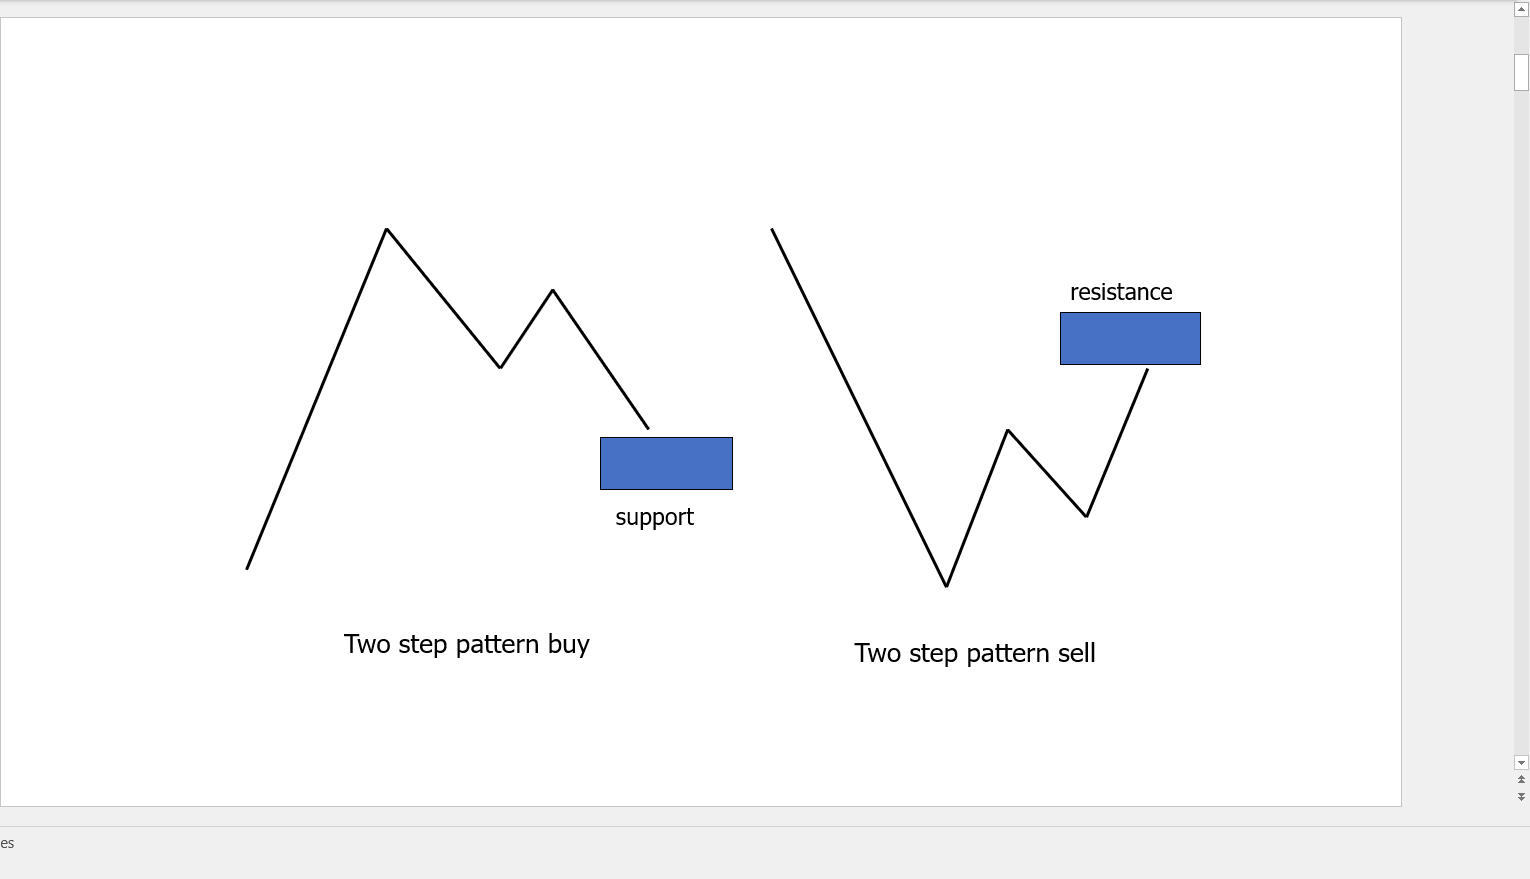
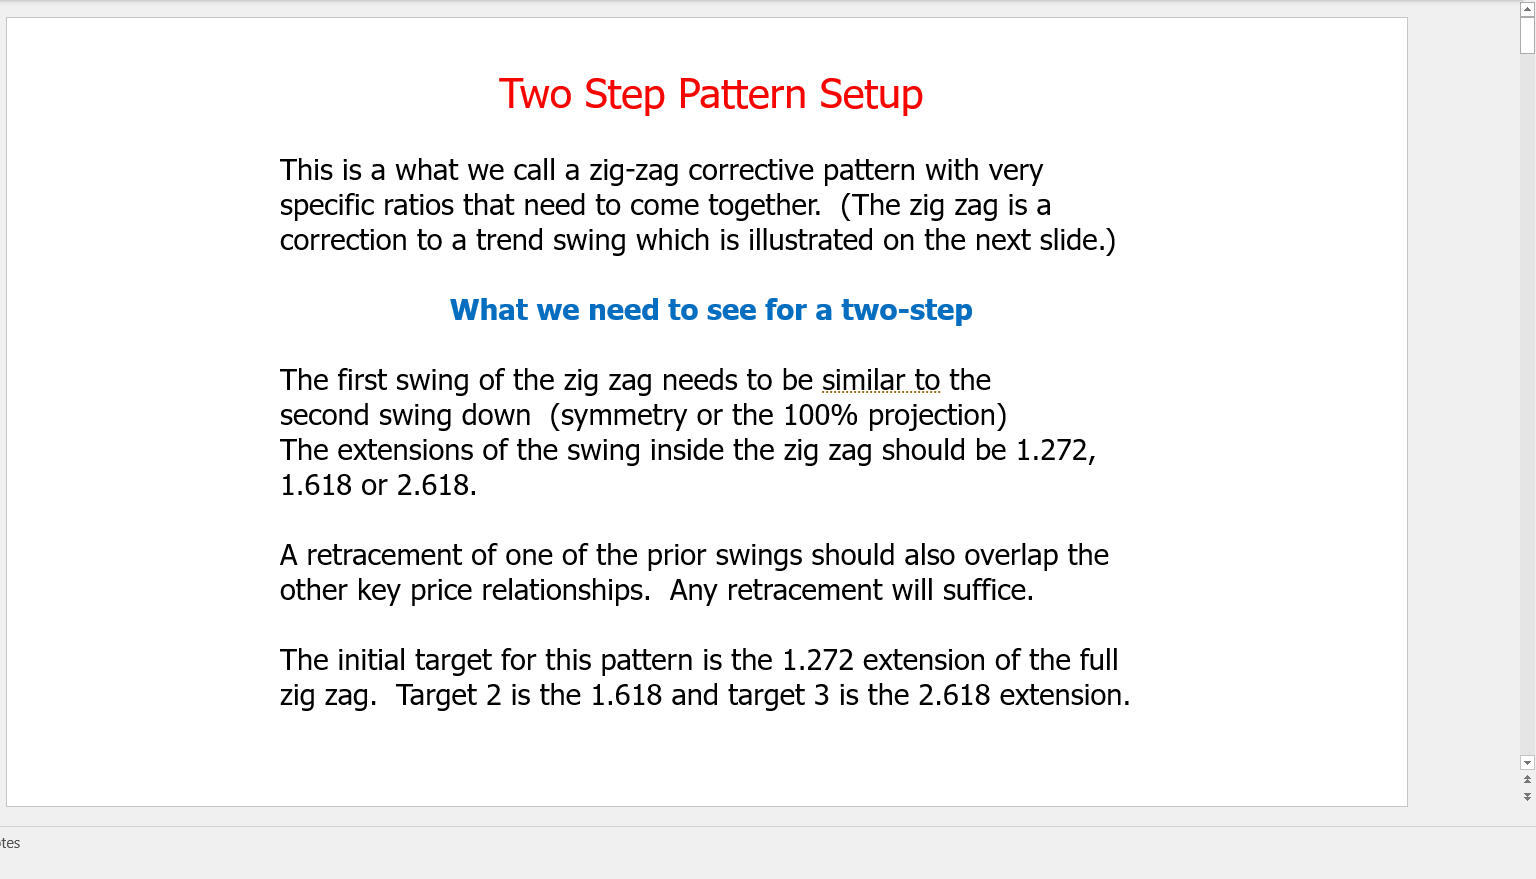
Two-Step Pattern: A Fibonacci Price Cluster setup within the context of a zig-zag pattern. You can learn more about this pattern from this Cheat Sheet post in the room and example video. I also wrote an entire chapter on this pattern in my book Fibonacci Trading – How to Master the Time and Price Advantage (McGraw Hill).
 |  |
In addition to price relationships, we run timing cycles to identify time windows for possible reversals. The cycles are generated by measuring the time between key swing high and low combinations and then projecting forward in time using the Fibonacci ratios. Similar to price, we look for a cluster of timing cycles around a relatively short time range. We also find that these windows work best when there's a clear trend going into the time window. As an example, a stock or market that's been trending down into a time window is a candidate for a potential low and reversal higher.
There are plenty of time windows that will NOT turn the market, so when trading for a potential reversal in the timing window, traders should have a plan for the trade trigger and then trade management. When in a position that's entering a timing window, we believe that it's a good idea to consider a trailing stop on the position. For more information, please watch our video covering what to look for with Timing Cycles.
Trade setups are identified every day on the end-of-day video update and some of them are shared in the EWT Trading Room. When one of these key price setup levels or zones are tested and it holds, the next step is to look for a TRIGGER entry.
The formula for success using Fibonacci Price Analysis is: Trade Setup + Trigger = Trade entry. Trade Setup - Trigger = NO TRADE. A trigger is essentially a confirmation of a reversal against the trade zone. This tells you that it is worth placing a bet against it.
In identifying a trigger, we look for EMA crossovers and pattern shifts as described in more detail in our trading plans below and also in these trigger videos and write-ups.
The highest probability entries on the daily charts are where the daily moving averages are all in agreement. This means for a buy entry that price is above the 200 simple moving average (SMA) as well as above the 50 SMA, and the 5/13 exponential moving average (EMA) combo is in a buy mode with the 5 above the 13 EMA.
For a sell entry, it’s the reverse: Price is below both the 200 and 50 SMA, and the 5/13 EMA combo is in a sell mode with the 5 below the 13 EMA.
The odds are the highest when all of these are in agreement. When these averages are ALL supporting a trade setup, I call it a ROYAL setup.
But keep in mind, I only use this definition when referring to the DAILY charts. On all my intraday charts, you will see an 8 EMA and a 34 EMA used for triggering entries and to help identify the trend. You can also use the 5/13 ema combo for a more aggressive entry trigger, but please test it first to make sure there are not too many false triggers.
When a trigger is met, we enter a trade and define our maximum risk on a buy cluster just below the low end of it OR below the low made prior to the reversal trigger. For a sell cluster the maximum risk is just beyond the high end of the resistance cluster or above the high made after the sale is triggered. We use triggers because they will filter out many of the price cluster zones that are not likely to hold. Keep in mind that many of these zones are violated every day. When one is tested and holds, however, the rewards can be significant.
Initial trade targets are calculated using the same Fibonacci ratios, with the initial targets for a trend trade setup being the 1.272, 1.618 and then 2.618 extensions.
In terms of deciding to hold overnight, one thing I like to watch is the 30-minute chart with the 8/34 EMA combo. If it is in a sell mode with the 8 EMA below the 34 EMA, ideally you don’t take or keep a buy overnight as the chart will be vulnerable to the downside. You can hold a short over night, though.
If the 30-minute chart is in a buy mode with the 8 EMA above the 34 EMA, then it’s a safer bet to hold longs overnight and I would not want to keep a short position overnight.
PLEASE BE AWARE of earnings dates for any of the stocks you TRADE. Please don’t hold through earnings unless you know EXACTLY what you are risking. (For example you can use a relatively low risk options strategy.) You can find these earnings dates on earningswhispers.com.
The Formula to make money with my trade setups is Setup + Trigger = Trade Entry and then you simply manage the trade. Please note: NO trigger = no trade.
Step 1: Identify the setup you’re trading
As a reminder, the setups are Fibonacci Price Clusters, Symmetry, and a Two-Step Pattern.
If price tests and respects the setup zone, then drill down to a lower time frame chart to watch for a Trigger. By using a lower time frame chart, you’ll normally get a Trigger much closer to where your RISK is defined.
Step 2: Set your Triggers & Trade (DAY TRADING)
The suggested Trade Setup charts to use are: Daily, 120 minute, 30-minute, 15-minute or 5 minute.
The suggested Trigger Time Frame charts are: typically 1-5-minute charts for stocks; 1-5 minute or tick charts (e.g. 233 or 377) for futures. As an example, you could use a 120-minute chart for the Trade Setup with a 377 tick chart for Triggers. When there’s a potential setup, go to your Trigger time frame to watch for a signal.
Buy Trigger – 8 EMA crosses above the 34 EMA AND a prior swing high is taken out. You can either take the initial trigger or wait for the next pullback after the trigger.
Sell Trigger – 8 EMA crosses under the 34 EMA AND a prior swing low is taken out.
Trigger Notes: You can either take the initial trigger or wait for the next pullback after the trigger. If you are NOT comfortable with the risk, then don’t take the trade! Many times waiting for the pullback is a better option. If you have trouble identifying a prior swing high you can just use the crossover to start with.
Step 2: Set your Triggers & Trade (SWING TRADING - overnight & longer-term trades)
The suggested Trade Setup charts to use are: Daily, 120 minute, 30-minute, 15-minute or 5 minute.
The suggested Trigger Time Frame charts are: typically 1-5-minute charts for stocks; 1-5 minute or tick charts (e.g. 233 or 377) for futures. As an example, you could use a 120-minute chart for the Trade Setup with a 377 tick chart for Triggers. When there’s a potential setup, go to your Trigger time frame to watch for a signal.
Buy Trigger – 8 EMA crosses above the 34 EMA AND a prior swing high is taken out. You can either take the initial trigger or wait for the next pullback after the trigger.
Sell Trigger – 8 EMA crosses under the 34 EMA AND a prior swing low is taken out.
Trigger Notes: You can either take the initial trigger or wait for the next pullback after the trigger. If you are NOT comfortable with the risk, then don’t take the trade! Many times waiting for the pullback is a better option. If you have trouble identifying a prior swing high you can just use the crossover to start with.
Step 3: Manage the Trade
Initial Stop Suggestions
Buy Setup:
Option 1: Place a stop below the low made prior to the Buy Trigger.
Option 2: Place a stop just below the low end of the Price Cluster Setup (30-50 cents below on stocks for example).
Sell Setup:
Option 1: Place a stop below the low made prior to the Sell Trigger.
Option 2: Place a stop just above the high end of the Price Cluster Setup. This option may risk a little more initially, but, as long as the extra risk is not unreasonable, it also gives you two chances for the trade to work.
Exits & Targets
Option 1: Exit partial position at 1.272 target and continue to use a trailing stop on the balance.
Option 2: Use a trailing stop on the full position and see what the market gives you. If you do not already know the target, run the 1.272, 1.618, and 2.618 extensions of the swing into the setup zone.
Trailing Stops:
Protect profits by moving a stop to breakeven when possible (this will depend on the risk tolerance of the individual).
Consider a trailing stop using symmetry projections, or moving averages, or prior swing lows or highs. You can also use other TRIGGERS, like other moving average combos or a “squeeze” trigger, but just be sure to test them first and then remain consistent when you choose one.
The decision of how to trail the stop depends on how much you are willing to risk to try to stay in for a bigger move. Whatever method you choose should be tested through paper trading first before being applied to real money trading!
An ATR trailing stop might be ideal. I would use this on a lower time frame chart that can be chosen according to the trader's risk tolerance.
For examples of trades and triggers please watch my YouTube videos.
Please click here for access to Carolyn's Intro PDF.

I live Finance. 80hrs a week corp finance. I trade as a hobby and in my opinion this is the best site in the world for someone to learn about markets... i rue the day when it is no more or its core is changed. there is NO BETTER SITE IN THE WORLD to get the off-cuff input/feedback/knowledge across ALL MARKETS like this site... Thank you to the analysts here who grind out thousands of charts each week."GibsonDog" - Trading Room
My faith in God and my faith in Avi and his team. God lead me to this service over 10 years ago. For a decade I have heard Avi point his bat at this very moment in time calling this S&P level. Though the years I have witnessed him point his bat months, even years before metals hit their highs and lows with almost perfect big picture accuracy. Against every other analysts opinion. I have seen him bullied relentlessly on his public articles on SA and stick to his guns and proven so correct with no one ever apologizing or admitting he called it."sdmavrick" - Seeking Alpha
My AUM has grown exponentially because of you and I can't thank you enough. My biggest regret is not signing up sooner! You've done more good than you will ever know."AAMilne" - Trading Room
I’ve subscribed for 5 years now and I have to say I see that you’ve been right on this the whole time. Who would’ve thought gold and silver would’ve rallied with rates this high for this long and the markets continued higher as well. Always thought your charts were good but always thought in the back of my mind that rate cuts and other news actually led. So now that I’ve admitted defeat u are free to gloat. Well deserved"Lil_G" - Seeking Alpha
I worked on trading desks at top investment banks for 10 years, then traded on my own for another 8. I've seen 100s of research from the best analysts in the business. Avi and EWT is the only one I'm willing to pay for right now."tzeyi" - Seeking Alpha
“I was 100% in equities and been killing it for 2 years, but I heeded your warning and took everything off the table. I've been cautiously trading your recommendations and now when everyone I know is getting wrecked, I'm still profiting. Thank you so much for what you do, my family and future are safe because of it.”"DoctorBeat" - Trading Room
This service has not only made me money in trades but equally important it got me out of the market before the meltdown."BigDaddyTuna" - Trading Room
"Your service and insight is phenomenal, and has definitely changed my outlook on the market. I’ve been actively working on recruiting new members to your service. It’ll save their financial life.""Bidking82" - Trading Room
"Today, I achieved my highest weekly profit ever ....I see this as a testament to the power of the guidance available here. I ignored all narratives and traded the charts with discipline. I set clear parameters for each trade, immediately placing OCO (One Cancels the Other) orders with both stops and limits. I made some adjustments as the charts evolved, but kept the orders in place, and allowed the process to unfold. Sincere thanks to all the analysts and members who help make this such an incredible community—especially Avi, Zac, Mike, Levi, and Garrett. I'm incredibly grateful!""Dre-" - Trading Room
CNBC had a stat this morning that over the last 20 years 86% of money managers/hedge funds have underperformed the market. They couldn't figure out why that’s the case given how 'smart' these people are. . . . I know my performance since joining the site has skyrocketed!"HenryH" - Trading Room