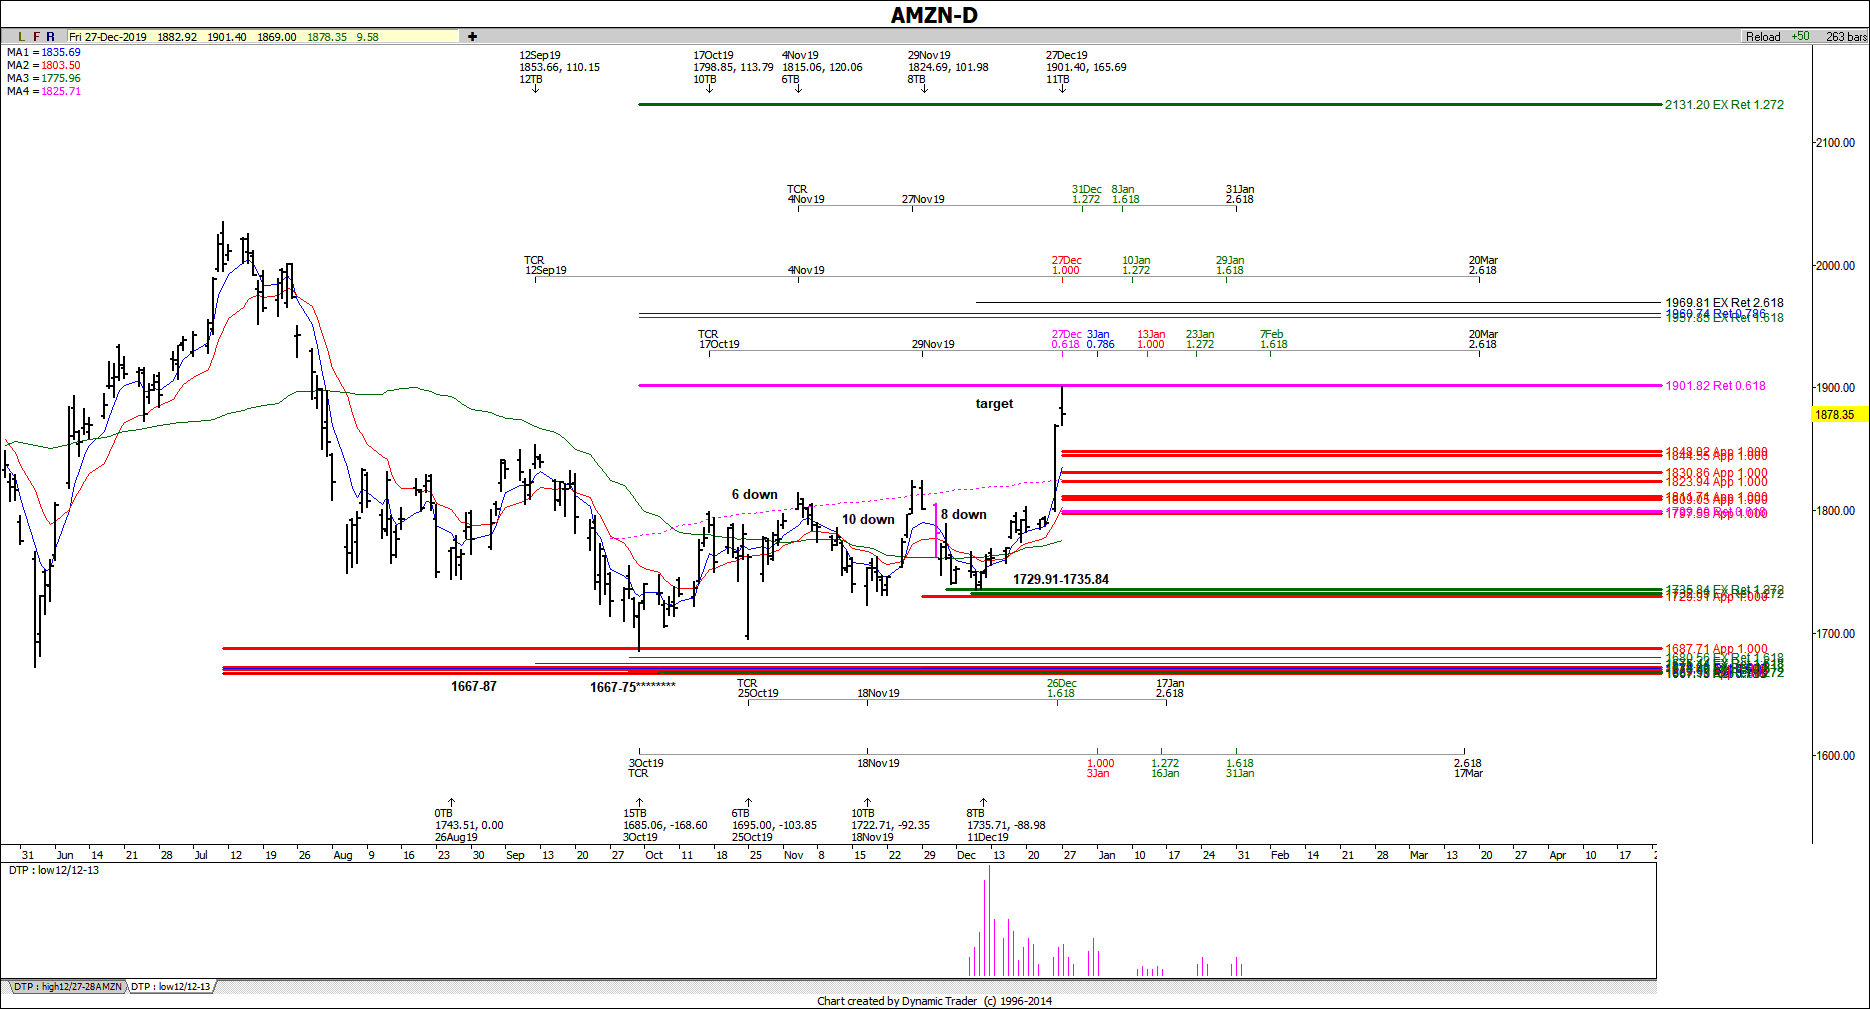
Chart on AMZN - Market Analysis for Dec 27th, 2019
In our Fibonacci Set-Ups section in Stock Waves, the AMZN trade set-up from December 12 bore fruit as the stock popped late this past week. On December 12, our 30-min chart of AMZN triggered an entry around the 1748 area. The stock blew through three upside targets on Thursday and Friday, reaching a high of 1901.40, nearly a 9% gain.


