Using Timing Factors To Identify NDX Reversal
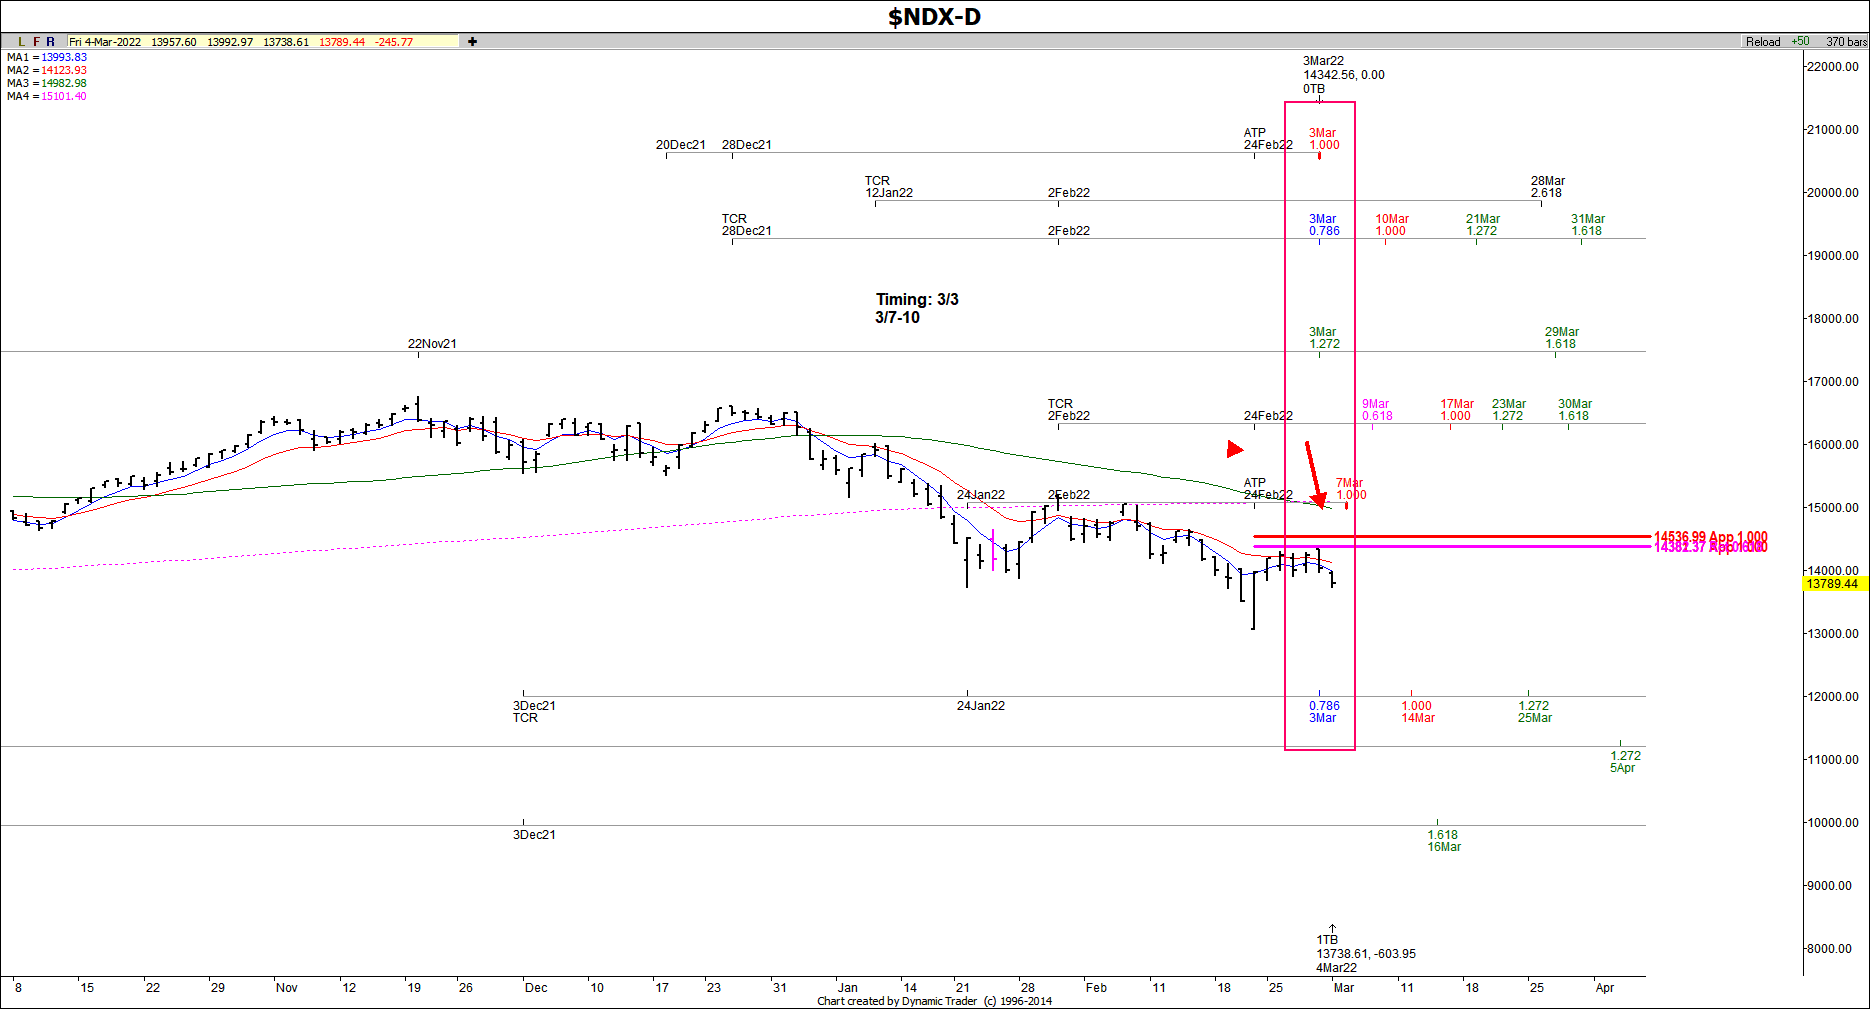
This is how we use timing factors to help identify reversal points. On this daily timing chart of NDX, we were watching for a possible downside failure due to the pattern along with the moving averages.
At the same time that we were testing key daily support in NDX, we also had the confluence of four Fibonacci time relationships that came due on 3/3. The actual high was made on 3/3, and so far we've seen a downside reversal of 603 NDX points.
Match this up with the Elliott Wave work when it makes sense!! Note that we are looking for a pullback to the last key low at a minimum.


