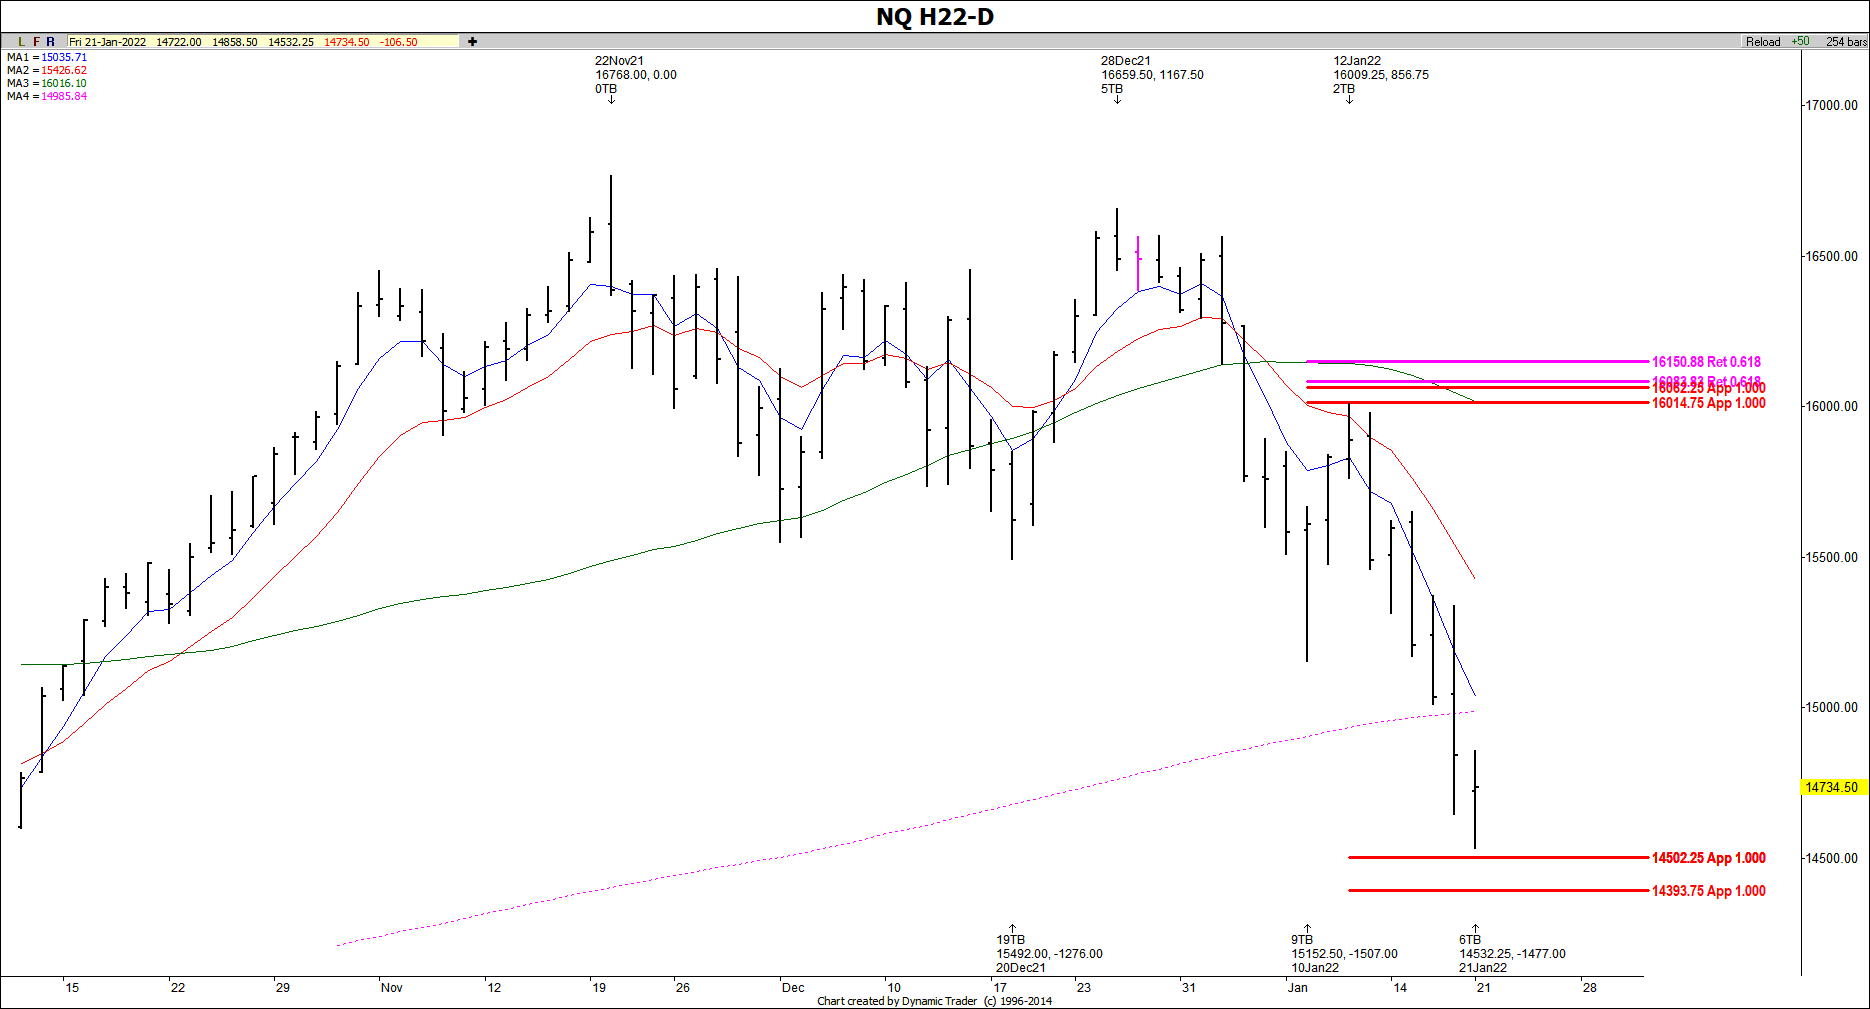
Using Fibonacci Analysis To Capture NQ Short Trade
Since the overall market has been breaking down, we wanted to watch for a possible sell entry in NQ on Jan 12.
The resistance started in the 16,014 area. The actual high was made at 16,009, which is considered close enough. Once we saw a 30-min sell trigger we knew we could take a short.
Two downside targets have now been met, and a decline of 1477.00 was seen from that last high. At this point we are trailing down stops on any shorts since we are extending and have timing between now and early next week for a possible tradable bounce.


