Tracking The Energy Sector In Stock Waves
 By
Zac Mannes
By
Zac Mannes
Stock Waves has always followed the Energy sector closely, but even more so since the 2020 lows. While many might have known that XLE needed a retrace after ripping over 100% to the upside from that March low, few saw a deeper retrace from that looming in August. True, the July 2020 low was technically enough for all of a pullback, as many of the names we follow clearly looked like merely b-wave bounces inside a wider and deeper consolidation. Sure enough, the sector faded further into September and October 2020 to our targeted support. It was at this point that Stock Waves co-host Garrett Patten and I became exceedingly bullish on the Energy sector for what should AT LEAST be a measured move equal to or greater than that first move off March 2020.
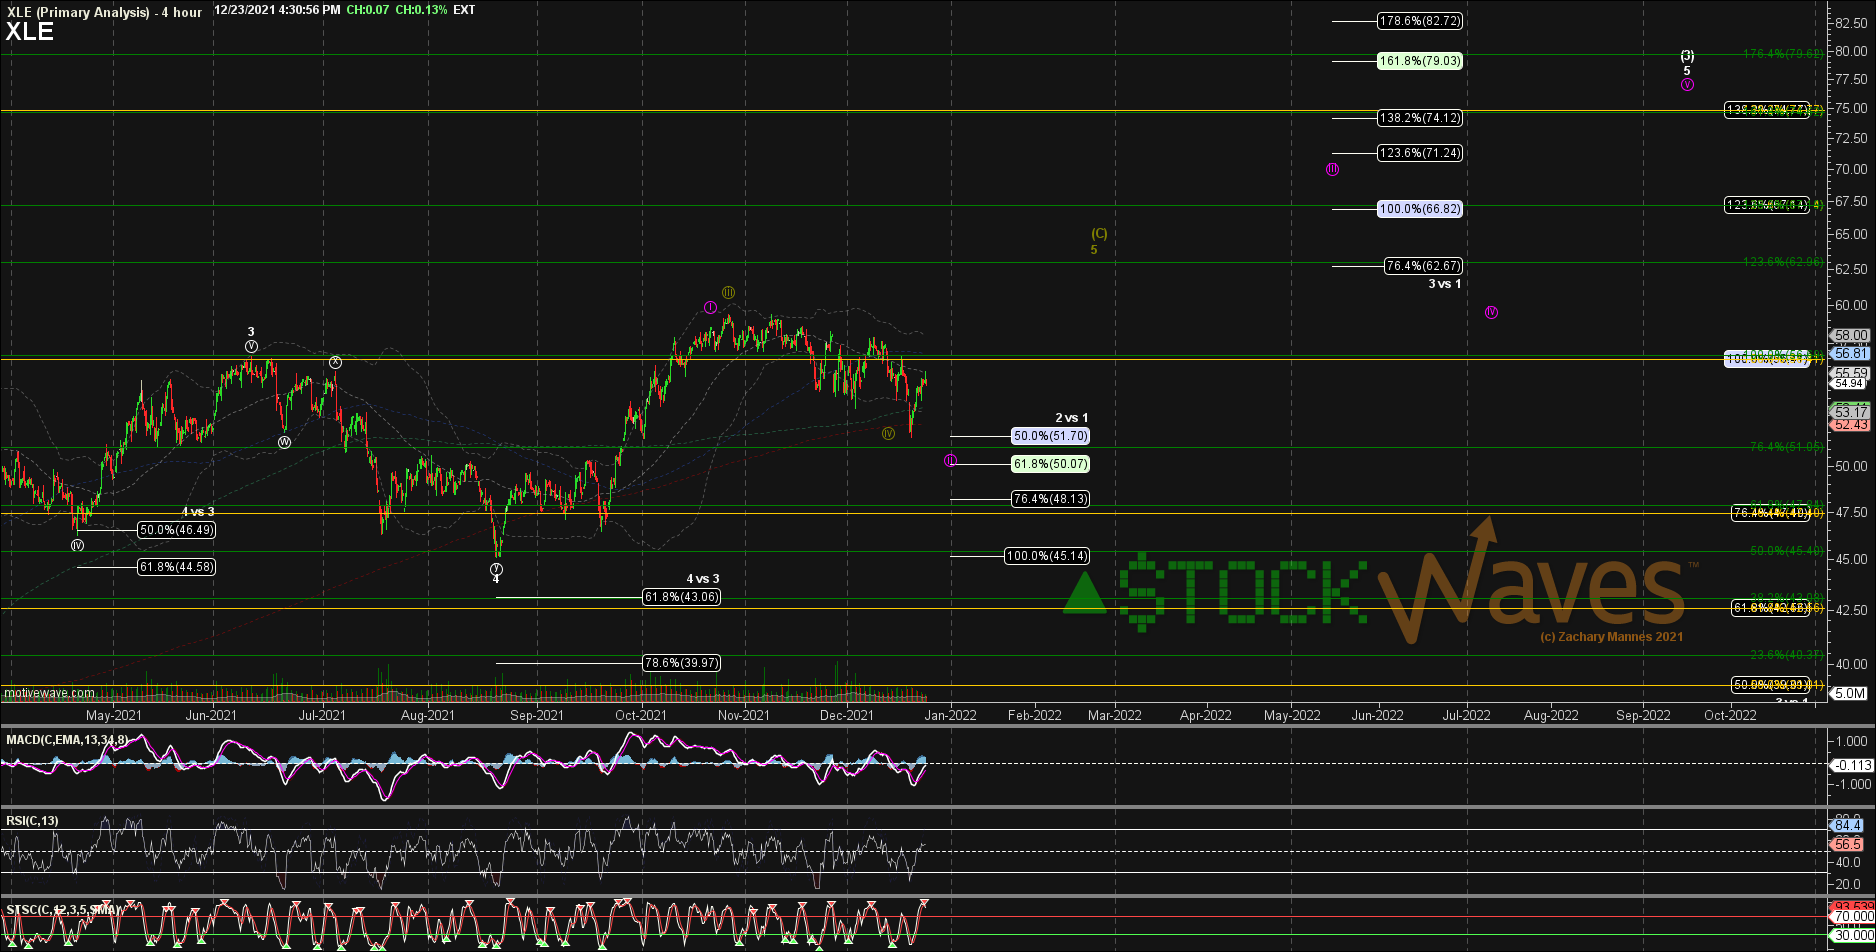
Fast forward to December 2020, and XLE/XOP along with many of the key components we follow had the makings of a 1-2 start inside a much larger (3)rd. We highlighted many of our favorite examples in this article here.
Over the next 6 months XLE/XOP and most of the components did travel nicely higher, but the way in which they did so had us shifting our impulsive count looking for 1-2-3-4-5 inside a (3)rd wave to a diagonal, making the sub-wave inside that (3) an ABC. This allowed for some consolidation as a B wave from the May/June highs in 2021. Now consolidations in Elliott Wave can sometimes fill out in TIME rather than PRICE. Into August 2021, while a reliable structure for a B-wave inside that larger (3) was a bit ambiguous in XLE itself, many of those key components we follow closely could count clearly as a B so much so that it was worth giving the same count the Benefit-of-the-Doubt on XLE and XOP.
As many things were holding a small move up and higher low off the Aug 2021 low, we added 6 Wave Setups in September 2021 in the energy sector and highlighted numerous charts with similar patterns looking for a C wave up inside the larger (3) proportionate to the “A” wave we saw off October 2020 into May/June 2021. The six performed as follows:
- CDEV (now “PR”) posted on Sep 1 targeting 11 hit that level in Nov 2022.
- APA posted on Sep 1 targeting 50 hit that in June 2022.
- MPC posted on Sep 2 had an original target of 78, but morphed to a more extended “purple” ED we were seeing signs of in many other names. MPC hit 116 in June 2022.
- MTDR posted on Sep 3 targeting 73 came close in June, and then hit that on the "B" of (4) in Nov 2022.
- PUMP posted on Sep 23 soared 130+% into the June high for its C of (3).
- AR posted on Set 24, with an initial target of 34, hit 50 in June 2022, also +130%.
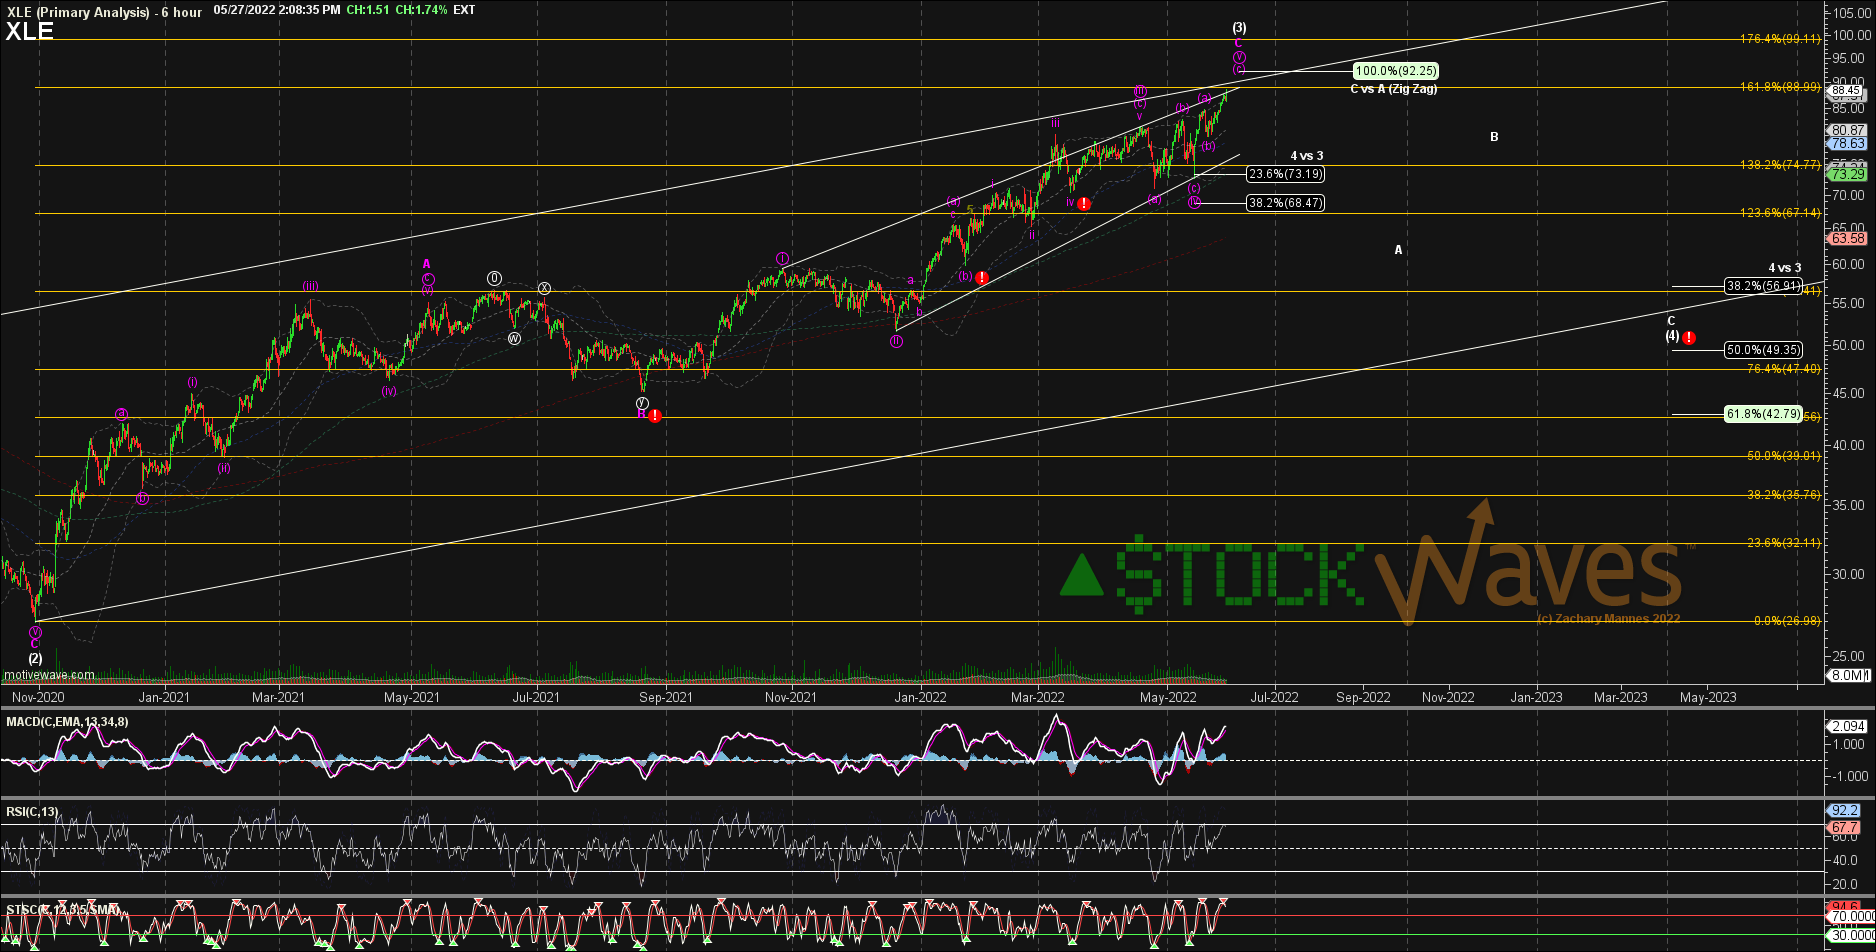
I mentioned a “purple ED” above. In early November 2021 we started to see potential for that move up from August to be JUST a wave i of a much more extended Ending Diagonal for the same C of (3). This allowed us to look for a small degree consolidation as ii, but then significantly raise many of our targets for both existing Wave Setups from August and new ones as well as many for other charts we followed closely but did not make actual Wave Setups.
We added 7 more new Wave Setups in November as many charts were holding the possible i-ii of the more extended C of (3). Among them, EOG, which was posted on Nov 10 targeting 120+ and also showing very similar potential to LBRT & KMI, went up over 50% into the June high.
On Nov 24 we started highlighting the stronger candidates for the i-ii of the "purple ED" for a much more extended C of (3), among which:
- OIH, with the C of (3) shown at 330 and our Wave Setup "target" at the iii of C at 276, hit 333 in June.
- HAL, with a target of 41 for the same purple i-ii of C, hit 41 in April for just the iii of C.
- NBR, with again the same i-ii of C of (3), blasted up over 150% into April.
On Jan 3 we added two more -- HES and PDCE -- also showing i-ii of a much more extended C of (3), and they went up +100% and +74%, respectively!
Even into the end of January and early February when most of the easy part of these moves on some names might have been done and we might have shown a few names that could potentially count as coming into local resistance, we were looking for more horses that could lead to even further extensions. We posted new Wave Setups on KMI and EPD. These did move higher from the Wave Setups but on more muted moves into the same May/June top as most things, as we warned on May 27 (see below).
On Feb 9 we posted a new Wave Setup on LBRT. We were looking for it to be late running and "catch-up" to others. It flew up +90% into May!
EVEN in MAY 2022 when MOST charts were reaching the Fib targets for C of (3), we were showing where support for ivth waves could still hold and allow for vth waves even higher in the C of (3). While we added a few new Wave Setups, we started to make sure members understood that the risk skew was very different than at the Sep and Dec 2020, and Aug and Nov 2021 lows. We encouraged members to at least raise stop levels on most positions to at least lock in a healthy portion of the tremendous gains we had seen and also made sure they were aware of key support levels on each chart below, which would likely indicate a larger consolidation was starting. The new Wave Setups had a much shorter-term time horizon and were more “scalps” in nature.
On May 13 we posted a short-term "W" (weeks) Wave Setup on MTDR. This was one of the best examples of the potential to be holding just a iv of C and reach for OMH (one more high) as a v of C of (3) targeting 65. MTDR hit 65 for a +50% move.
On May 18 we posted PDCE, which was the same setup as MTDR, targeting OMH as the vth of C of (3) in a s/t "W" setup. MTDR got a move up to a new high for a +40% gain.
We continually showed the next resistance levels, next extension levels and support levels for all of these and many others we continued to follow very closely.
It was not until May 27 that I made a Special Update for members, found here, and even there said, "We have now started to raise awareness for our subscribers that we are heading into thick resistance as the confluence of Fib levels for the targets for most of those moves. There is still room for extensions, but the risk SKEW is no longer very favorable."
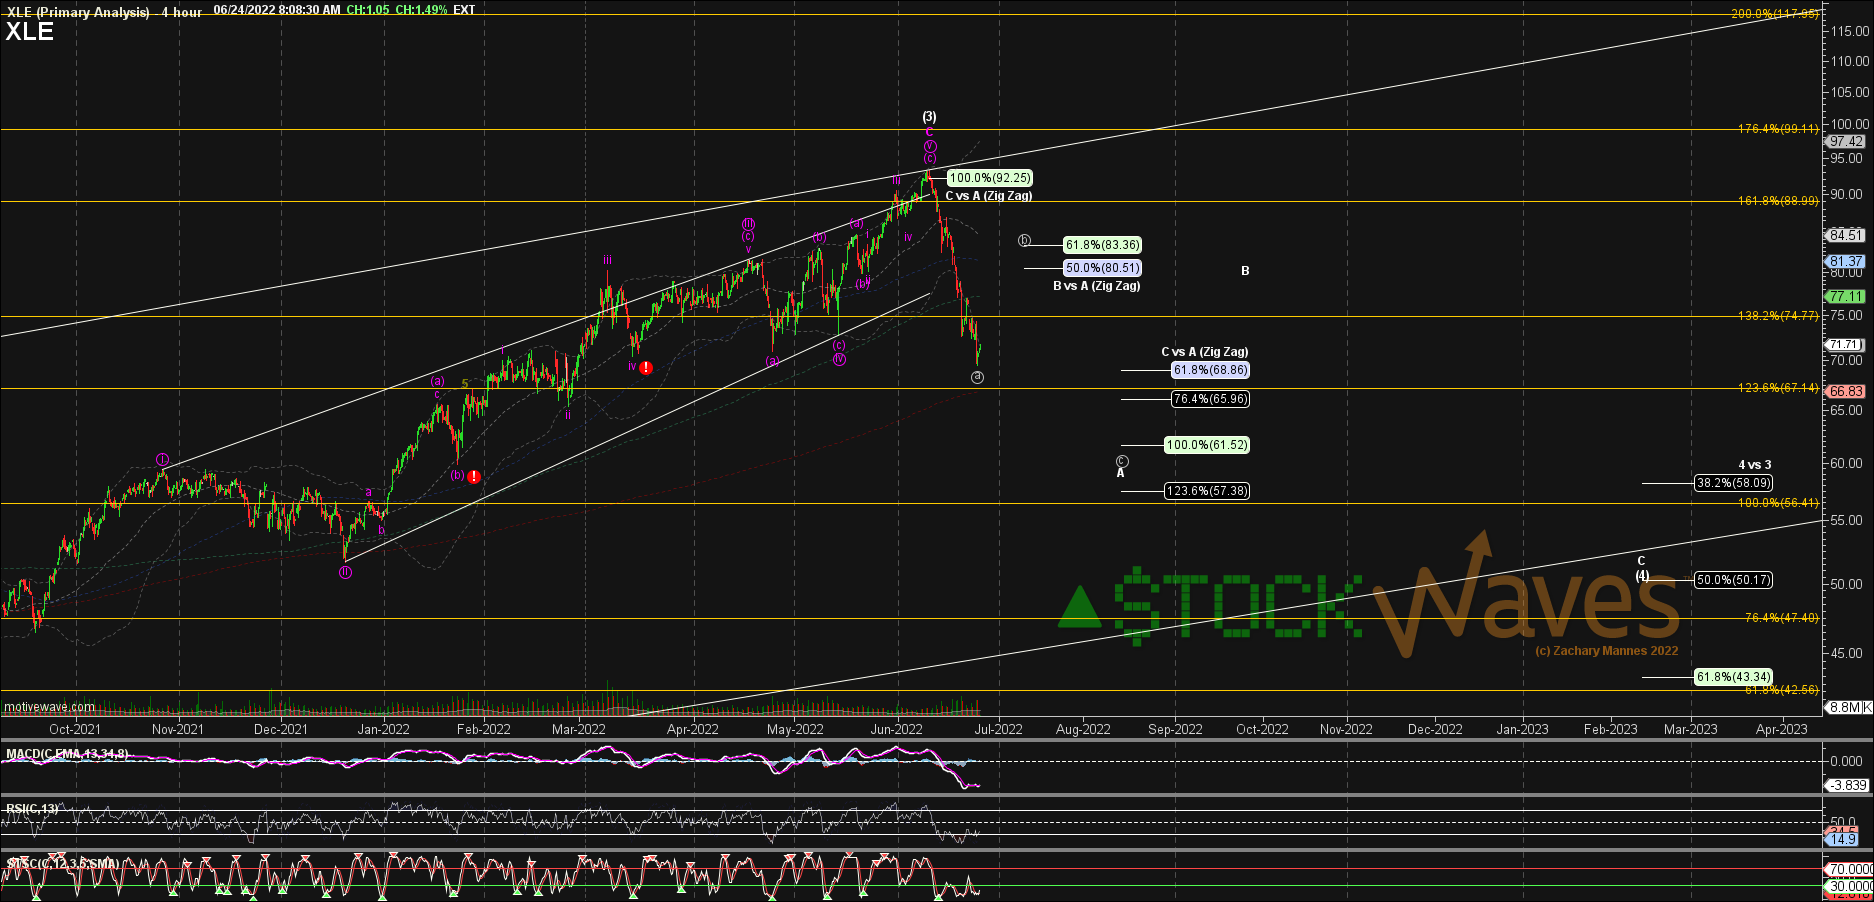
You might not recall, but the sector only managed to creep a little higher from May 27 into early June and then dropped -30%, which we counted as the "A" wave of (4) and were then looking for a B-wave bounce. Many members not only trimmed huge profits at the end of May and into early June, but some even entered some speculative short positions based on our charts that did fantastic on that first sharp drop.
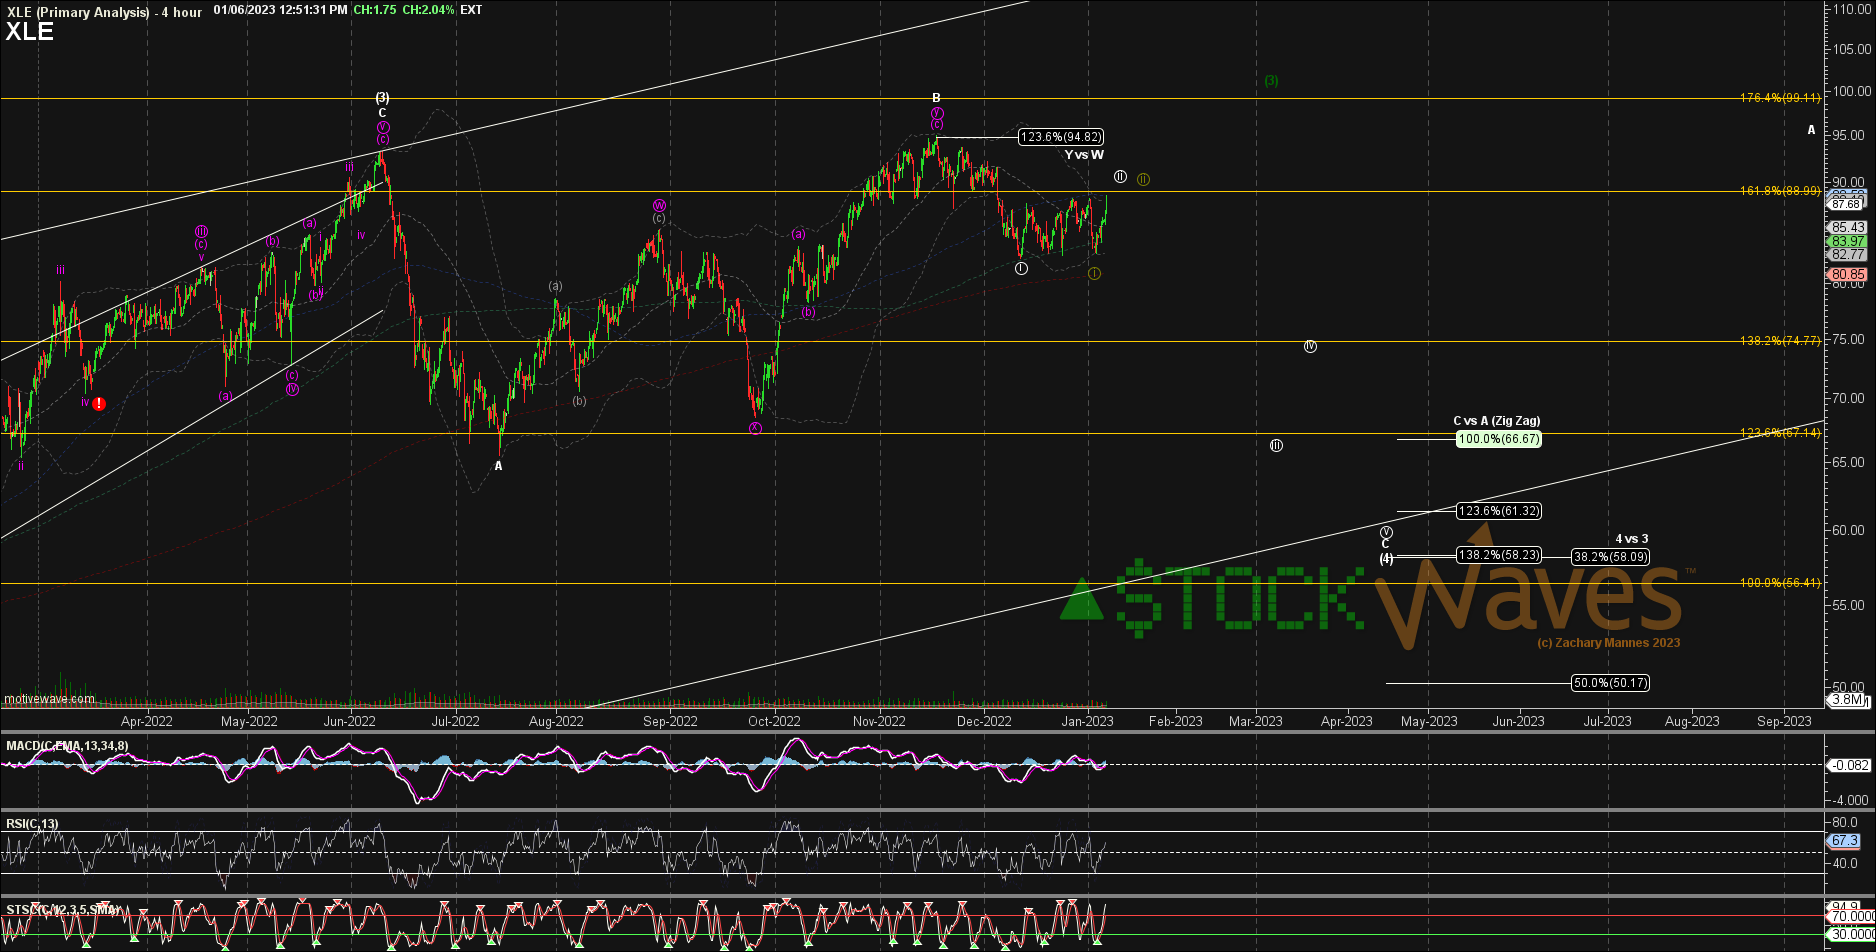
Stock Waves, though, only posted its first short Wave Setup attempt on August 19 when we showed setups for CDEV and VLO to attempt the start of C of (4) down. Both dropped by around 20%, and we counted that as "i of C" at the time and showed where a "ii" was likely to bounce. In early October that ii was starting to get higher than ideal and at that time we started showing possible extension targets for higher “alt” B-waves. Some things did make nominal higher highs, but many did not and have turned down again from mid Nov so far.
Stock Waves currently has 3 active short Wave Setups from Dec 20-28 for energy names that look the most convincing as the start of wave C of (4). But with several looking very much like possible i-ii starts to that C wave down now, we might add a couple more.