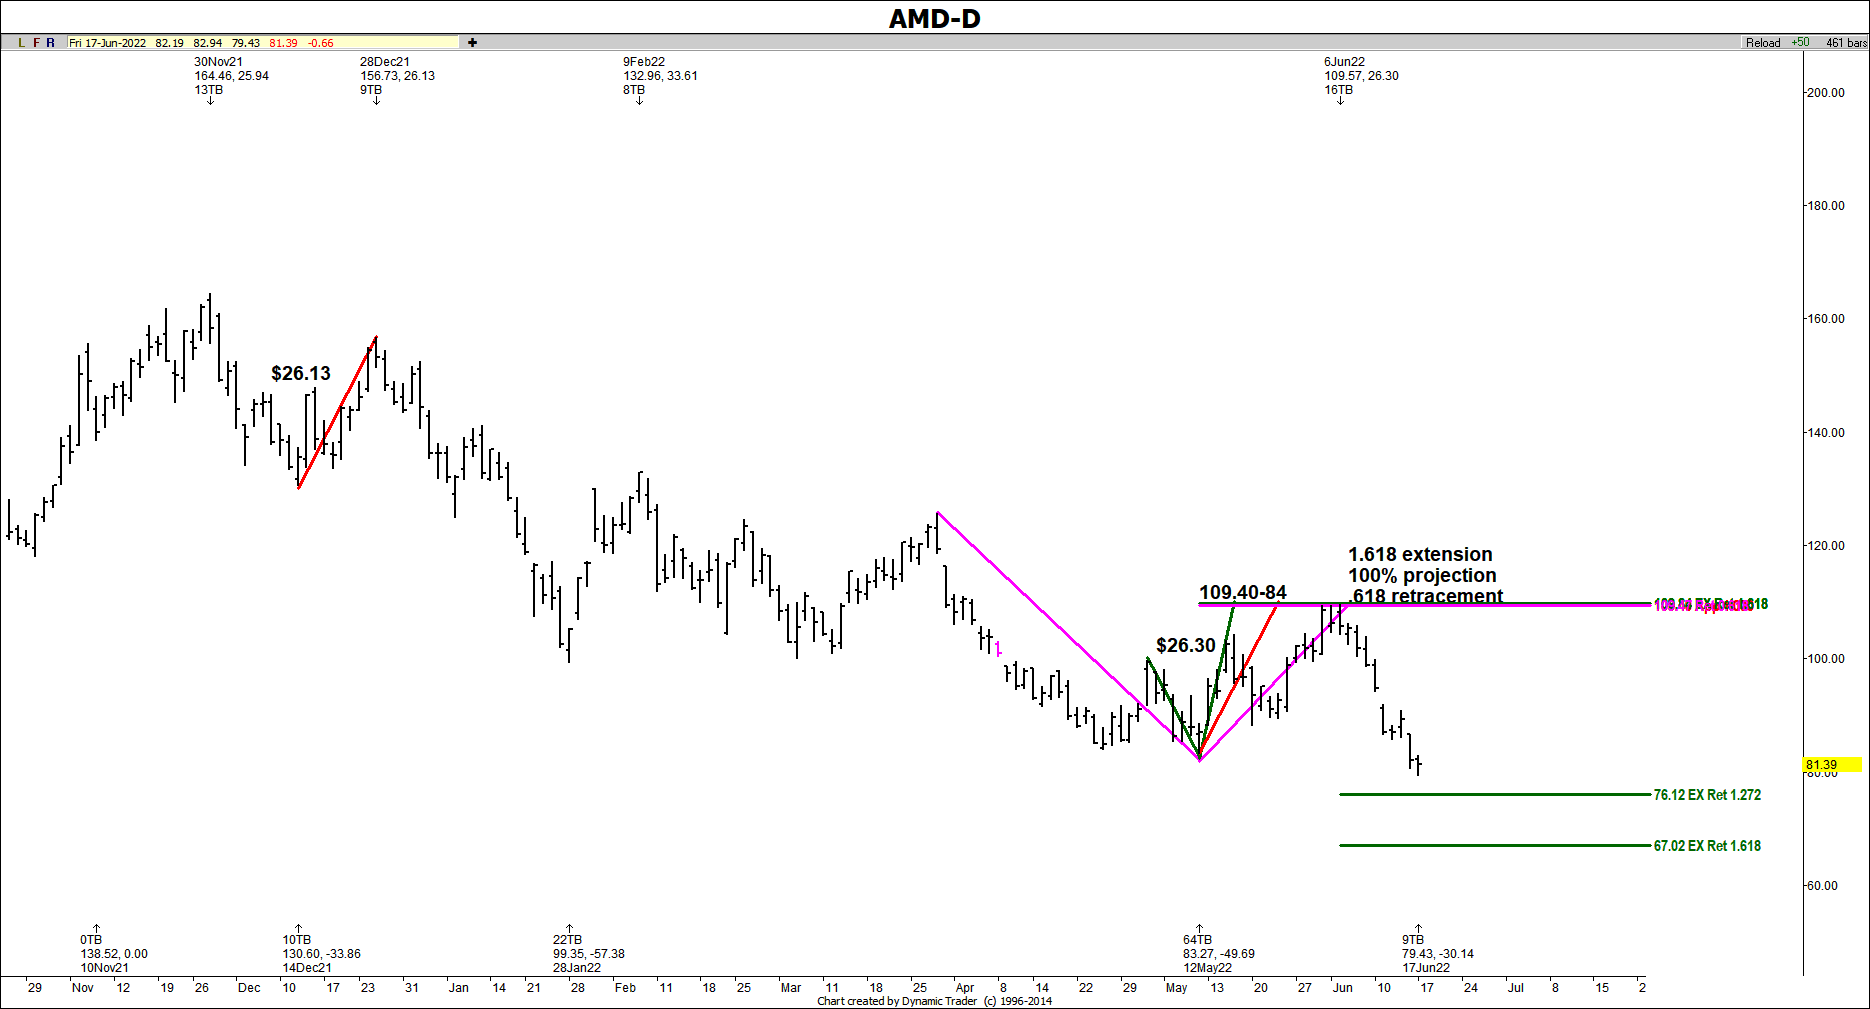
Identifying A High-Probability Fibonacci Price Cluster In AMD
This is an example of a Fibonacci price cluster in AMD. We had the combination of a 618 retracement of a prior swing, a 100% projection of a prior rally, along with a 1.618 extension of a prior high to low swing. This gave us a price cluster at the 109.40-84 area.
The zone was tested and held, followed by sell triggers. So far the decline has been $30.14. My targets are a little lower from here...but since we don't always meet the key targets, it's a good time to ratchet down stops on shorts.
This is one of the examples I'll be going over in my webinar on 6/23 at 3PM Pacific.


