Getting The Jump On Gold's Rally
We have setups in the market not only on the daily charts, but also the intraday charts. An example this week was in the gold market. I liked gold due to the fact that all the moving averages on the daily chart were bullish with price above the 200 and 50 simple moving averages. And the 5 ema was above the 13 ema, which is also considered bullish.
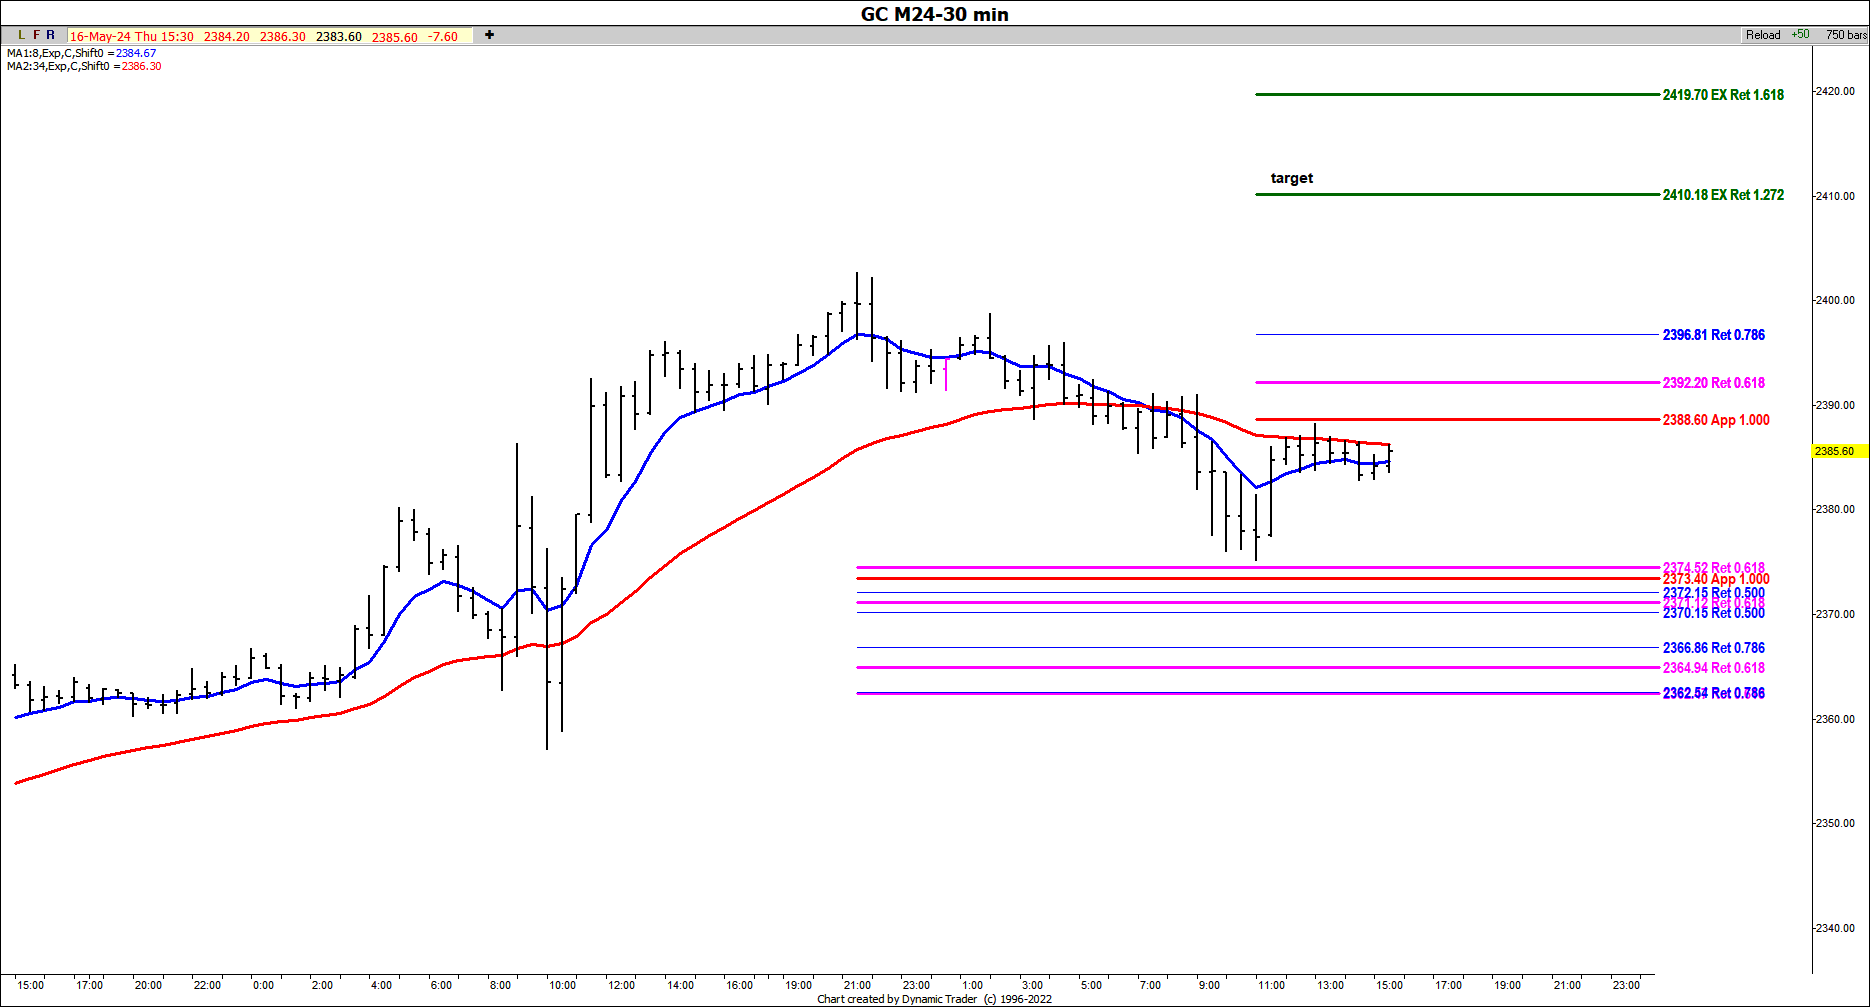
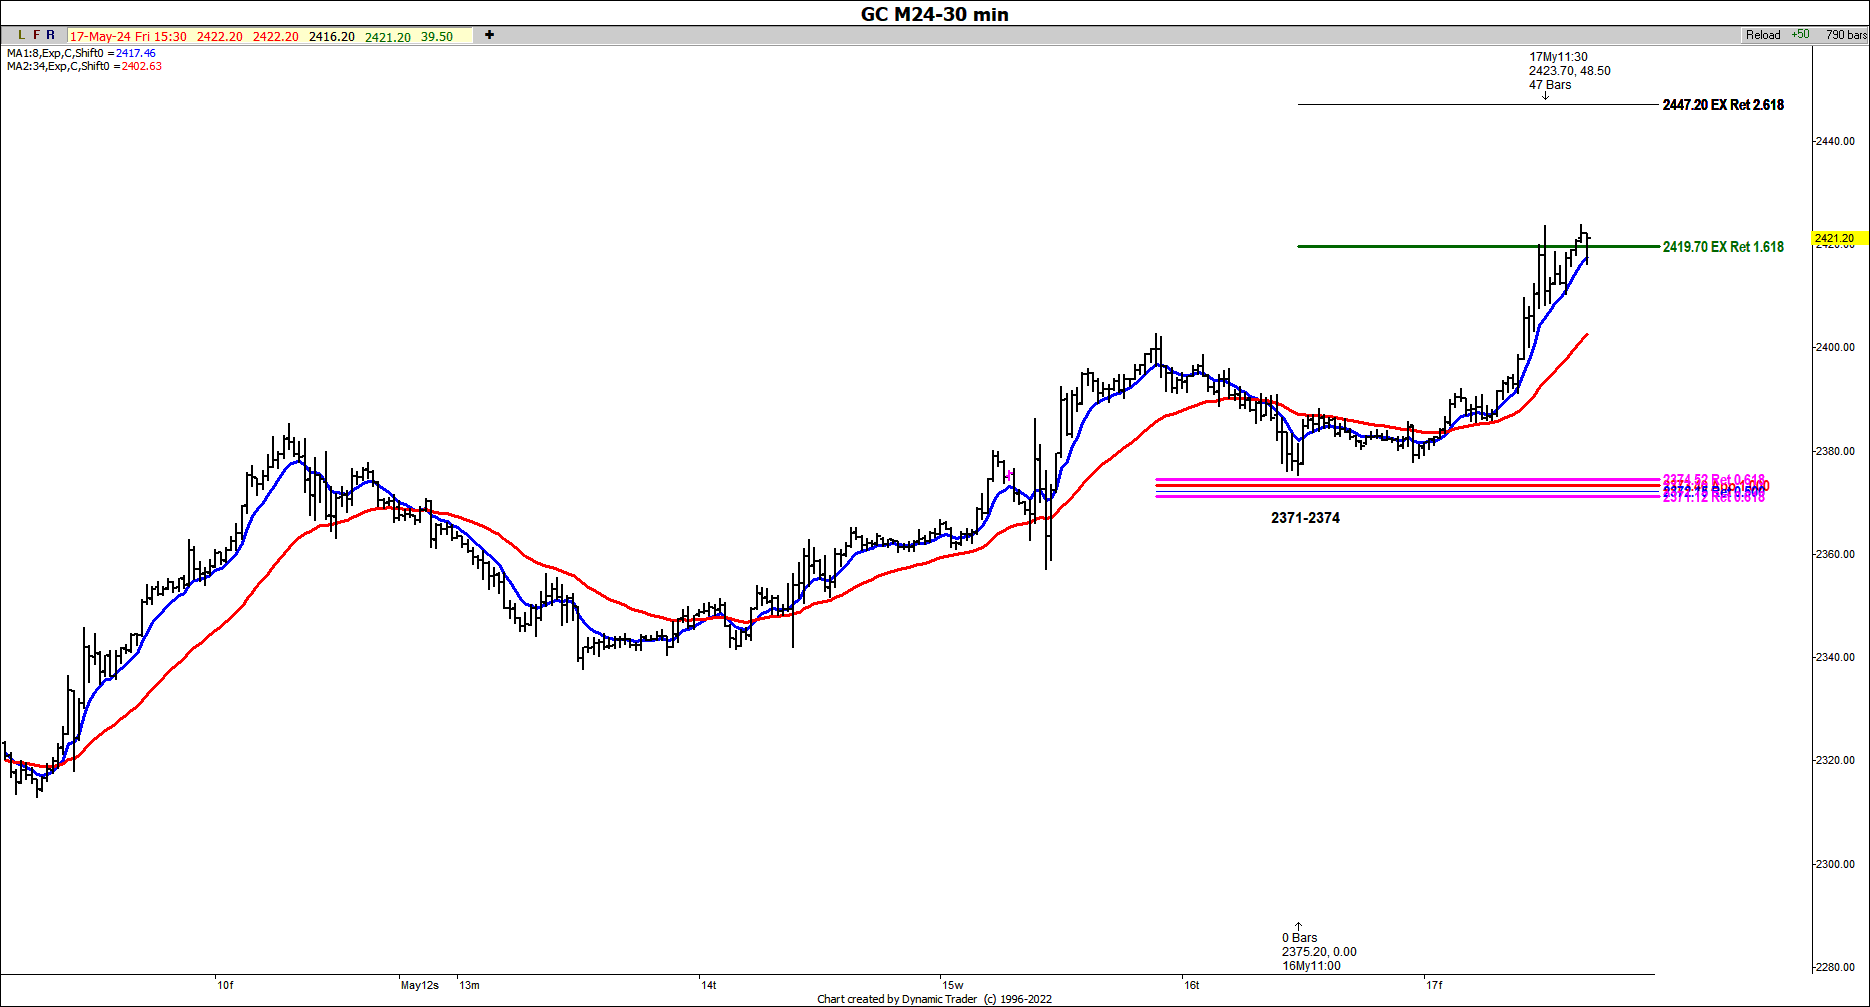
We had a nice setup on the 30-minute chart on Thursday with another Fibonacci price cluster, which is the coincidence of at least three key Fibonacci price relationships that come together within a relatively tight range. The cluster came in at 2371-2374 area. We tested this zone pretty closely with the recent low made just above the zone (2371.10-2374.50). The actual low was made at 2375.20 which is considered to be close enough to take a trade against. A healthy rally of $48.50 was seen from this price cluster, where the max risk was below the same key zone.
Here's what we saw on the GC chart on Thursday:
And here's where it climbed to on Friday:


