Getting The Jump On AAPL's Short-Covering Rally
 By
By
Sometimes you need to look at the bigger picture to find a setup in the markets. This was the case in AAPL recently.
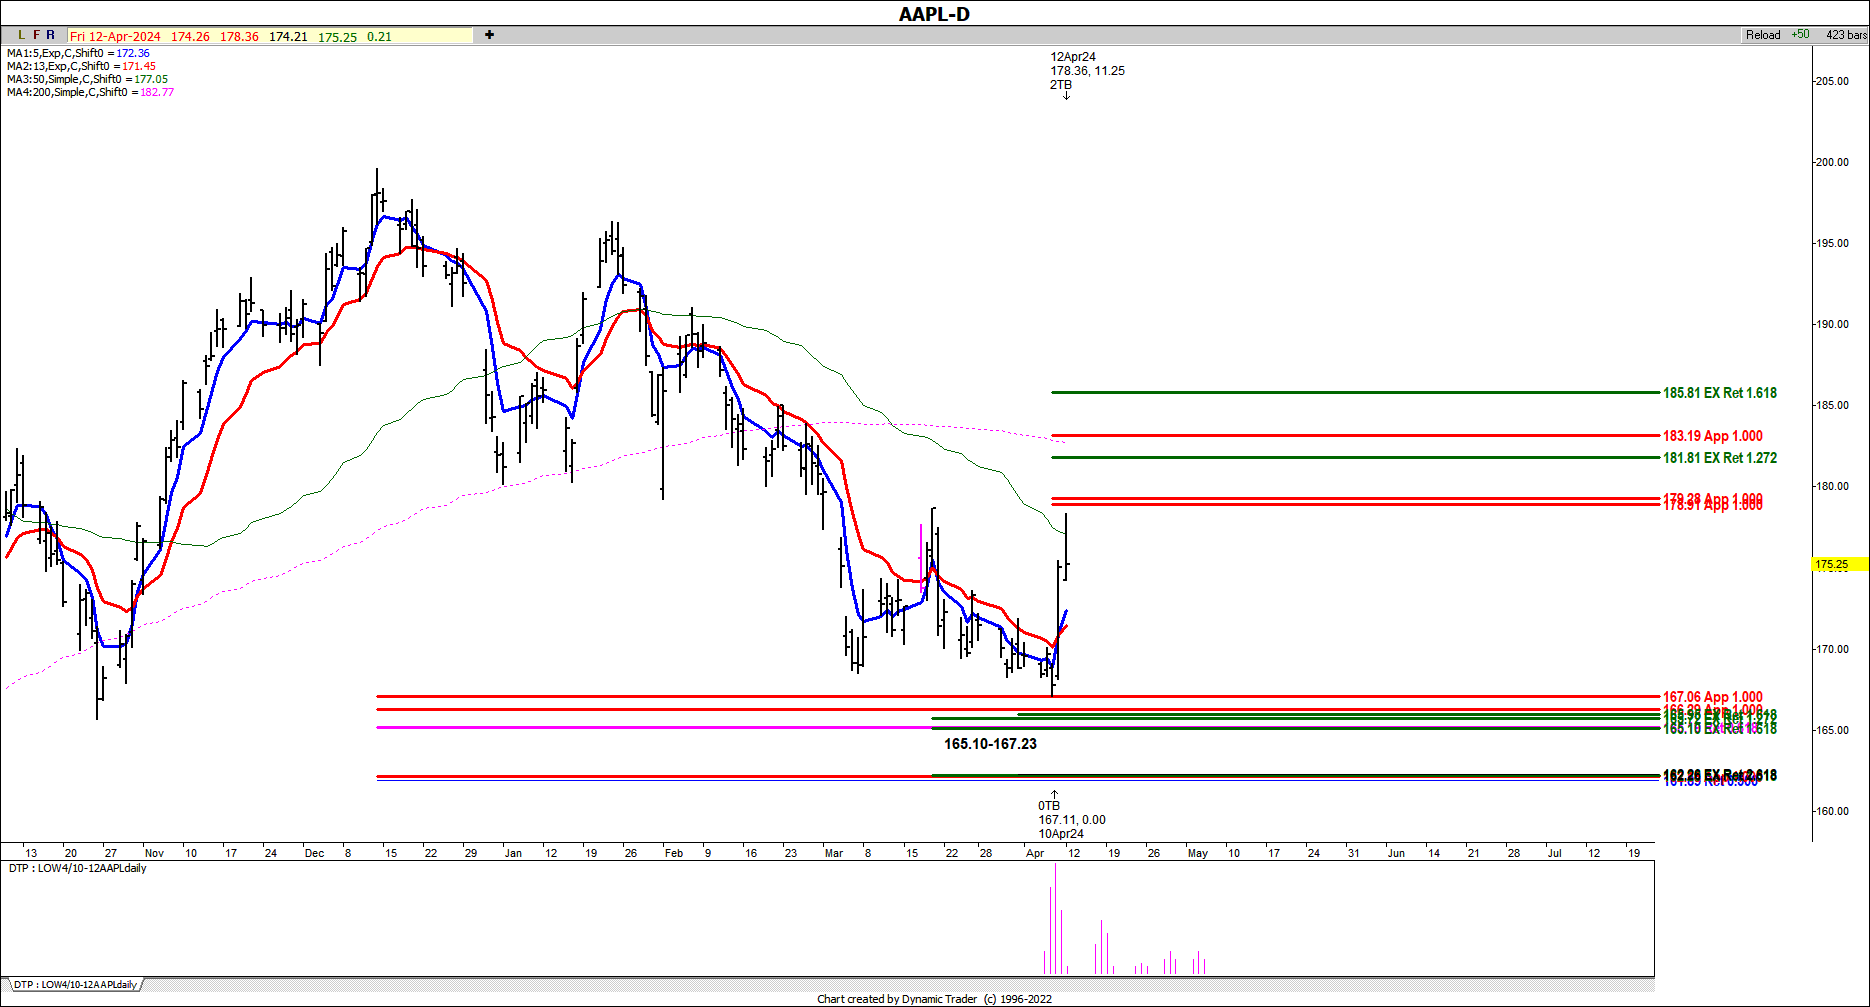
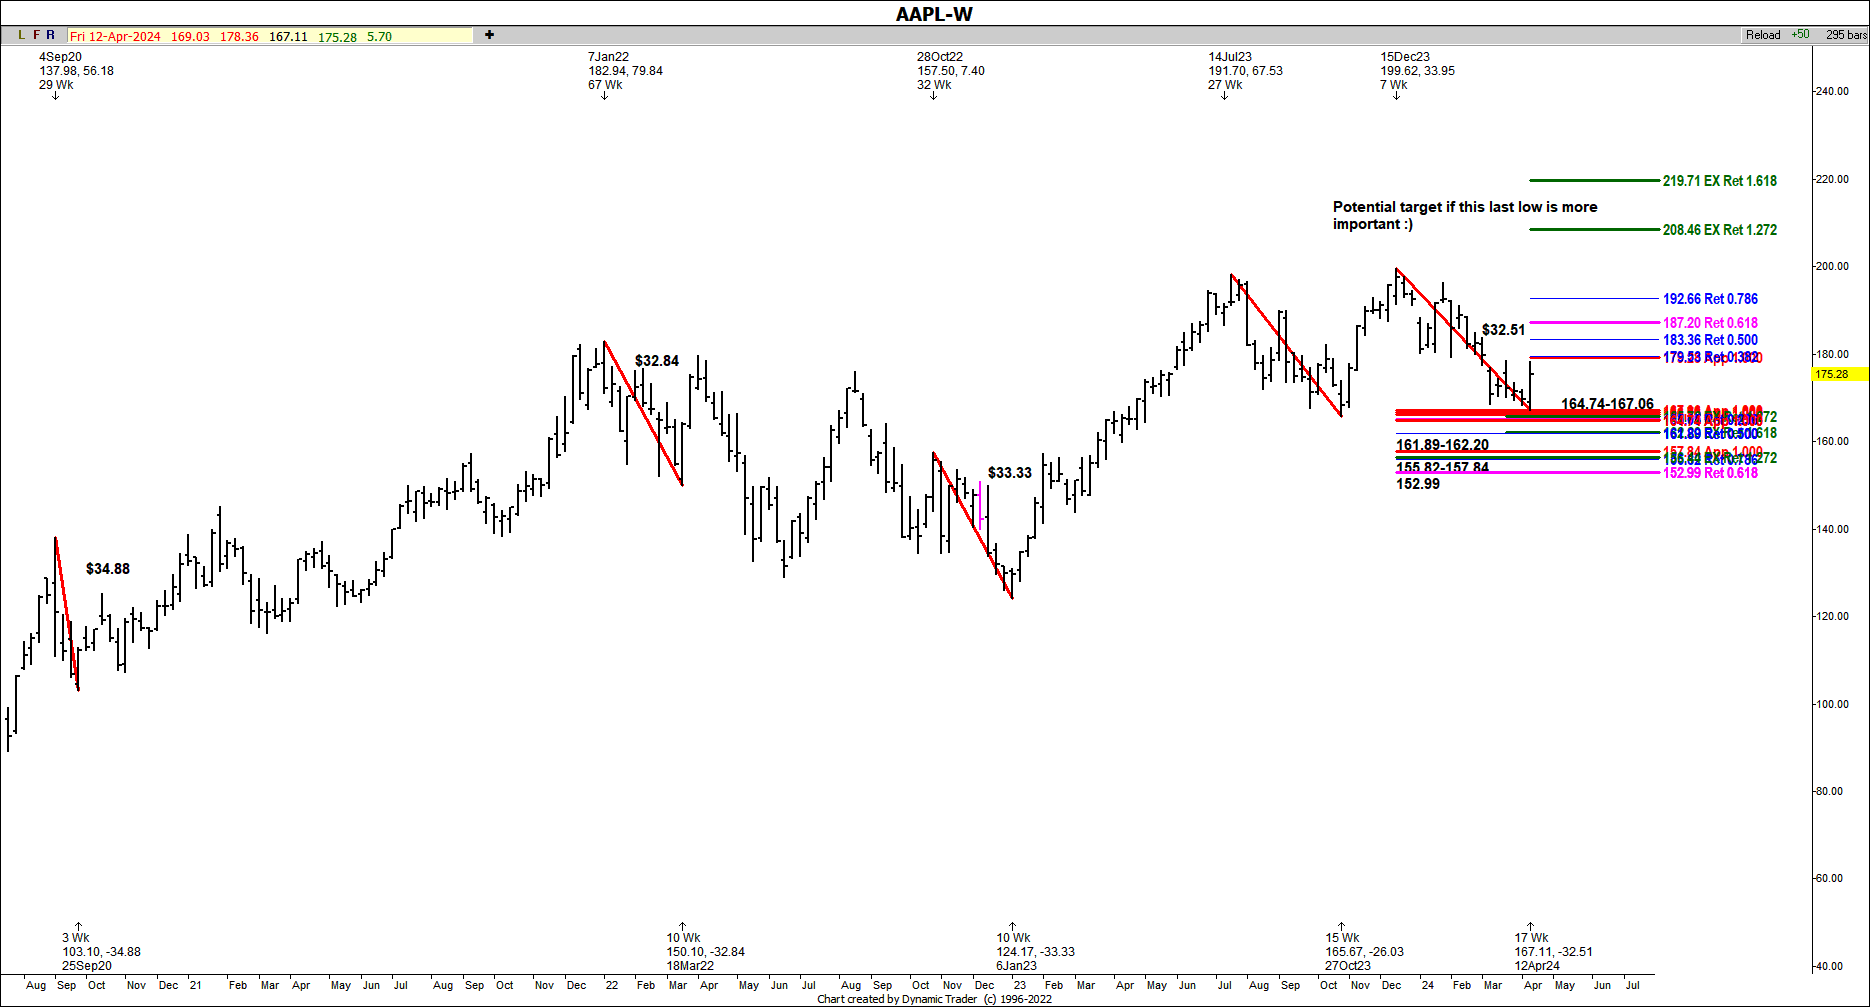
When I looked at the weekly swings on that chart, I noticed that many of the swings were similar to the others. I measured these prior swings and also ran some other key Fibonacci price relationships. I found a rather healthy Fibonacci price support cluster at the 164.74-167.06. area.
Our charts also showed timing for this low coming on April 10. Bottom line we saw time and price coming together for a possible low in AAPL and all we needed to do was wait for the trade triggers.
The triggers came on April 11 on both the 15- and 30-minute charts, as a rather strong short covering rally began. We've seen a quick rally of $11.25 so far. Now since the daily chart of AAPL is still having some technical challenges I've suggested using at least a breakeven or better stop for those who took an entry. Even though the potential weekly upside target is up at the 208.46 area, there are quite a few hurdles AAPL will need to clear if this is the case and it is a bit of an uphill battle! There is some healthy upside potential, however, if we can continue to hold above the recent low.