Fibonacci Trade Signal In DIA
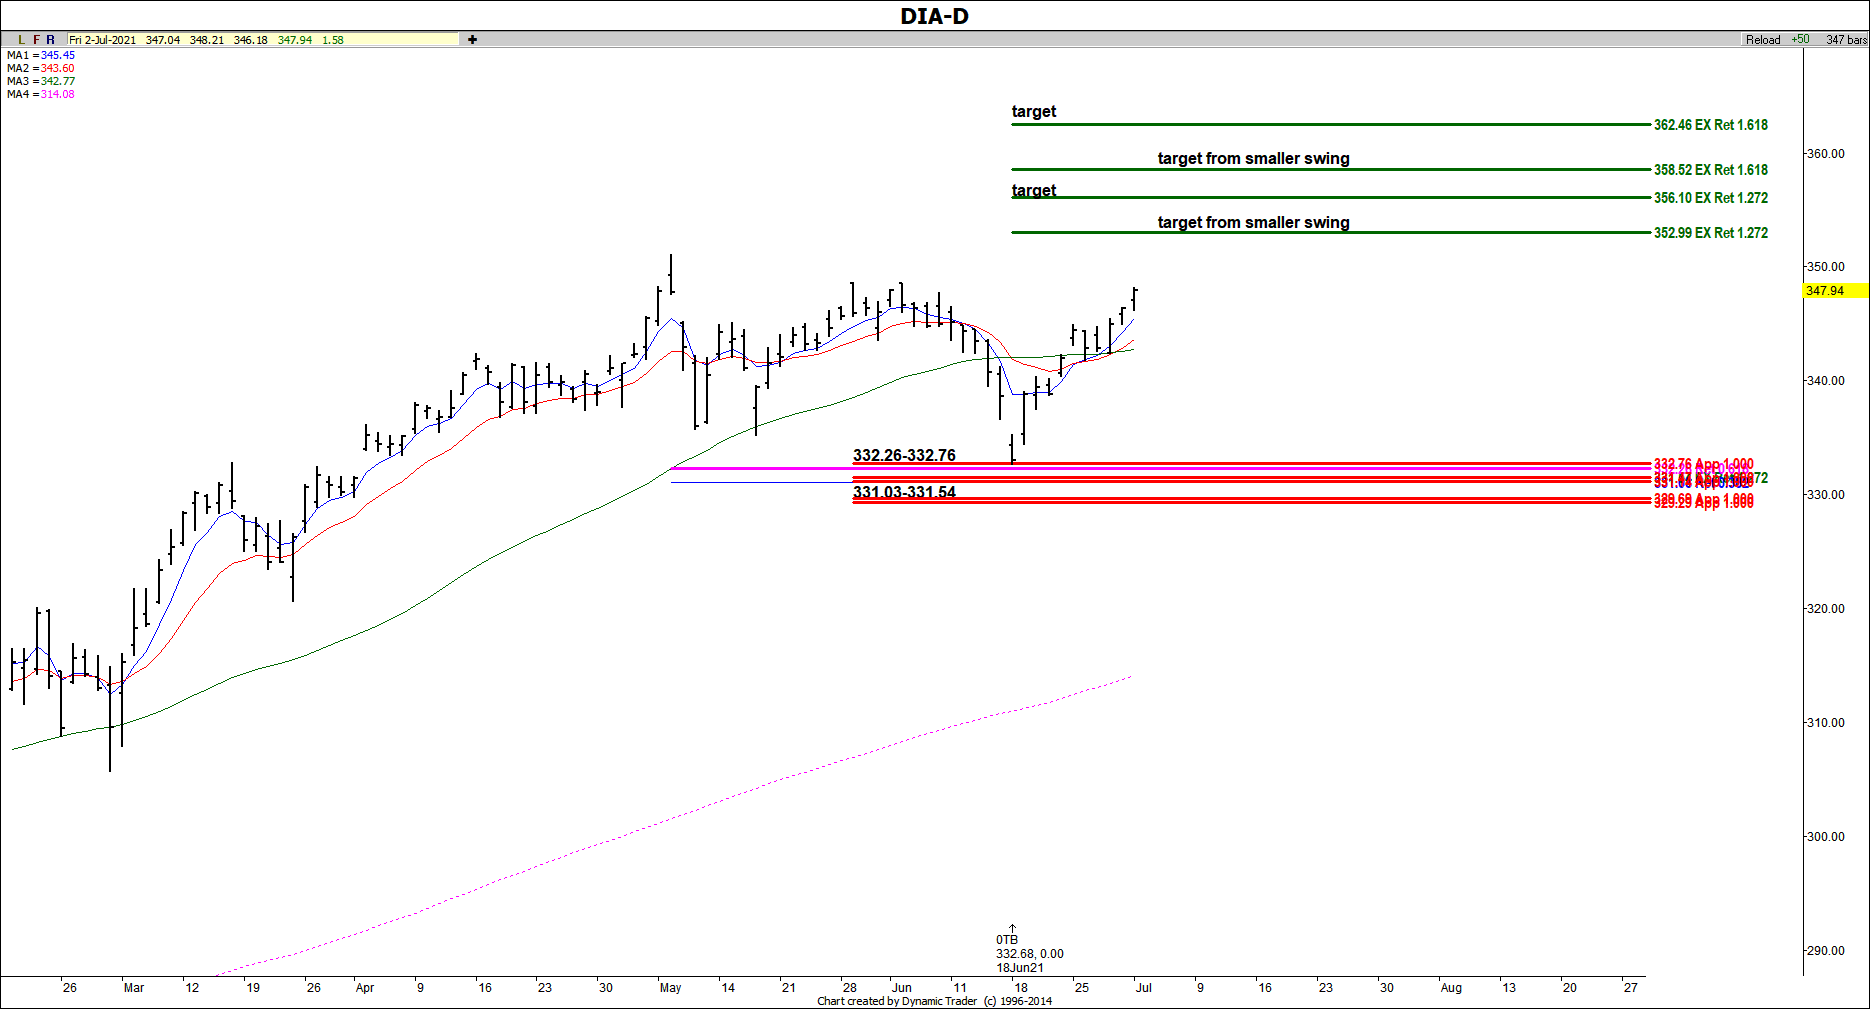
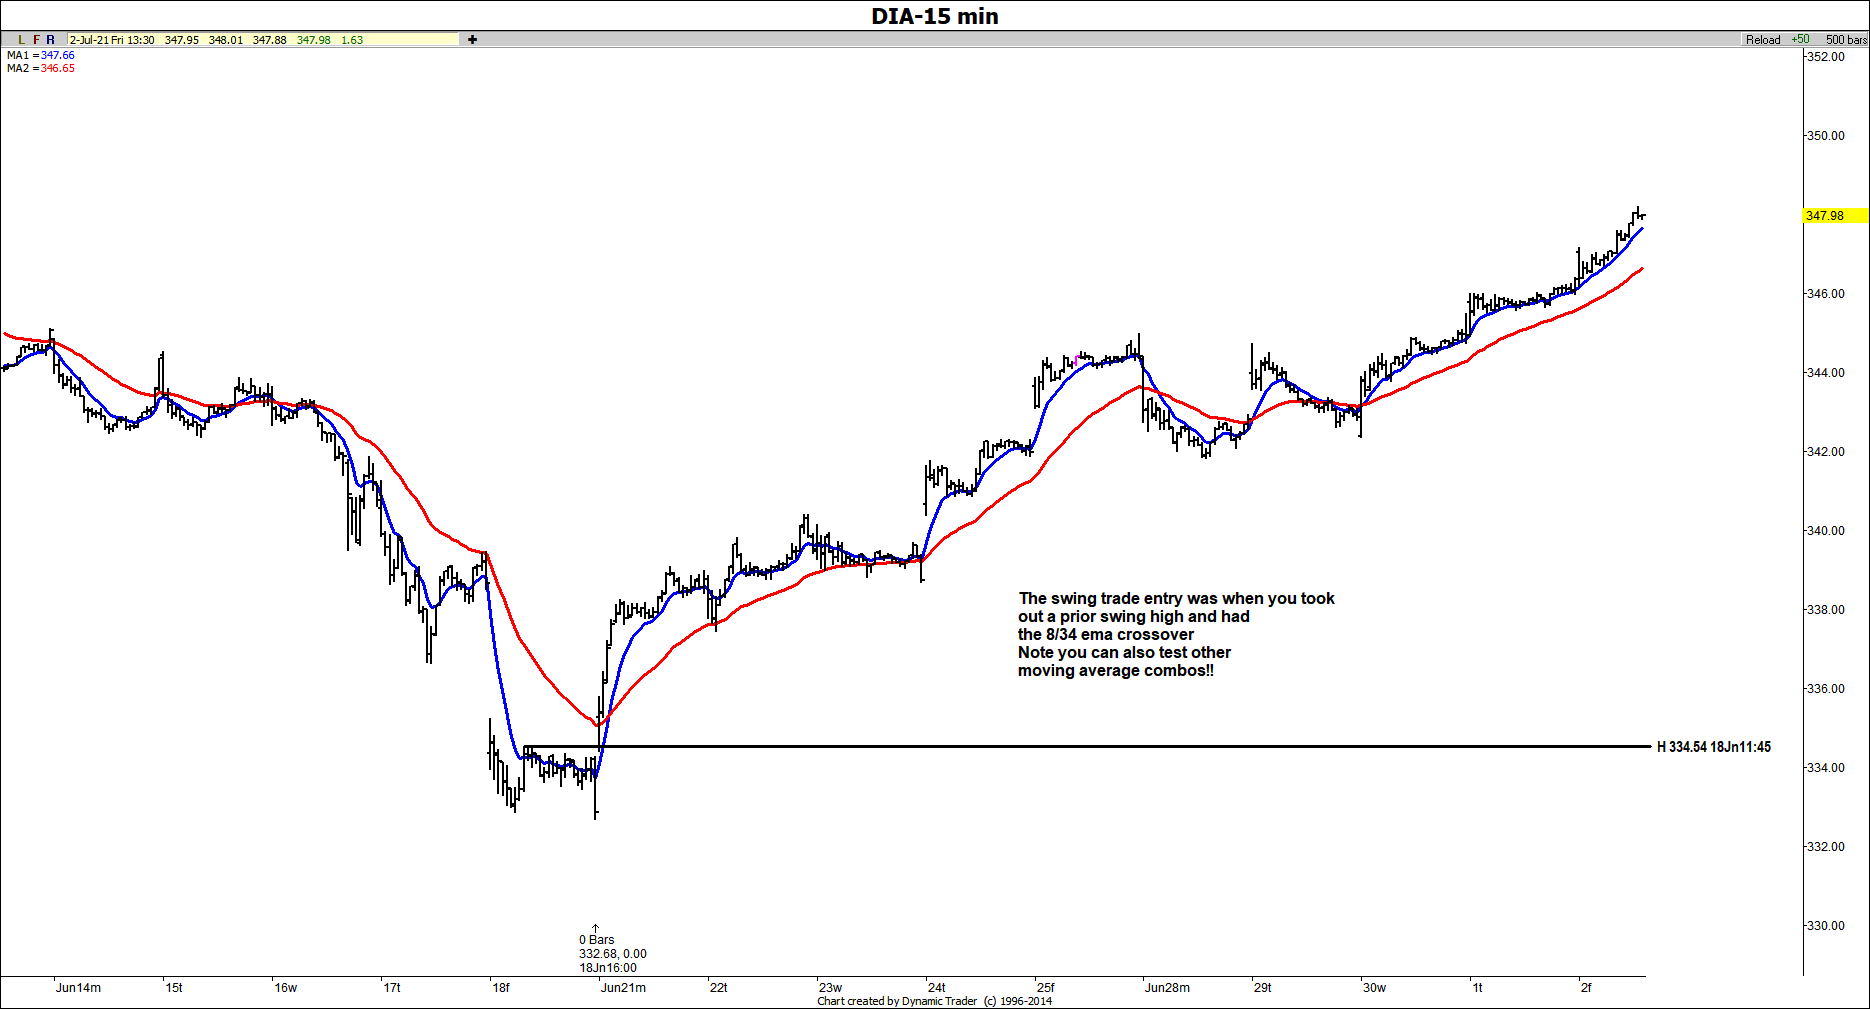
Here's a recent trade setup we got in the DIA. The setup included a symmetry projection of a prior decline along with a .618 retracement of a prior swing. The top end of the key support decision came in at the 332.26-332.76 area, which held on June 18. The swing trade trigger came on June 21 with the 8/34 ema crossover to the upside, where DIA also took out a prior swing high (see on the 15-min chart below).
So far we've seen a rally of $15.53 from that last low. We still have higher targets if the market wants to give them to us at 352 and higher. I will always suggest that a trader trails up stops as we go as we don't ALWAYS make the targets and we need to protect profits.


