Fibonacci Set-Up in TDOC
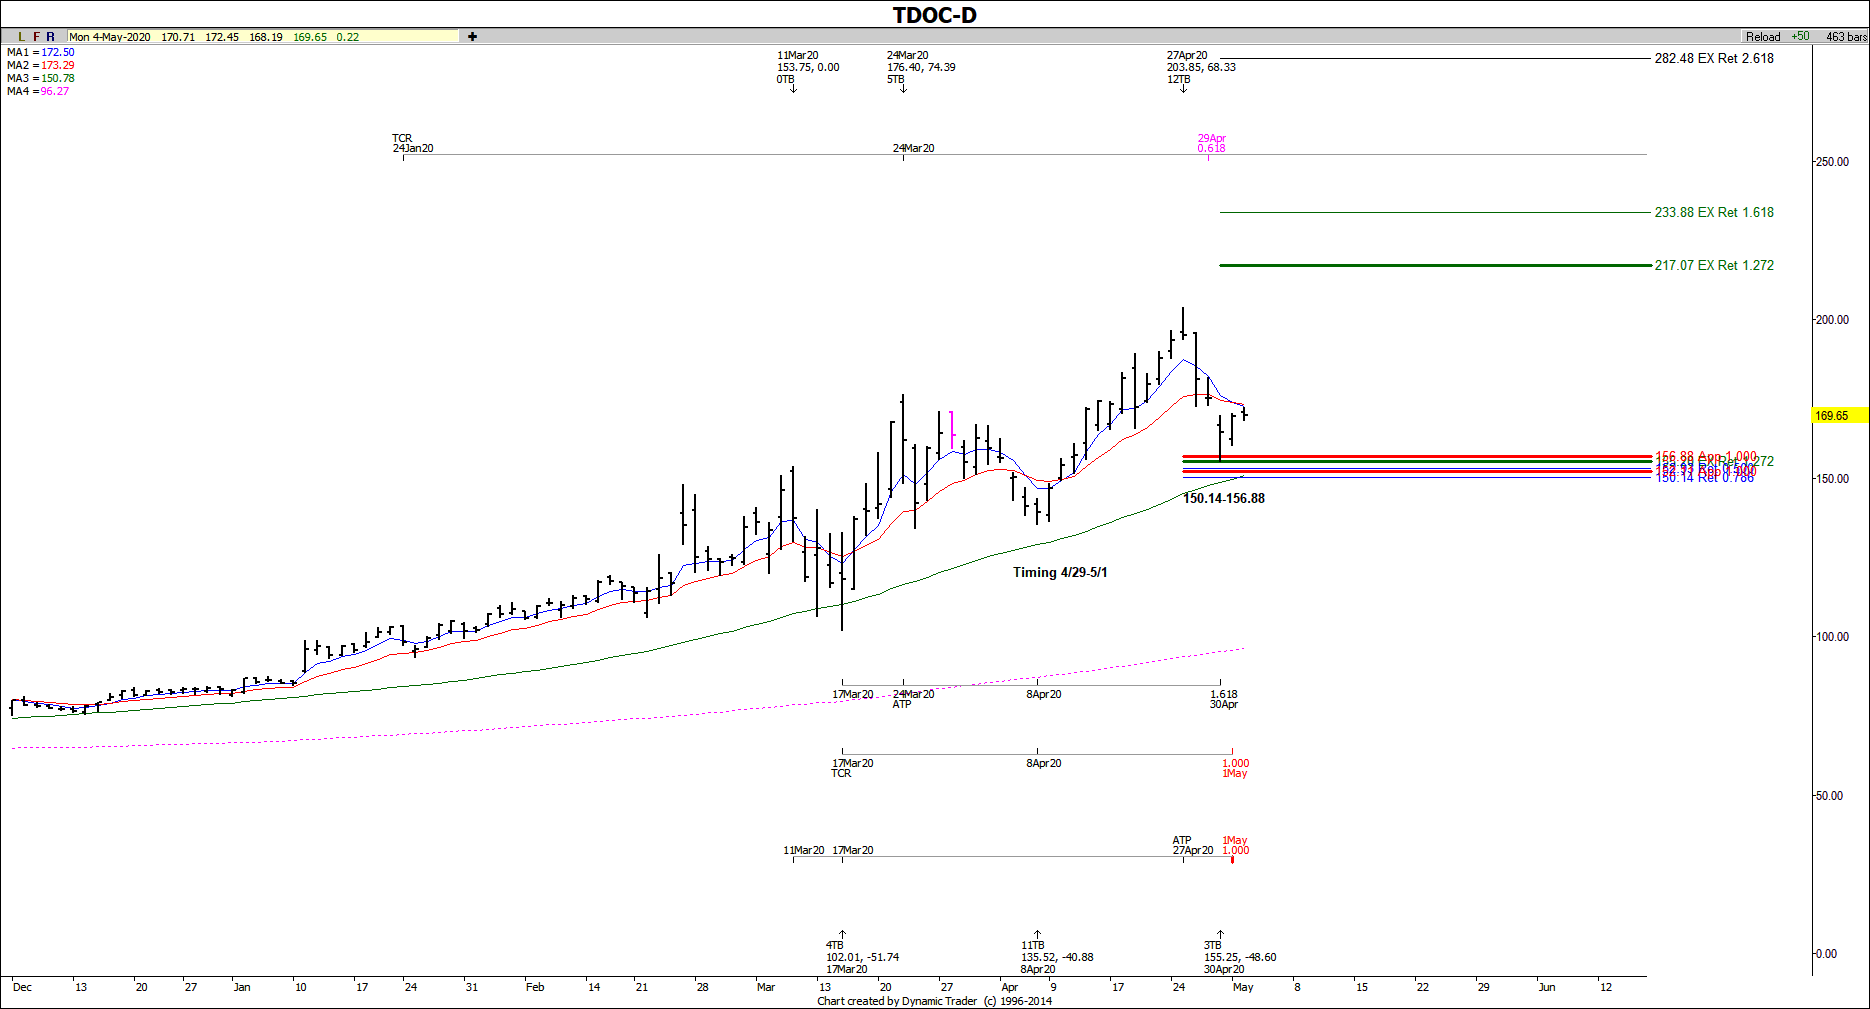
I have a long setup in Teladoc Health, Inc. (TDOC). There is the coincidence of at least 5 Fibonacci price relationships between the 150.14-156.88. This zone includes a couple of symmetrical projections which often act as support to a move.
Besides the price support that is currently holding, we also have some timing factors for a possible low between the 4/29 and 5/1 time period. Note the recent low was made on 4/30, which is directly within this time window. As long as price holds above the key support on the chart, I'm taking buy signals with the max risk below the price cluster of support.
The potential upside target IF this support holds comes in at the 1.272 extension at the 217 area. I will consider myself wrong on the setup if the support is violated.


