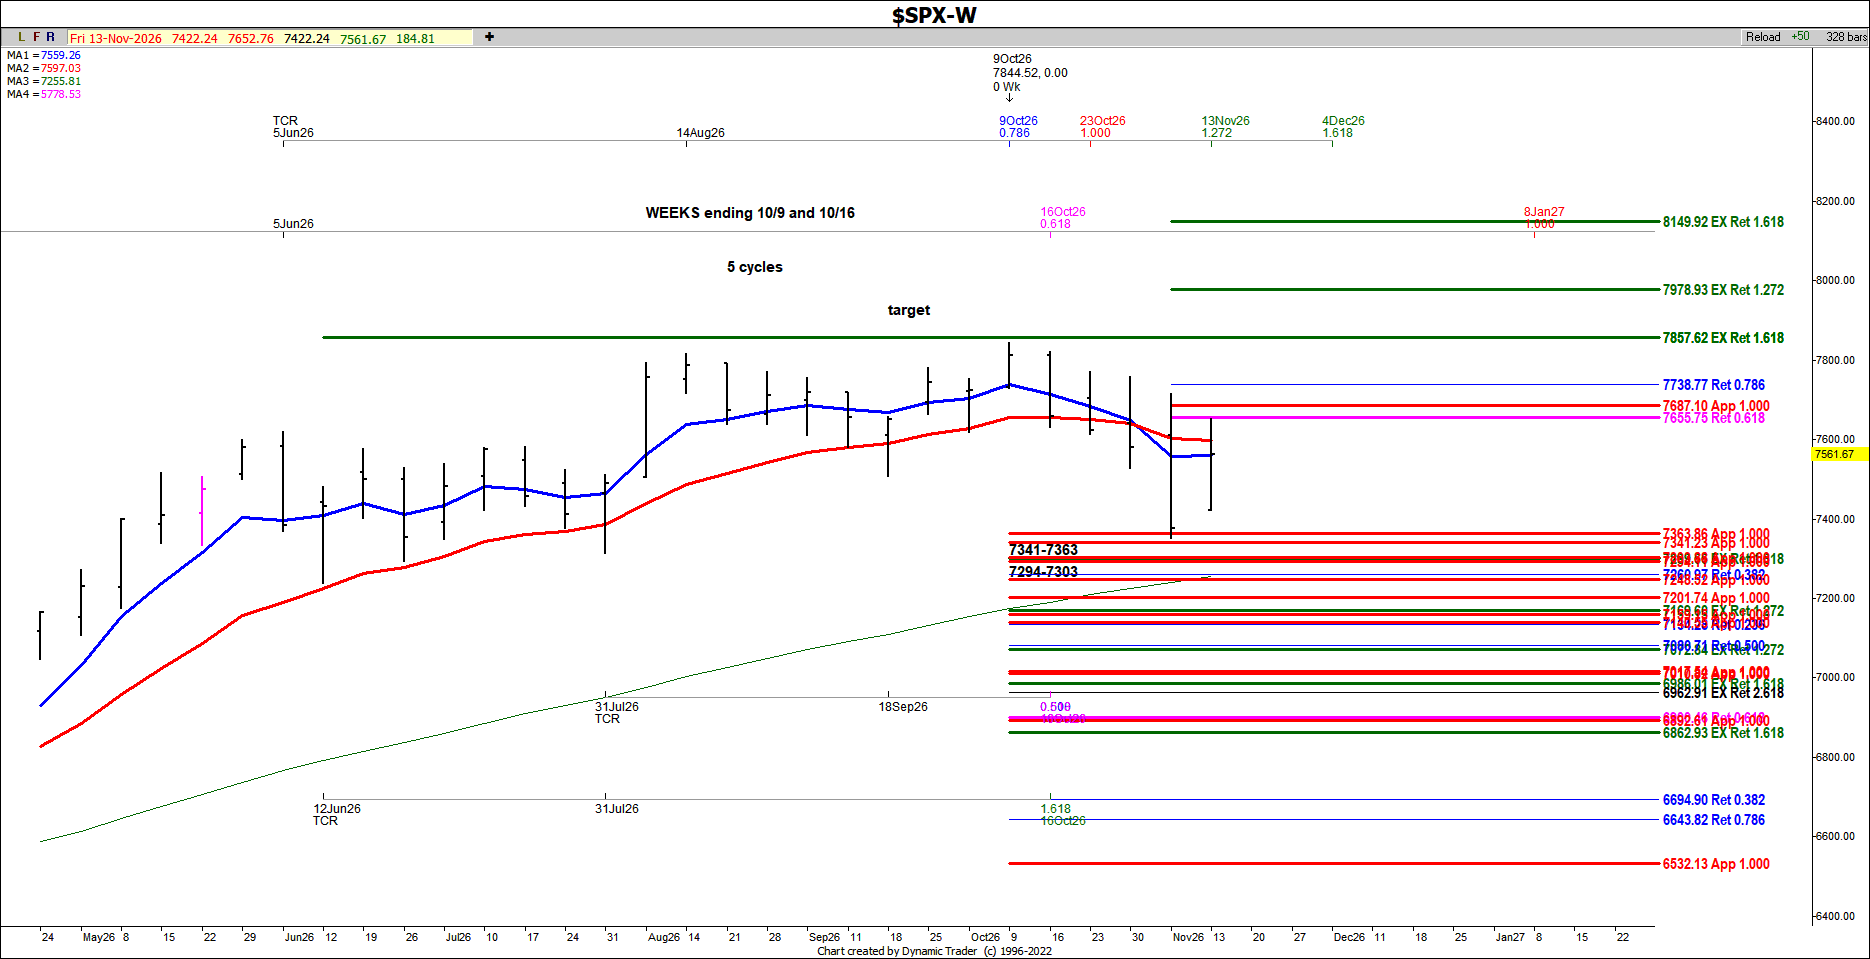
Fibonacci Projections for SPX
 By
Recently, we had reason to watch for a possible bounce in the SPX after some pretty negative price action the week before. We had key symmetry price support in the 7341-7363 area, and the actual low was made directly in the zone at 7350 on November 5. What followed was a healthy rally of 302.41 so far from that support.
On our daily chart we also had some timing for a possible bounce at the actual low.
Note, however, that we are currently at some very important resistance on the way up on this weekly chart. So far we have seen some short term sell triggers against this same area. Note that this is what we need to keep an eye on for a possibly more important reversal.
What would open the door to even higher prices? Well, we would need to clear 7655-7687.... and then the .786 retracement at 77.38. If so, then it opens the door to potential new highs (7978 target) instead of a failure.