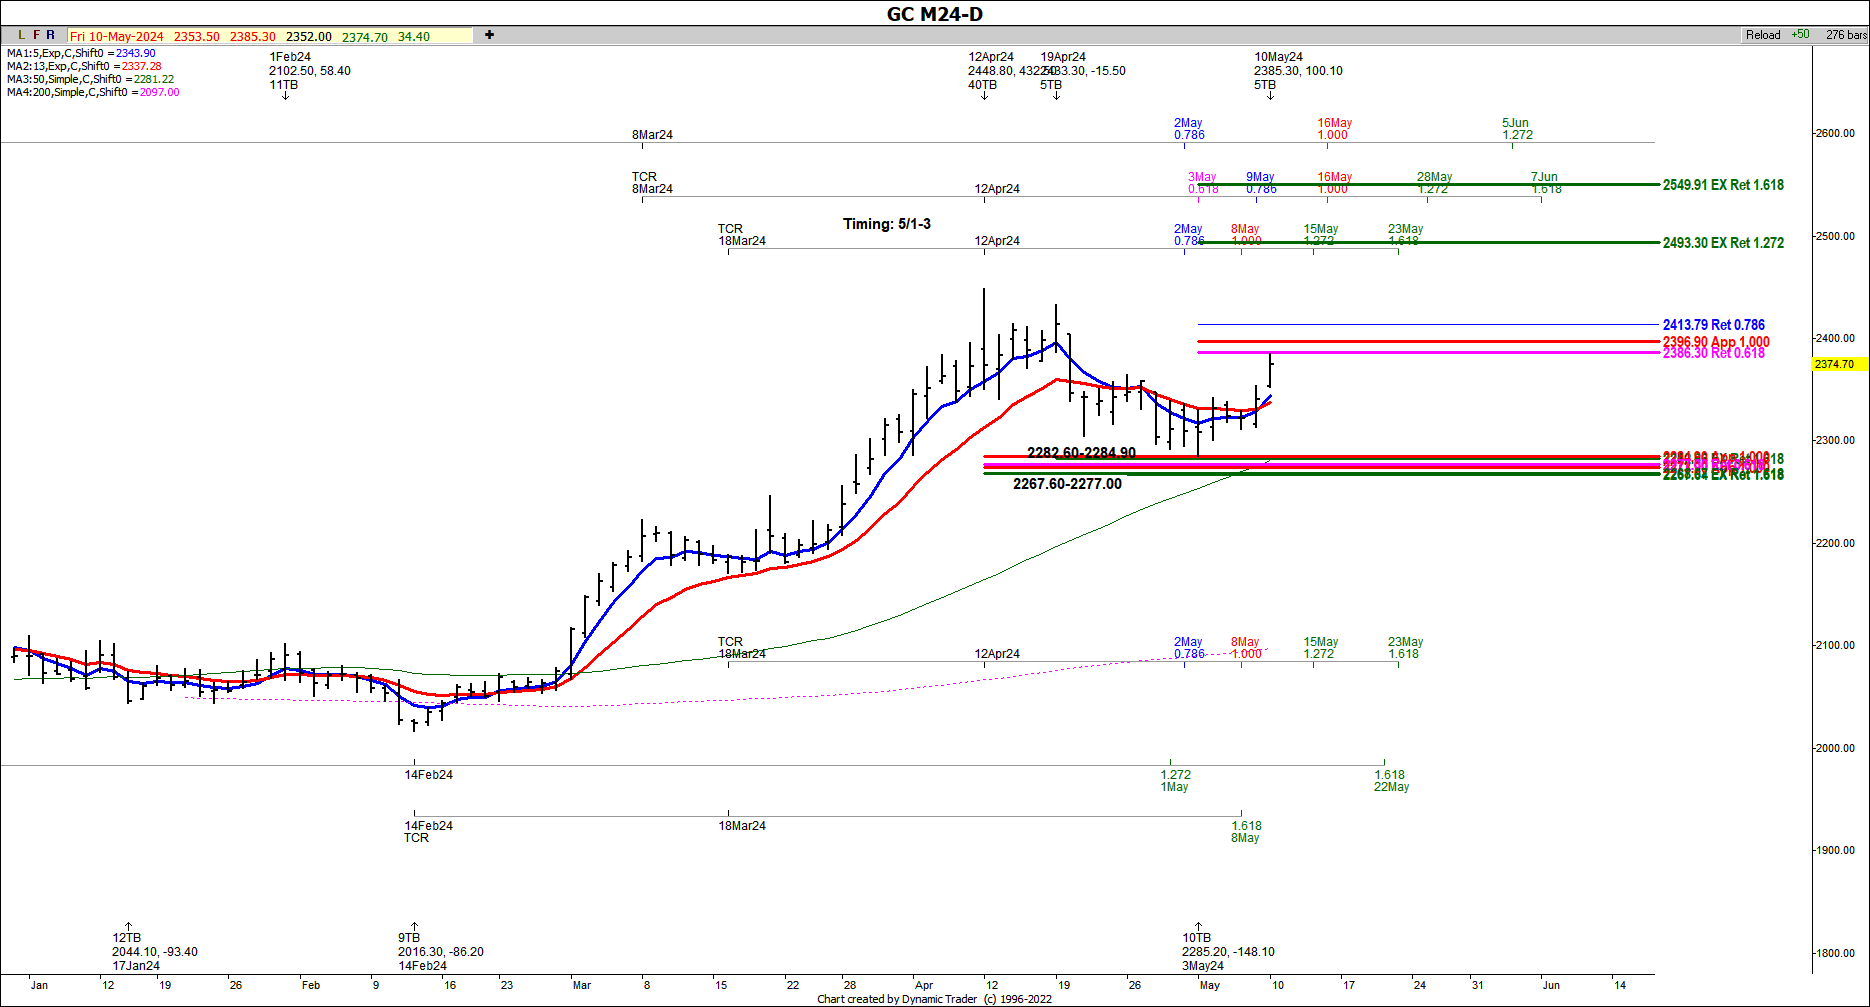
Fibonacci Analysis Anticipates Rally In Gold
Time and Price has kicked in recently in the gold market. Note the first Fibonacci price cluster on the daily chart below that had key support at the 2282-2284 area. At the time this level was tested, GC also had a confluence of timing factors, which came due between 5/1 and 5/3. The actual low was made on 5/3 directly within the time window at the 2285.20 level -- and within 30 cents of the high end of support at 2284.90.
The price support zone held nicely and so far has been followed with a $100 rally from that low. We are now currently stalling at a hurdle of 2386-96, but if we clear this area, our first bigger picture target comes in at the 2493.30 area. So far so good. Anyone who took this trade should be trailing up stops on longs due to the current hurdle!!


