Diary of a Winning Fibonacci Setup: TTD
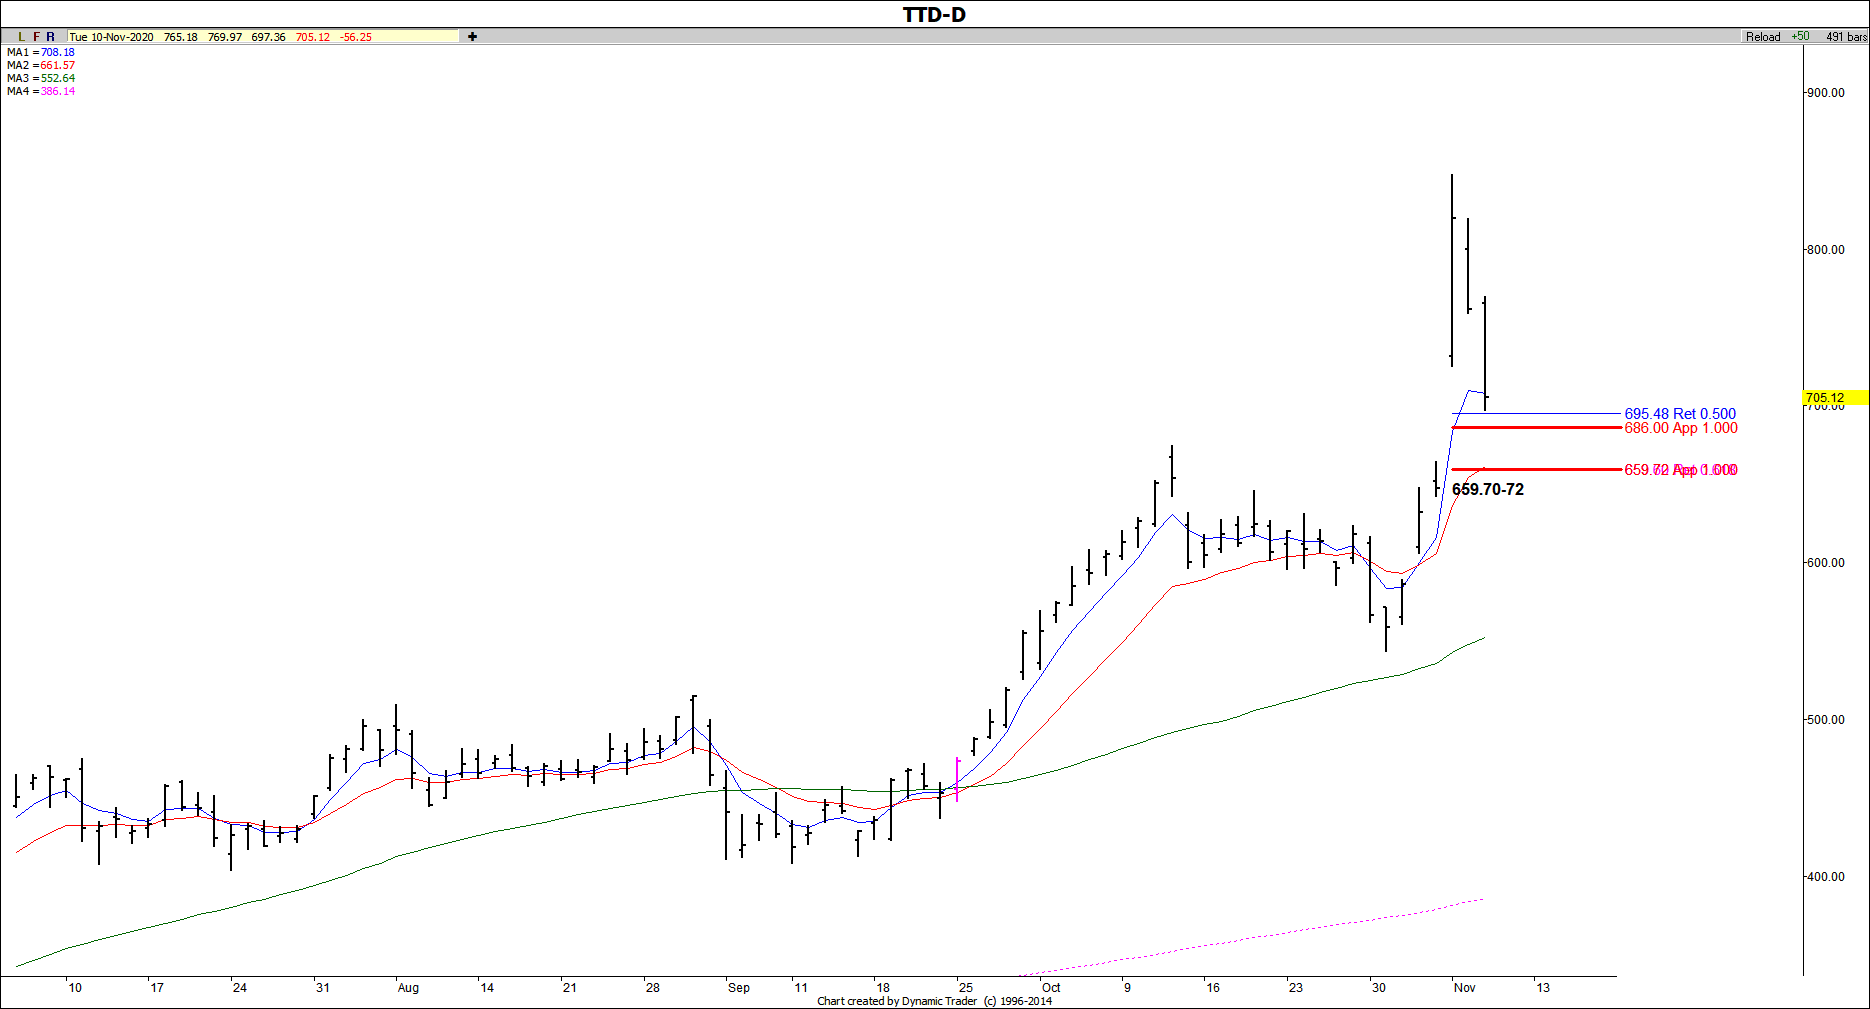
Earlier in November we had a relatively simple setup in TTD in our Fibonacci Markets & Stocks service. The setup was the coincidence of a 50% retracement that overlapped key symmetry support at 686.00-695.48.
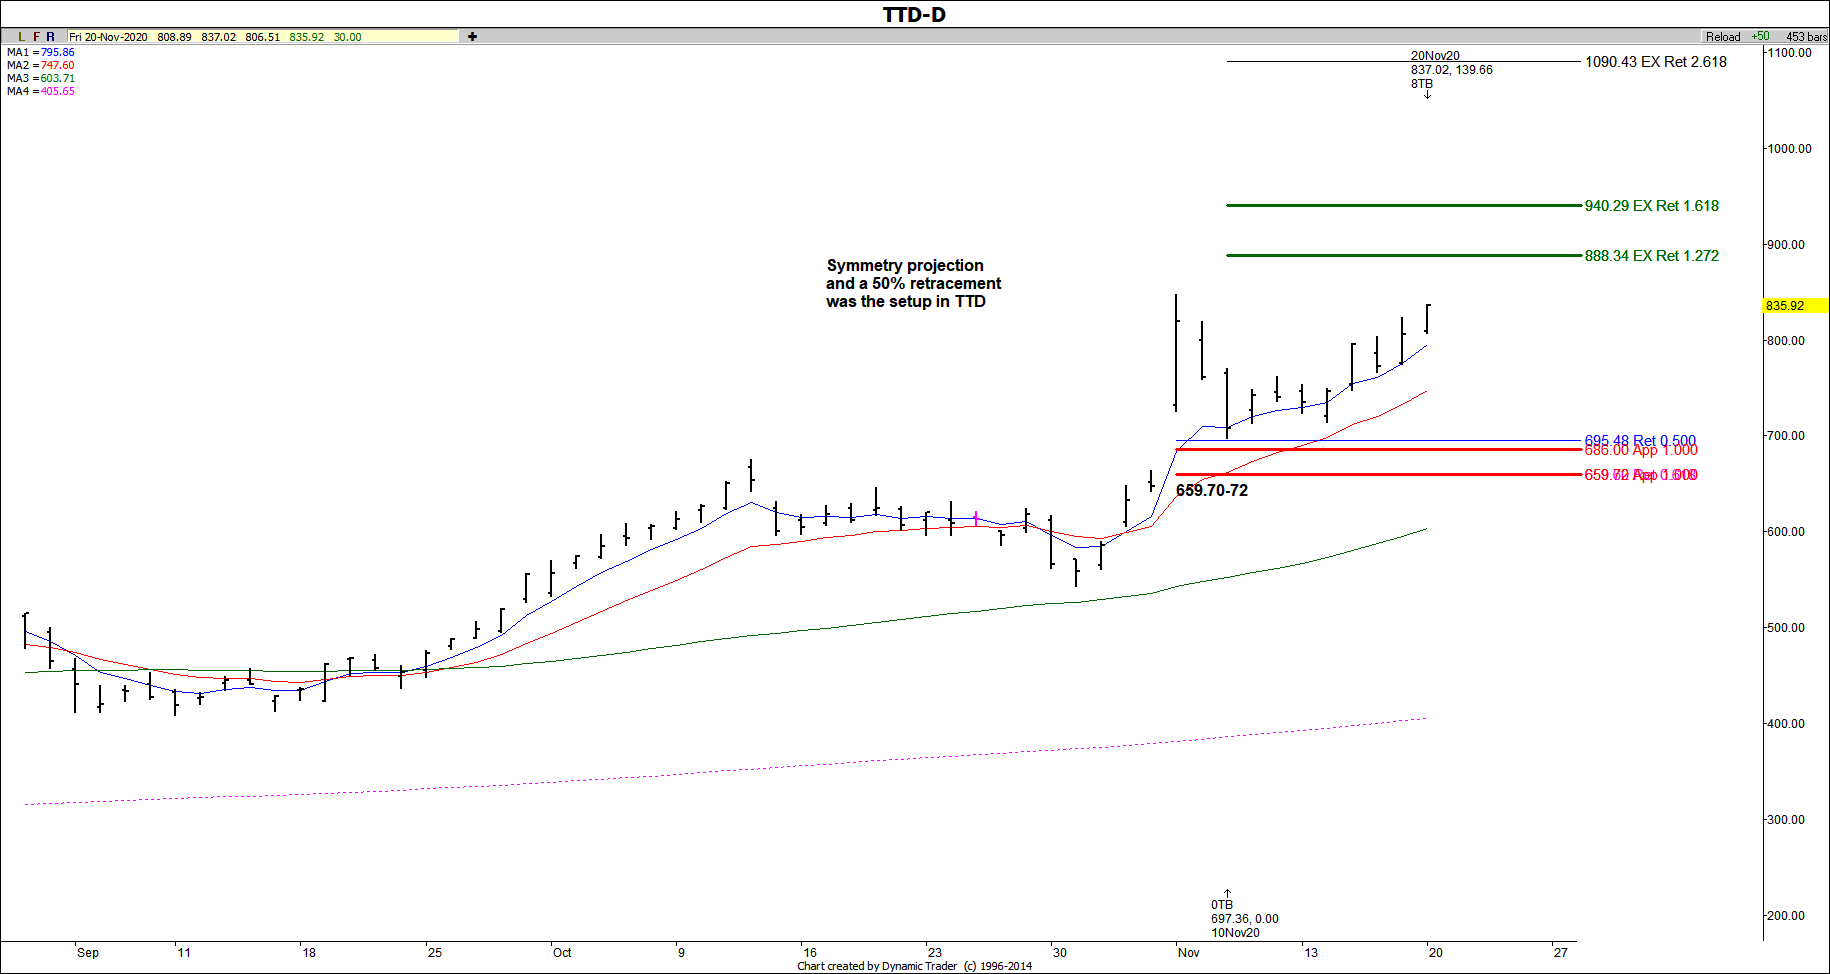
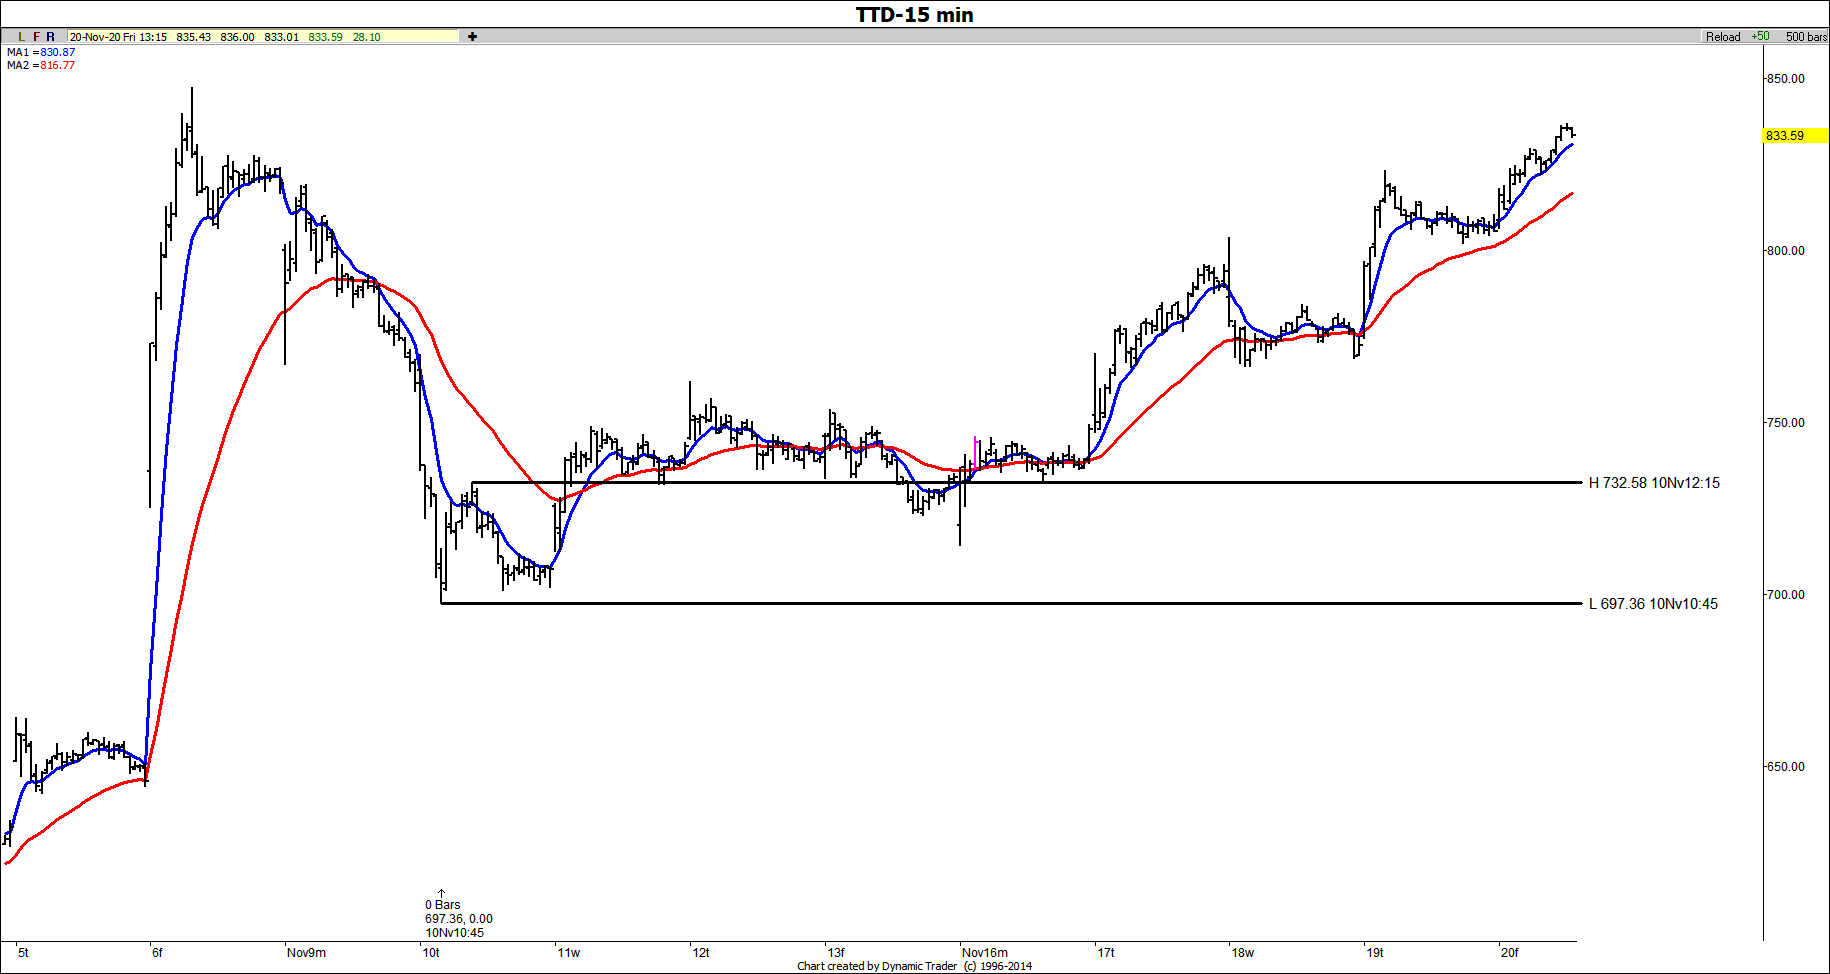
The actual low was made at 697.36, which was close enough to watch for our buy triggers (see the first chart from Nov 10). A buy entry for a swing trade was triggered one day after support was tested on the 15-minute chart once the 732.58 swing high was taken out. From the original support decision, so far we've seen a rally of 139.66. The initial upside target is just a bit above current levels at the 888.34 area, shown on the second chart. This is one where you would want to trail up stops as you go, just in case we don't get to the target.
Remember the way to make $$ with my work is to use the formula: SETUP + trigger = entry then you manage it!


