Coinbase Bulls Due For Relief
 By
Ryan Wilday
By
Ryan Wilday
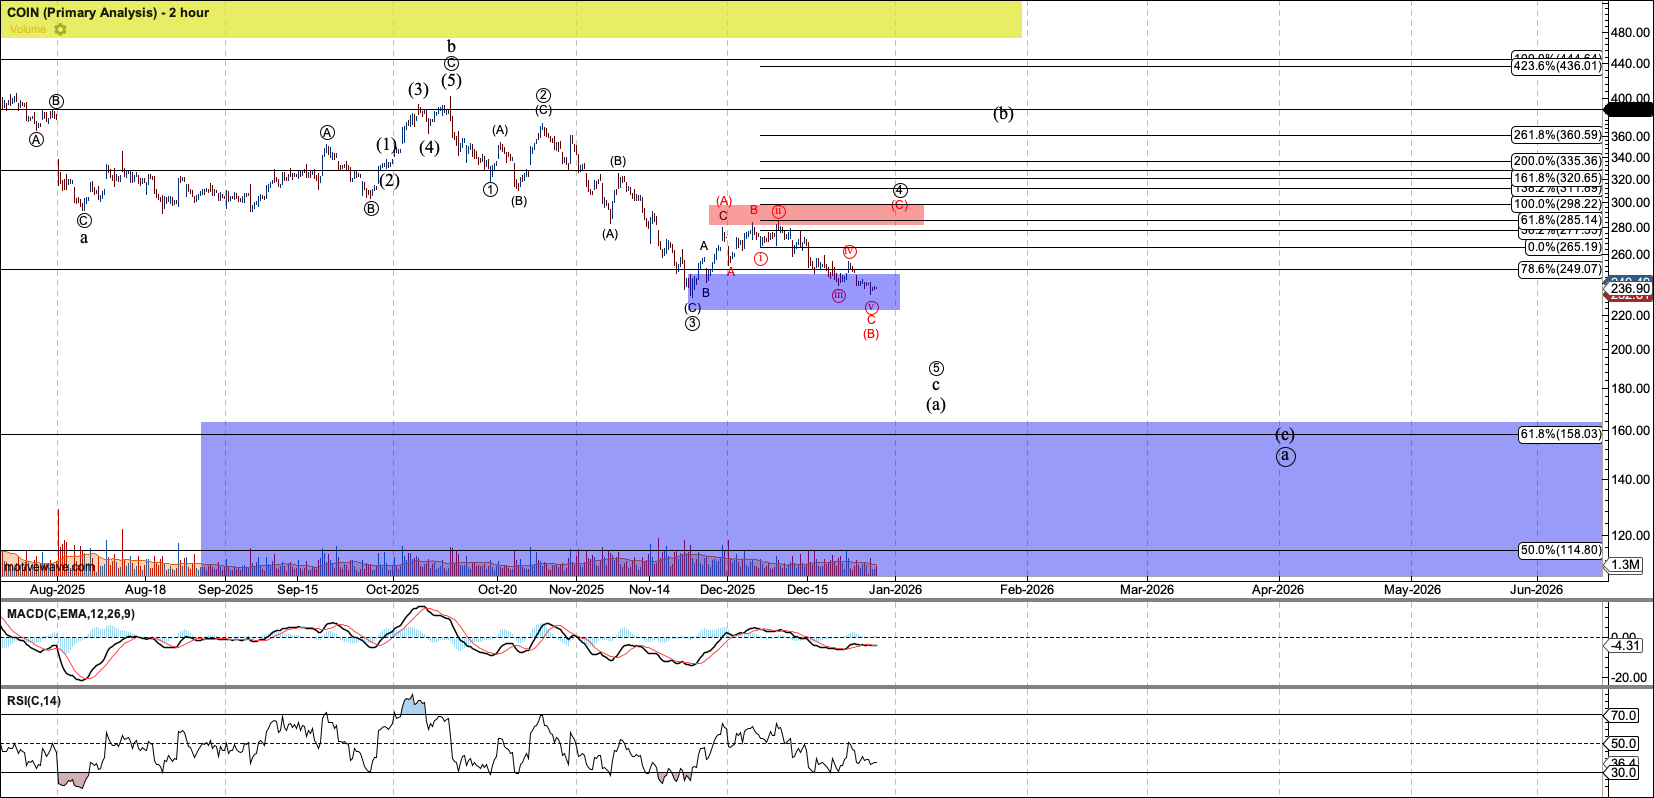
This is my fourth article this year that covers the major top that has formed in Coinbase (COIN) since I started this series in May. In my last article, published in October, I expressed some doubt that the top would last when its b-wave was pushed to the limit. However, it did stick the top in circle-2 and has since given us a good third-wave dumping. Further, the rally off its late November high is corrective, and I see more lows likely in the not-so-far future. That said, I plan to use this article to discuss where I am looking for an immediate low, which may give us a tradeable rally.
I believe it is important to say that this top in COIN neatly corresponds to the important top that I had been looking for in Bitcoin. I held out the target of $125K since 2021, and so far, the action has not disappointed. Bitcoin has fallen over 30% since topping at $126K and change. That said, my view of its Elliott Wave structure suggests that if Bitcoin can hold $75,500, it can try for another all-time high in the near future. Breaking that level would suggest that this bearish cycle is just getting started.
As nice as it is for a top in a crypto industry leader’s stock to correlate with a top in Bitcoin, I do not drive the analysis in one chart by looking at another. If you trade MSTR, which derives much of its theoretical value from the Bitcoin it holds, you know that it topped in 2024, while Bitcoin went on to put in more highs in 2025.
This fact expresses the perils of correlation as a strategy and forcing it into analysis. The key levels I am watching in COIN are derived from its own chart, and I am not sure how they will fit with Bitcoin’s structure in the future. The two charts are hard enough to call on their own without trying to force-fit them together, although they may seem to rhyme at times.
With that, Coinbase (COIN), in my perspective, has broken the first key level, signaling a major bear market. As long as it doesn’t post an impulsive reversal over resistance, more downside is assumed. Bitcoin has more work to do.
Recent Action in COIN
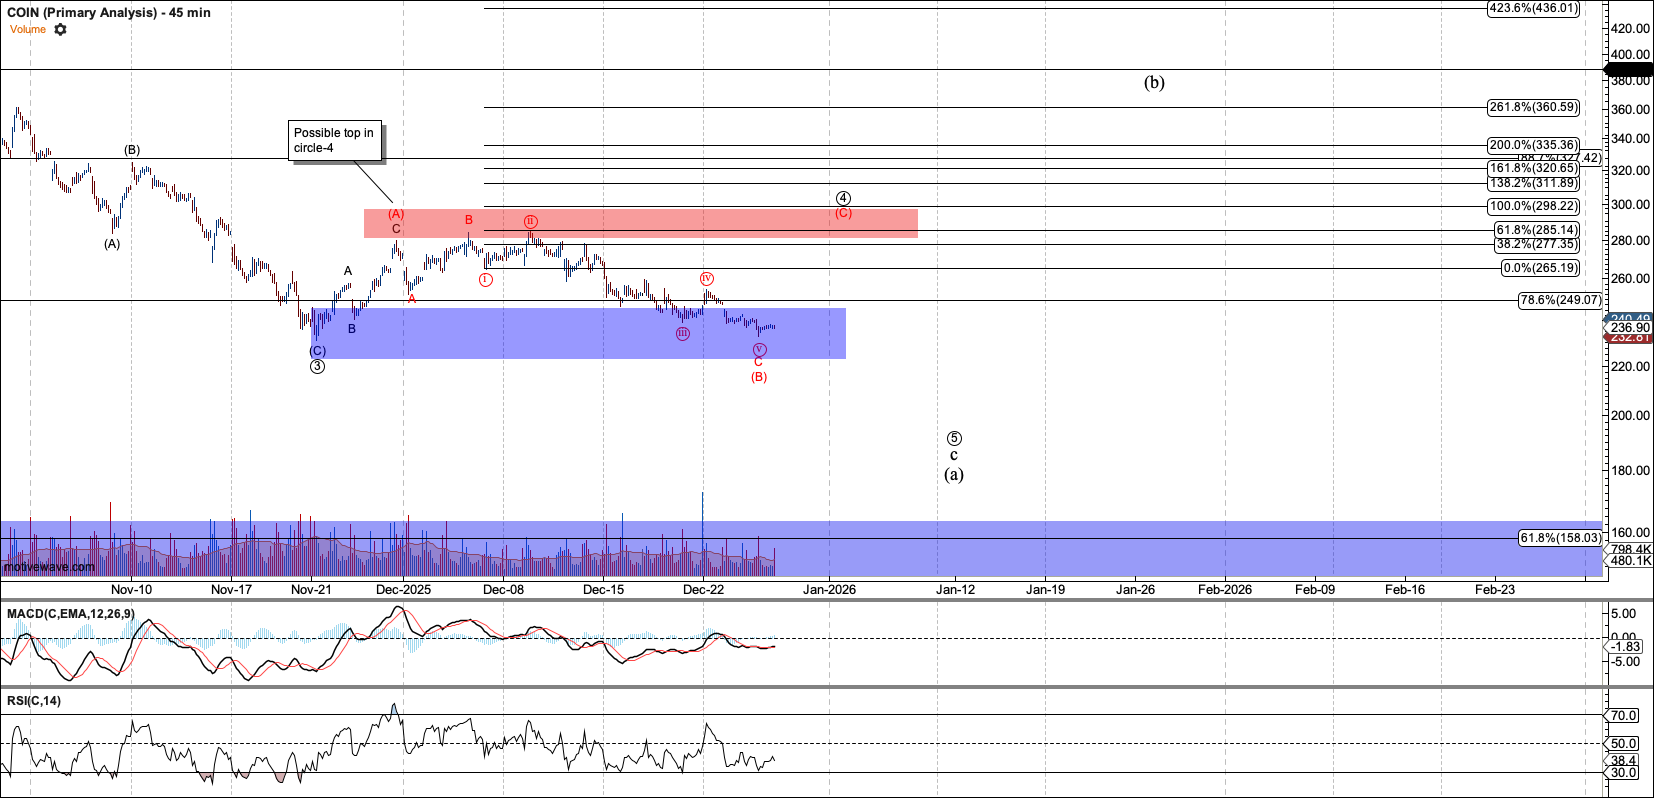
Zooming in on the recent chart of COIN, we notice it topped in circle-2 shortly after my October article. Third waves are the most extended of Elliott waves, and often the fastest moving. Both conditions were fulfilled in the Coinbase chart, with it dropping nearly 40% in a bit less than a month.
If you think that pain has ended for COIN investors with the rally off the November low, think again. This rally is clearly corrective, having the structure one expects of a fourth wave. So long as COIN holds under $300, I have a projection for circle-5 to reach $200 before a more intermediate rally comes to give COIN holders relief.
COIN has come down nicely from my resistance zone, marked with the red box on my chart. However, that move down also looks corrective, which may portend another push back to resistance in red-(C) before the final move to $200. Regardless, the rally off the November low indicates—via both height and structure—that a drop to $200 is likely.
A Relief Rally or Tradeable Bottom?
Once COIN reaches the $200 region, it should mark the end of the first A-wave off the top. If this bear market takes COIN as low as $50 in the coming years, it will be the A of a much larger A-wave. However, B wave to follow can take COIN back near its all-time high. Sometimes, B waves can briefly break over all-time highs. Therefore, this expected B wave can provide relief, as well as a way out, for those who held COIN through this drop.
It is understandable for those who trade based on fundamentals to hold through such a decline. As described in previous articles, there are no warning signs in COIN’s business or financials. You wouldn’t know it by looking at the stock.
For the truly adventurous, this B wave can produce a tradeable opportunity on the long side, and I am likely to wade into these waters. Just note that B waves are corrective structures that require more trading skill than impulsive moves. Internal structure tends to be overlapping, with deep retraces, and reliable targets are hard to come by in B waves. But those with a fast-in, fast-out mentality can make the play.
Conclusion
Before I conclude, I remind you that when I analyze markets, I hold no crystal ball. While many of my “predictions” have held out for years, markets sometimes force me to change my view with new information. Calling for such a severe bear move in COIN while it seemingly acts like a rocket ship makes me nervous. Expecting it to last for years—or at least be range-bound for years—and go as deep as $50 likewise makes me nervous, given the current strength of the stock market. But that’s my job: to call it like I see it. And it is also my job to hold those views loosely, because the market can tell me I am wrong. But hasn’t this call worked well so far? Yes, it has.
Thankfully for COIN holders, they should get one more exit before the next big move down, which can take COIN below $200. For the truly adventurous, it may provide a rally that generates a 50% to 100% return—but only for the skillful. Eventually, if COIN finally makes it to $50, it should provide a truly great wealth-generating opportunity.
