Capturing A Fibonacci Time & Price Setup In AAPL
When Fibonacci time and price parameters come together at the same time, it is definitely worth watching. The most recent daily setup in AAPL is a good example of this.
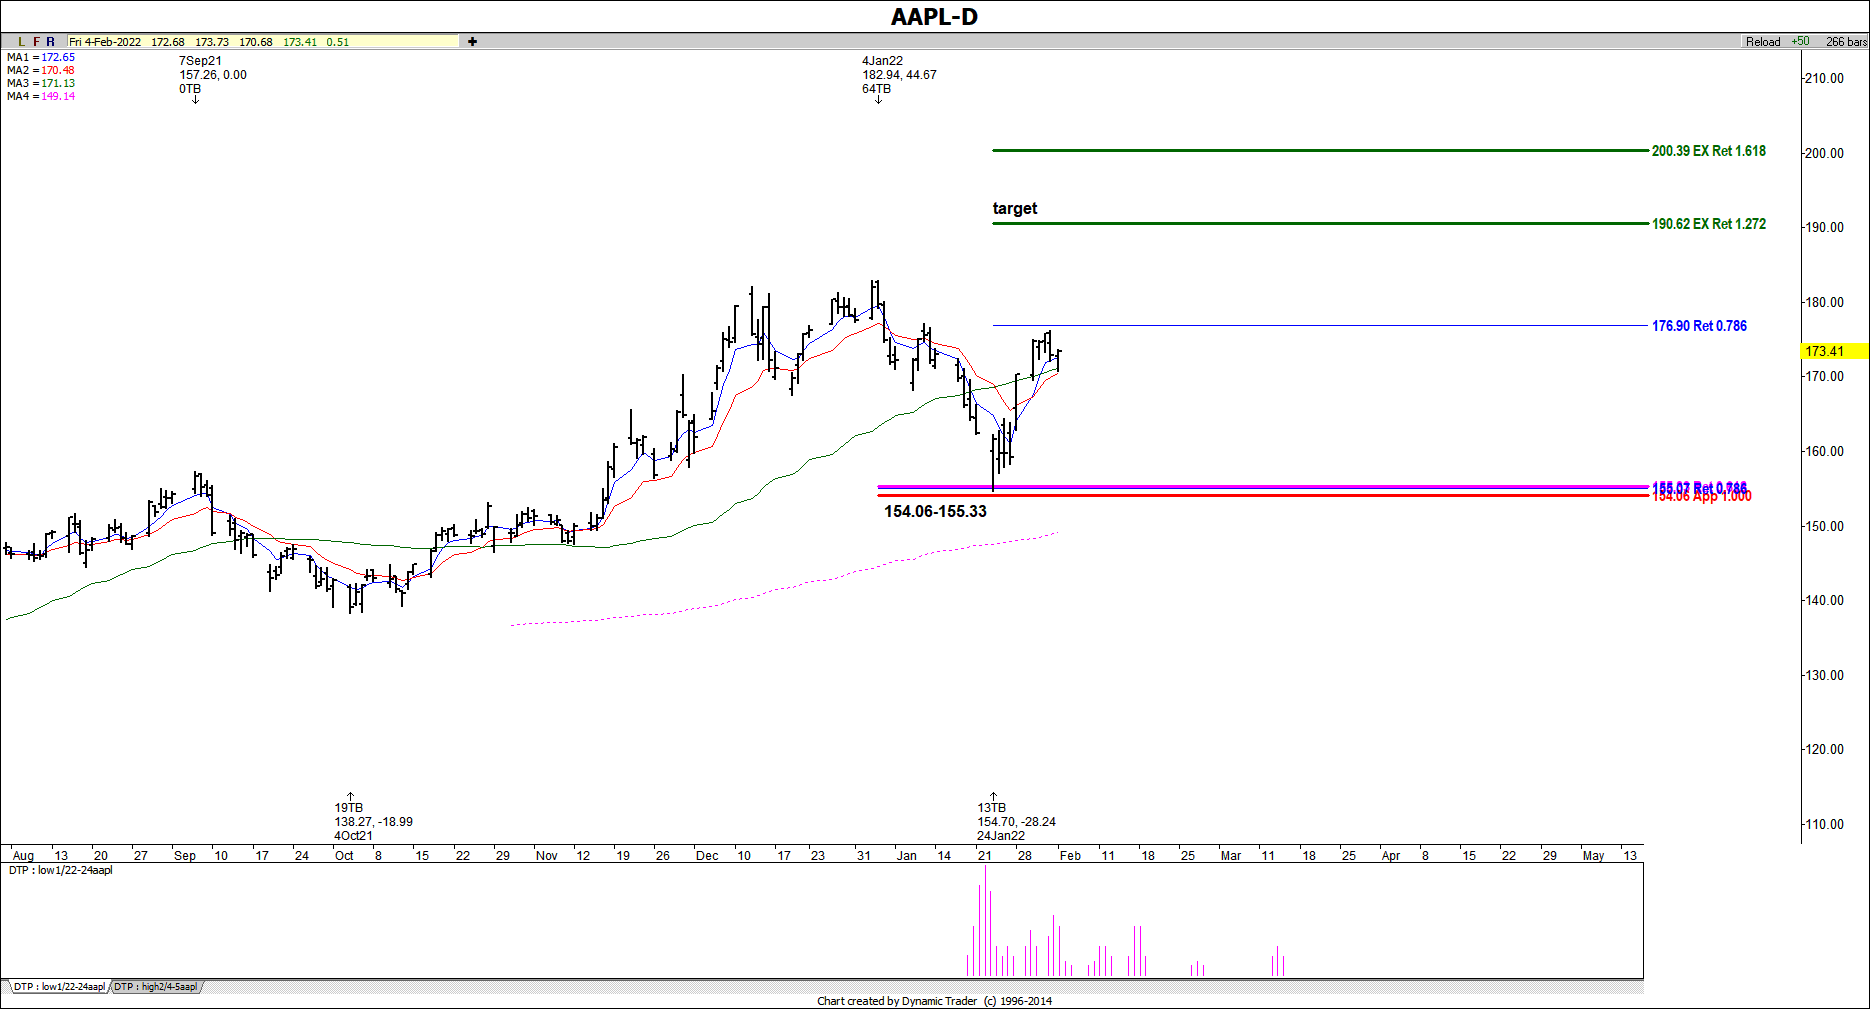
We had a Fibonacci price cluster at the 154.060155.33 area which included a .618 retracement, a .786 retracement and a 100% price projection of another prior swing down. Note that the actual low was made directly inside this zone at 154.70.
At the same time we had a Fibonacci timing histogram suggest a possible low with cycles between 1/22-24. The actual low was made on 1/24.
Once this triggered on a 15- or 30-minute chart, it was ok to take a buy entry and keep it overnight. If we can clear the .786 retracement next on the upside, then we are more likely to head up towards target 1 at 190.62.


