Capitalizing On TLT's Turns
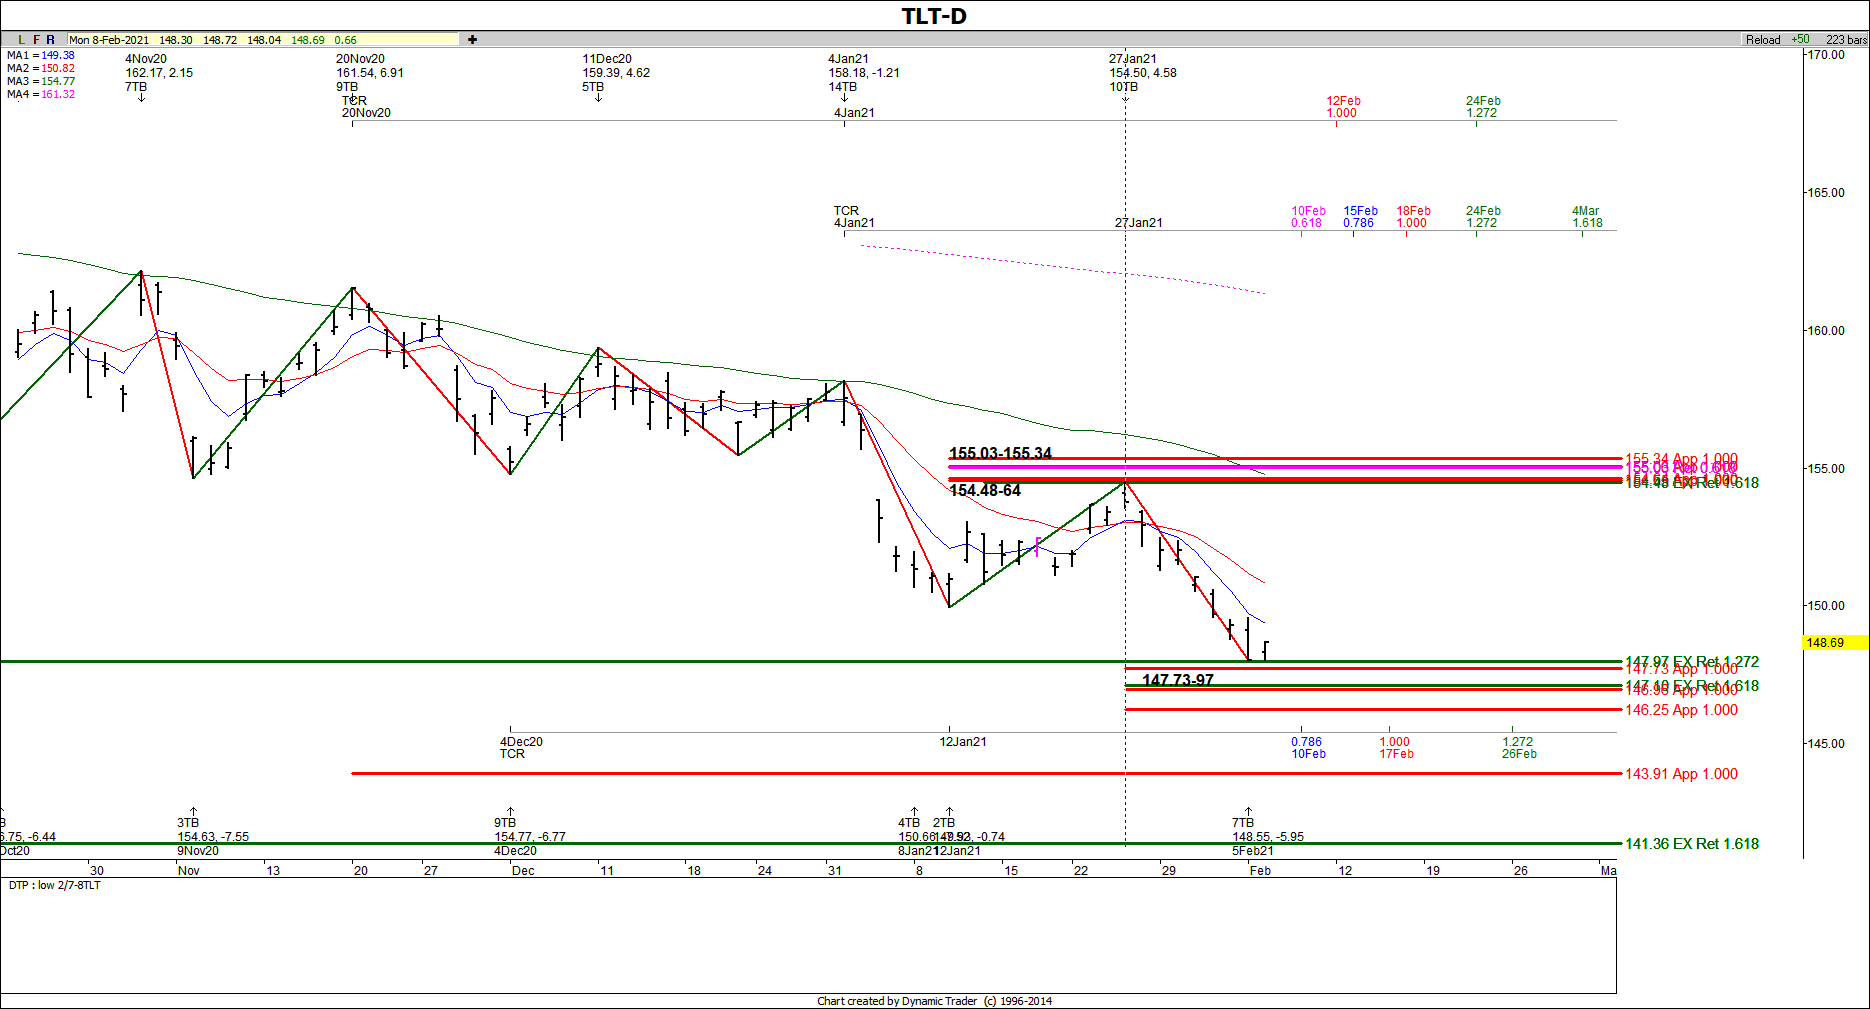
We identified a short setup in TLT late last month as the 20+ Year Treasury Bond ETF approached a price cluster of resistance in the 154.48-64 area. The actual high was made on Jan 27 at 154.50 directly within this sell zone.
A trigger for a short came in on the 15-minute chart once we broke 153.70. At that point our definition of risk was either above the 154.50 high or above the top end of the zone at 154.64.
Last week we finally just about met our downside target #1 in the 148.68 area, and noted it was good time to ratchet down stops on shorts as we were testing support and timing for a possible low to develop.


