Bitcoin Blastoff! - Market Analysis for Jul 13th, 2025
 By
Jason Appel
By
Jason Appel
Bitcoin Blastoff!
Last week's article's title, The Fakeout Thesis is on Thin Ice hinted at the interpretation of the lower timeframe action on Bitcoin becoming increasingly bullish. Subsequently, the action over the past 3-4 days has put the "fakeout" potential resoundingly to rest with a strong breakout. And as a matter of fact, all of the conditions for adopting the bullish green count, commented upon as a "tall order" from the 6/29 article, Blastoff or Fakeout have been securely met.
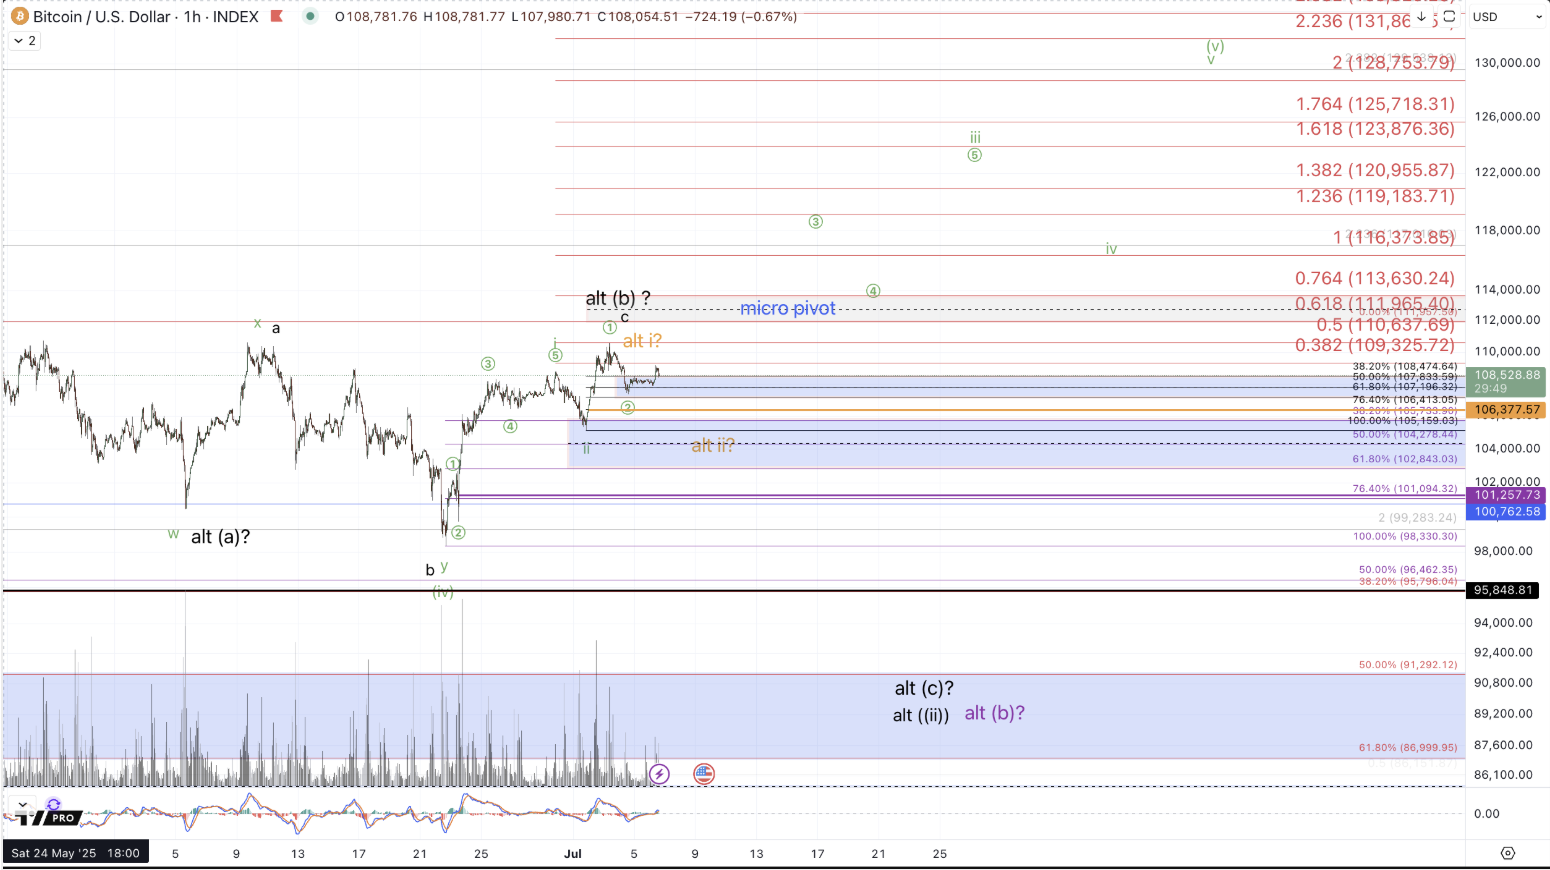
In order to embrace the green count as the primary thesis for a more direct move up to $125k+ without a retest of last Sunday's low, we initially need an impulsive micro 5 wave rally. The move up from last Sunday's low has maintained a potentially impulsive path but I can not say that price has provided a clear micro 5 waves and thus the initial condition for making the green count primary has not yet been met. Also, beyond getting a micro 5 waves up, price then needs to hold a corrective retrace of this rally from the 6/22 low, which would mean a successful retest of support in the $101.7k-$105k region without a break below it, followed by a rebound and takeout of the price that forms a high to this initial 5 wave rally for wave i in green. That's still a tall order.
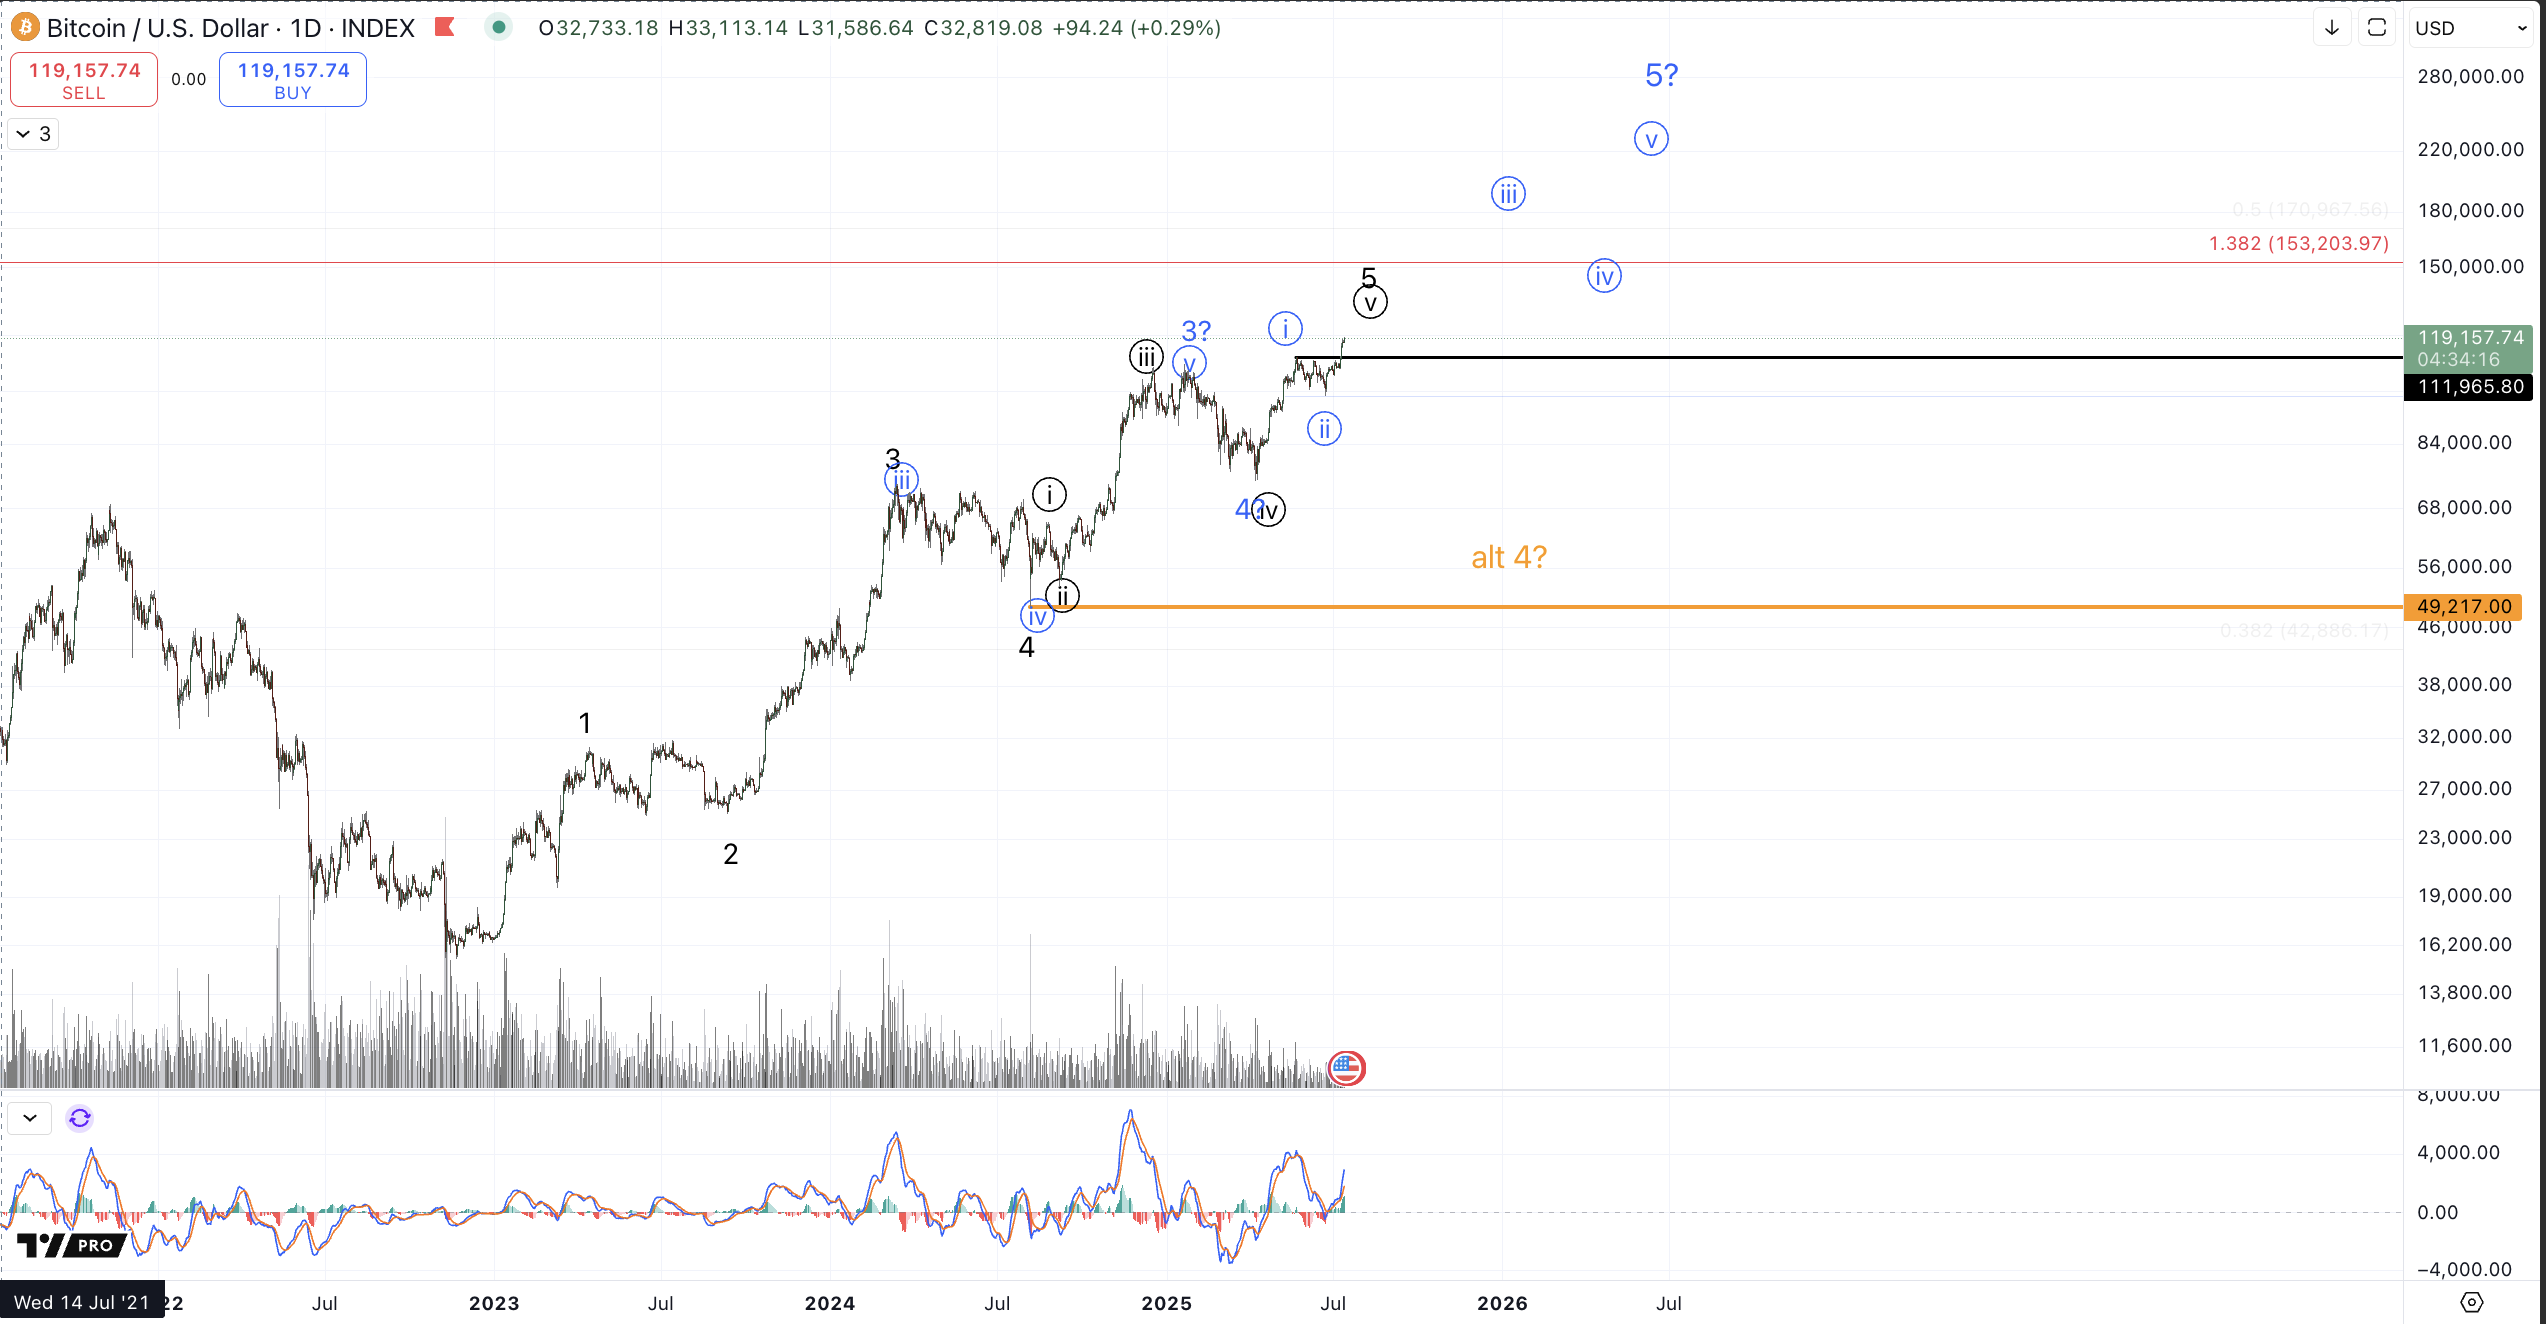
Given the blastoff, I've removed from the charts the paths that entail a retest of $87k-$96k and have relabeled the green count in black.
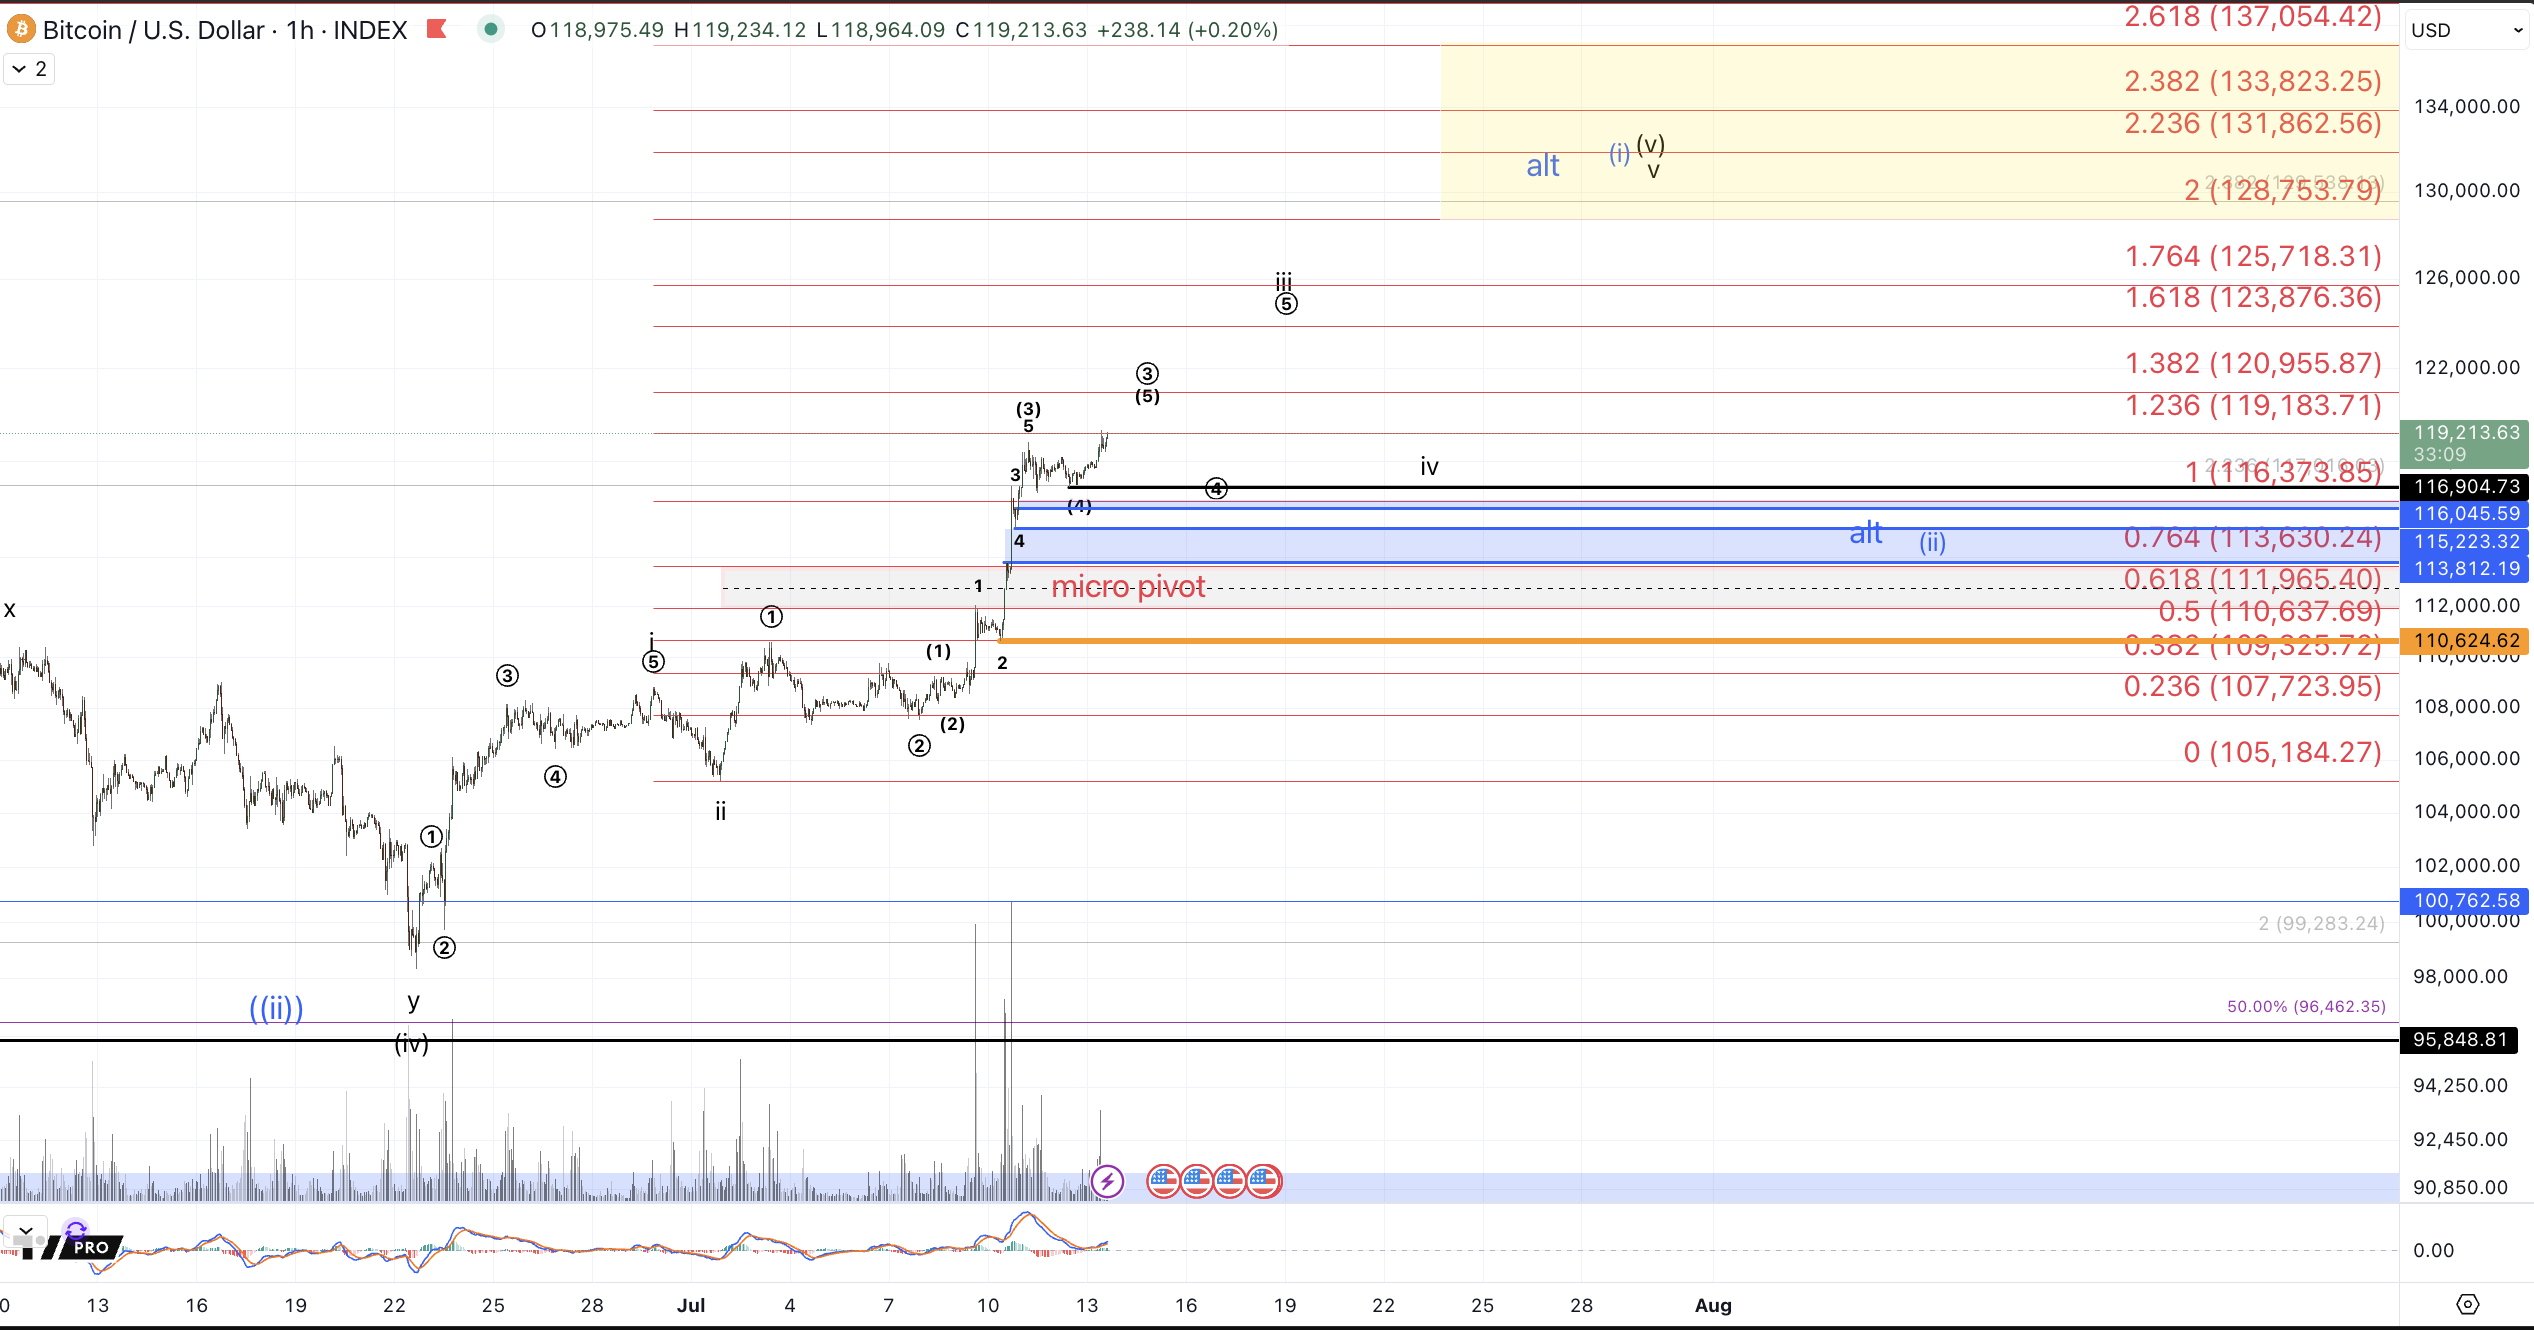
On the lower timeframe, price is subdividing in the latter stages of the heart of the third wave, ie wave circle 3 of iii. At this juncture, the minimum target for circle 3 has been met with a move over $116k and we do not yet have any indication of any degree of high in place so I would not rule out further direct extension to the next Fibonacci extension level, the 1.382 around $121k. For any reasonable indication of a shorter timeframe top in place for wave circle 3, I'll minimally need to see a break below $116.9k and even then, price does not need to pullback very much to satisfy a wave circle 4 dip. The Fibonacci region for the wave circle 4 is currently $113.6k-$116.4k with two distinct regions and I don't have an opinion as to whether price will be able to dip below the upper portion, $116k-$116.4k.
So long as the noted wave circle 4 support region is maintained, I don't have any very reasonable lower timeframe alternative path to what's presented here, perhaps with exception of price exceeding the noted targets for each degree. That said, anything is possible. So, if price makes a clear break back below $113.6k, ie, past the blue support region and into the pivot region, I may consider only one more high as necessary to complete this rally from the 6/22 low, rather than another circle 4-5 to complete the iii and then another iv-v. Even in the less bullish case, I'd still expect a "hit" of $125k before a lasting top as that's been our target for this rally from the 2022 low. In order to jettison the forecast of price reaching this target in the current cycle, I'd need a break below the 7/10 low at $110.6k. Should price come back through that level, without completing the 5 wave structure from the 6/22 low as suggested on the 1hr chart, a lot of complex possibilities open up and grow in probability. These would generally range from bearish: the rally from the 2022 low has topped, to bullish: price is getting an expanded flat to retest the $87k-$96k region for a larger circle ii variation of the blue count.
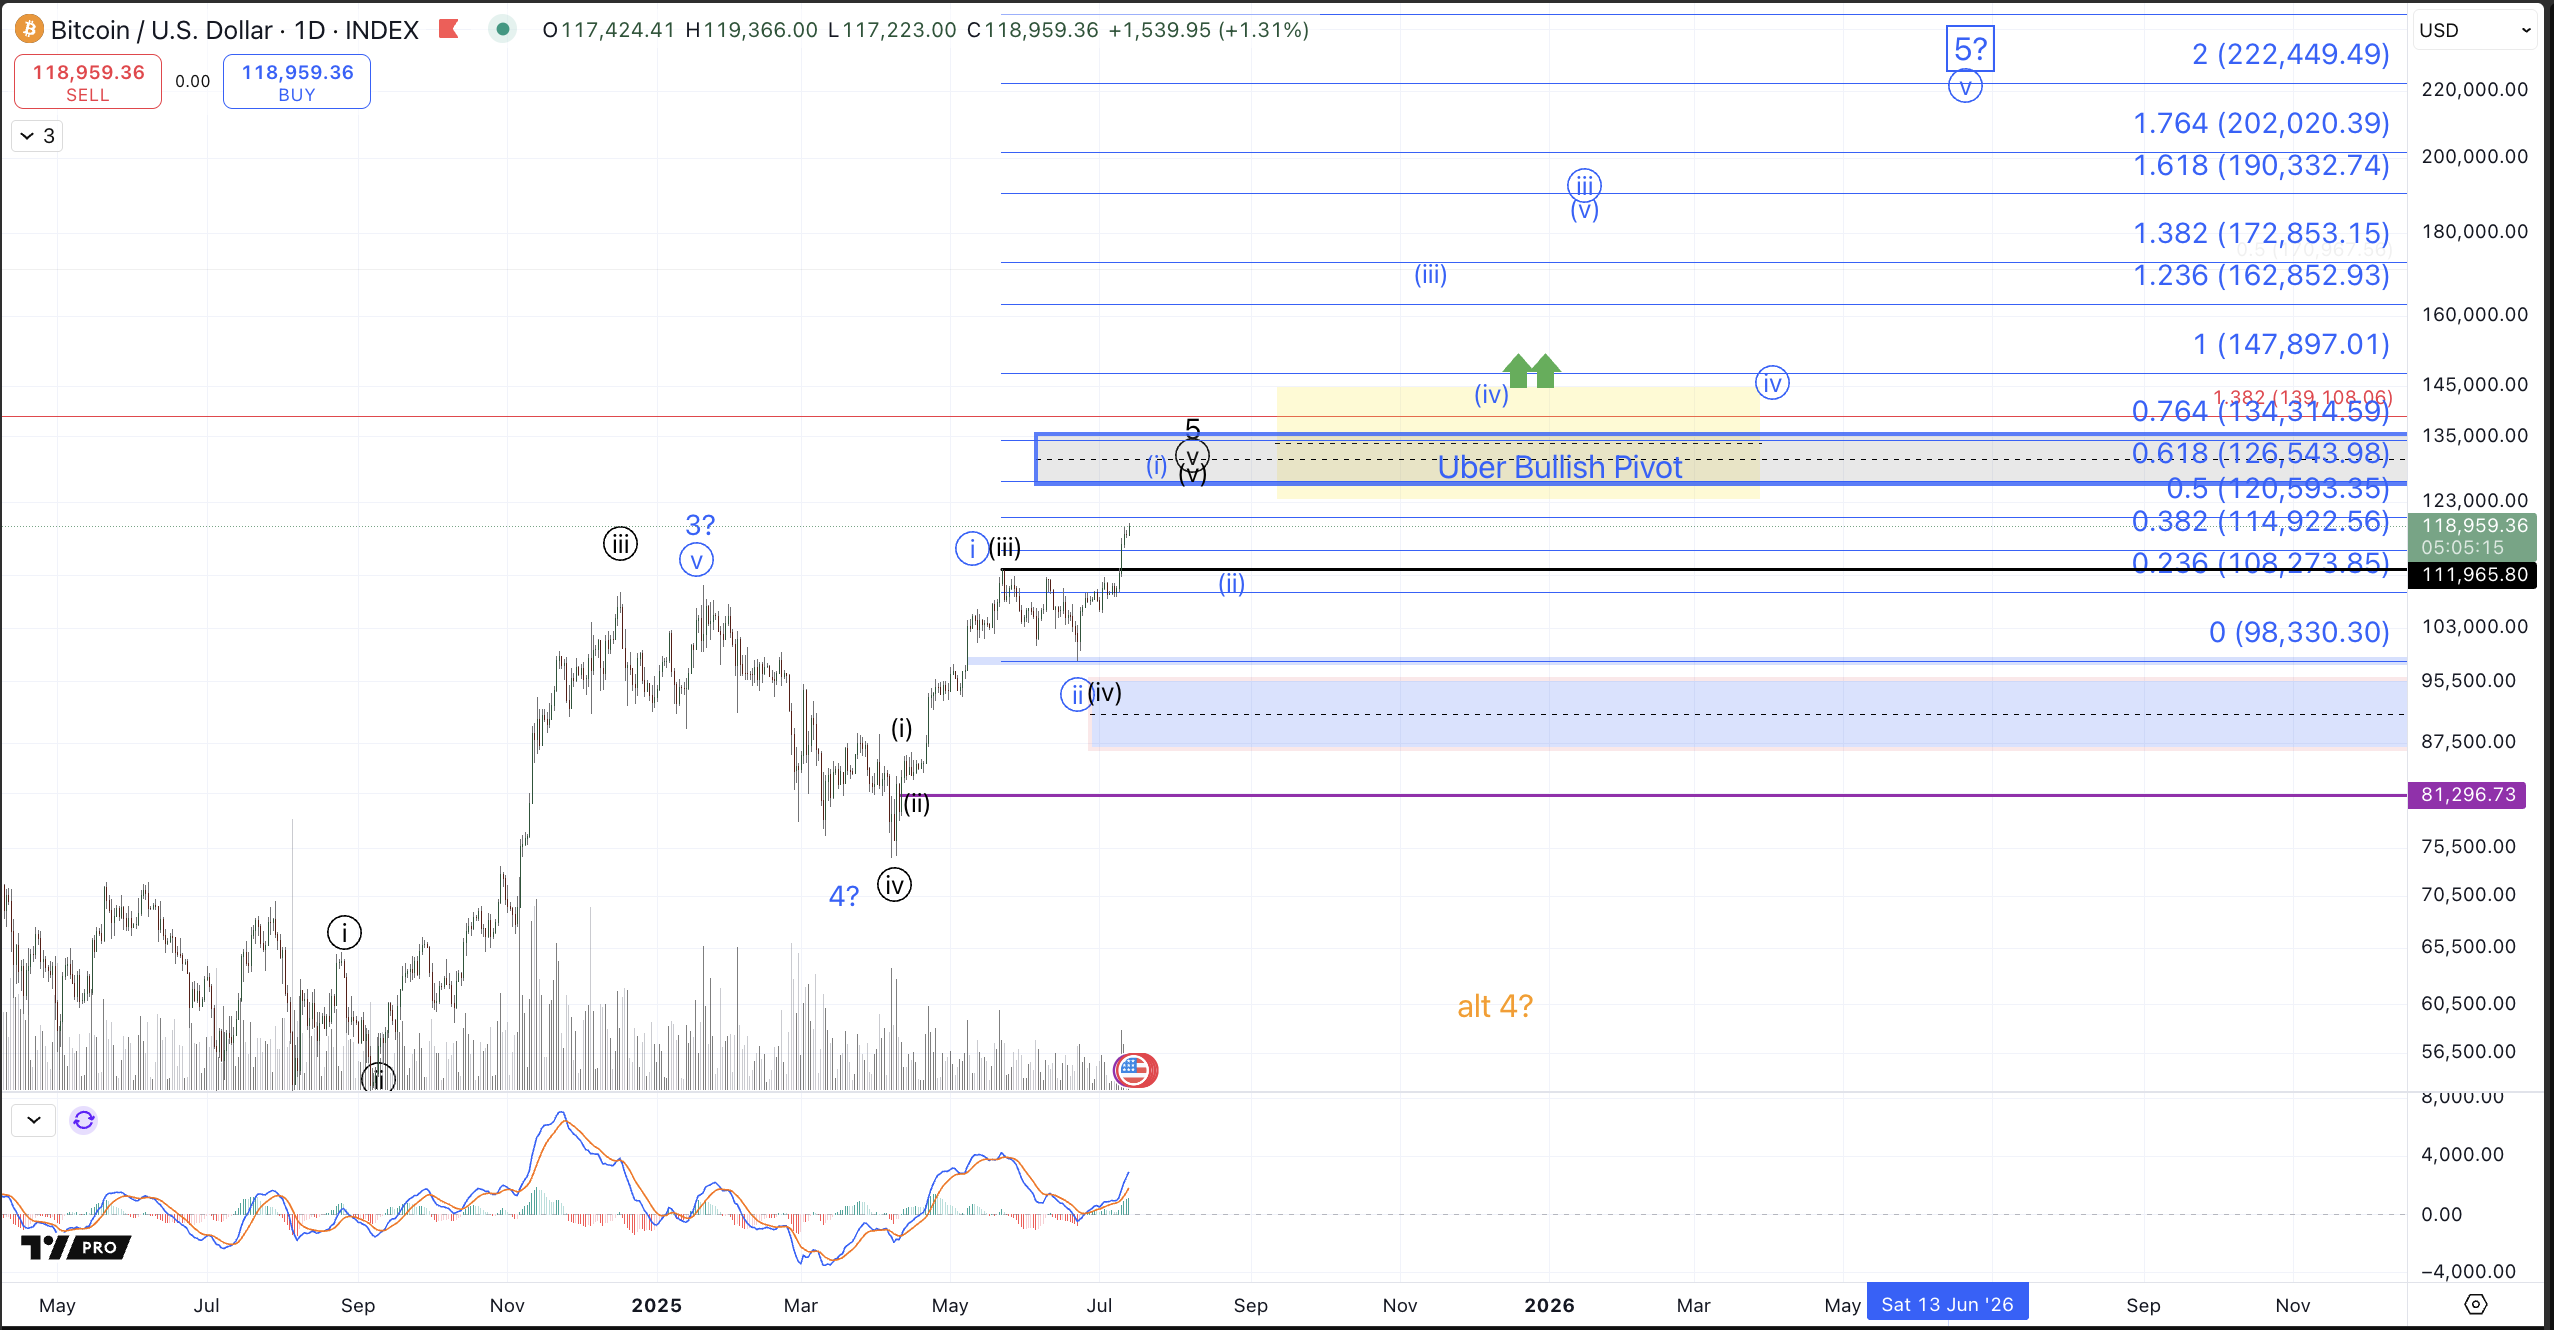
As for the higher timeframe bullish potential that's been presented in blue. Even in the event that price does get continuation upwards over the following months to reach the $200k+ region within this cycle, I don't expect a direct breakout in that path without first providing a multi-day to multi-week wave (ii) pullback. That is to say, I'm only following the path on the 1h chart for right now (described above) which portends price targeting the $128k-$137k region based on the i-ii from the 6/22 low. Notice that this region has decent confluence with the larger degree .618-.764 extension on the Daily chart. In order to reasonably entertain an uber-bullish path to $200k+ on a direct basis, ie, without a clear wave (ii) pullback, I'll need a direct breakout above the larger degree 1.0 extension, $148k~ and then for price to use the pivot region, $126k.5-$134.3k as support for all subsequent pullbacks. So, my expectations are for this rally from the 6/22 low to terminate prior to exceeding $148k at which point we'll establish support for the bullish blue count to distinguish it from the black count that would entail a very large degree top in place as a complete rally from the 2022 low. Generally, my expectation for this currently rally is that price will top in a range that would place blue wave (ii) support for that count in the $110k-$120k region. The July low, about $105k would then distinguish between the blue and black counts.
I'll conclude with a warning to mindful of risk. The past few months have been outstanding for Bitcoin holders but we'd be wise to recognize that the current euphoria will not permanently last. As has been discussed before, while this cycle may have a decent amount of upside left, odds are strong that the majority of the move from November 2022 is in hindsight and very large positions would be wise to consider trimming some profits, trailing some stops, and reducing some risk as price pulls towards key targets.