Bitcoin: The Fakeout Thesis Is On Thin Ice
 By
Jason Appel
By
Jason Appel
Bitcoin: The Fakeout Thesis is on Thin Ice
While we never get to fully know a market's movements until after they have occurred, our study of price action gives us probabilistic clues and hints as to its future movements along the way. Last week's article, explored the question of whether the impulsive rally from the 6/22 low could reasonably be a "fakeout," ie, Bitcoin was potentially teasing an immediate breakout to the long term cycle target ($125k+) only to suck in some new longs and punish weak hands with a breakdown to test larger support in the $87k-$96k region before resuming that path to the ultimate target for this cycle. The past week's price action has not provided a definitive answer to that question but the activity weakened the more immediately bearish case (black and purple counts), while concurrently strengthening the immediate bullish case (green count)
In last week's article I described the conditions for strengthening the bullish thesis to primary status
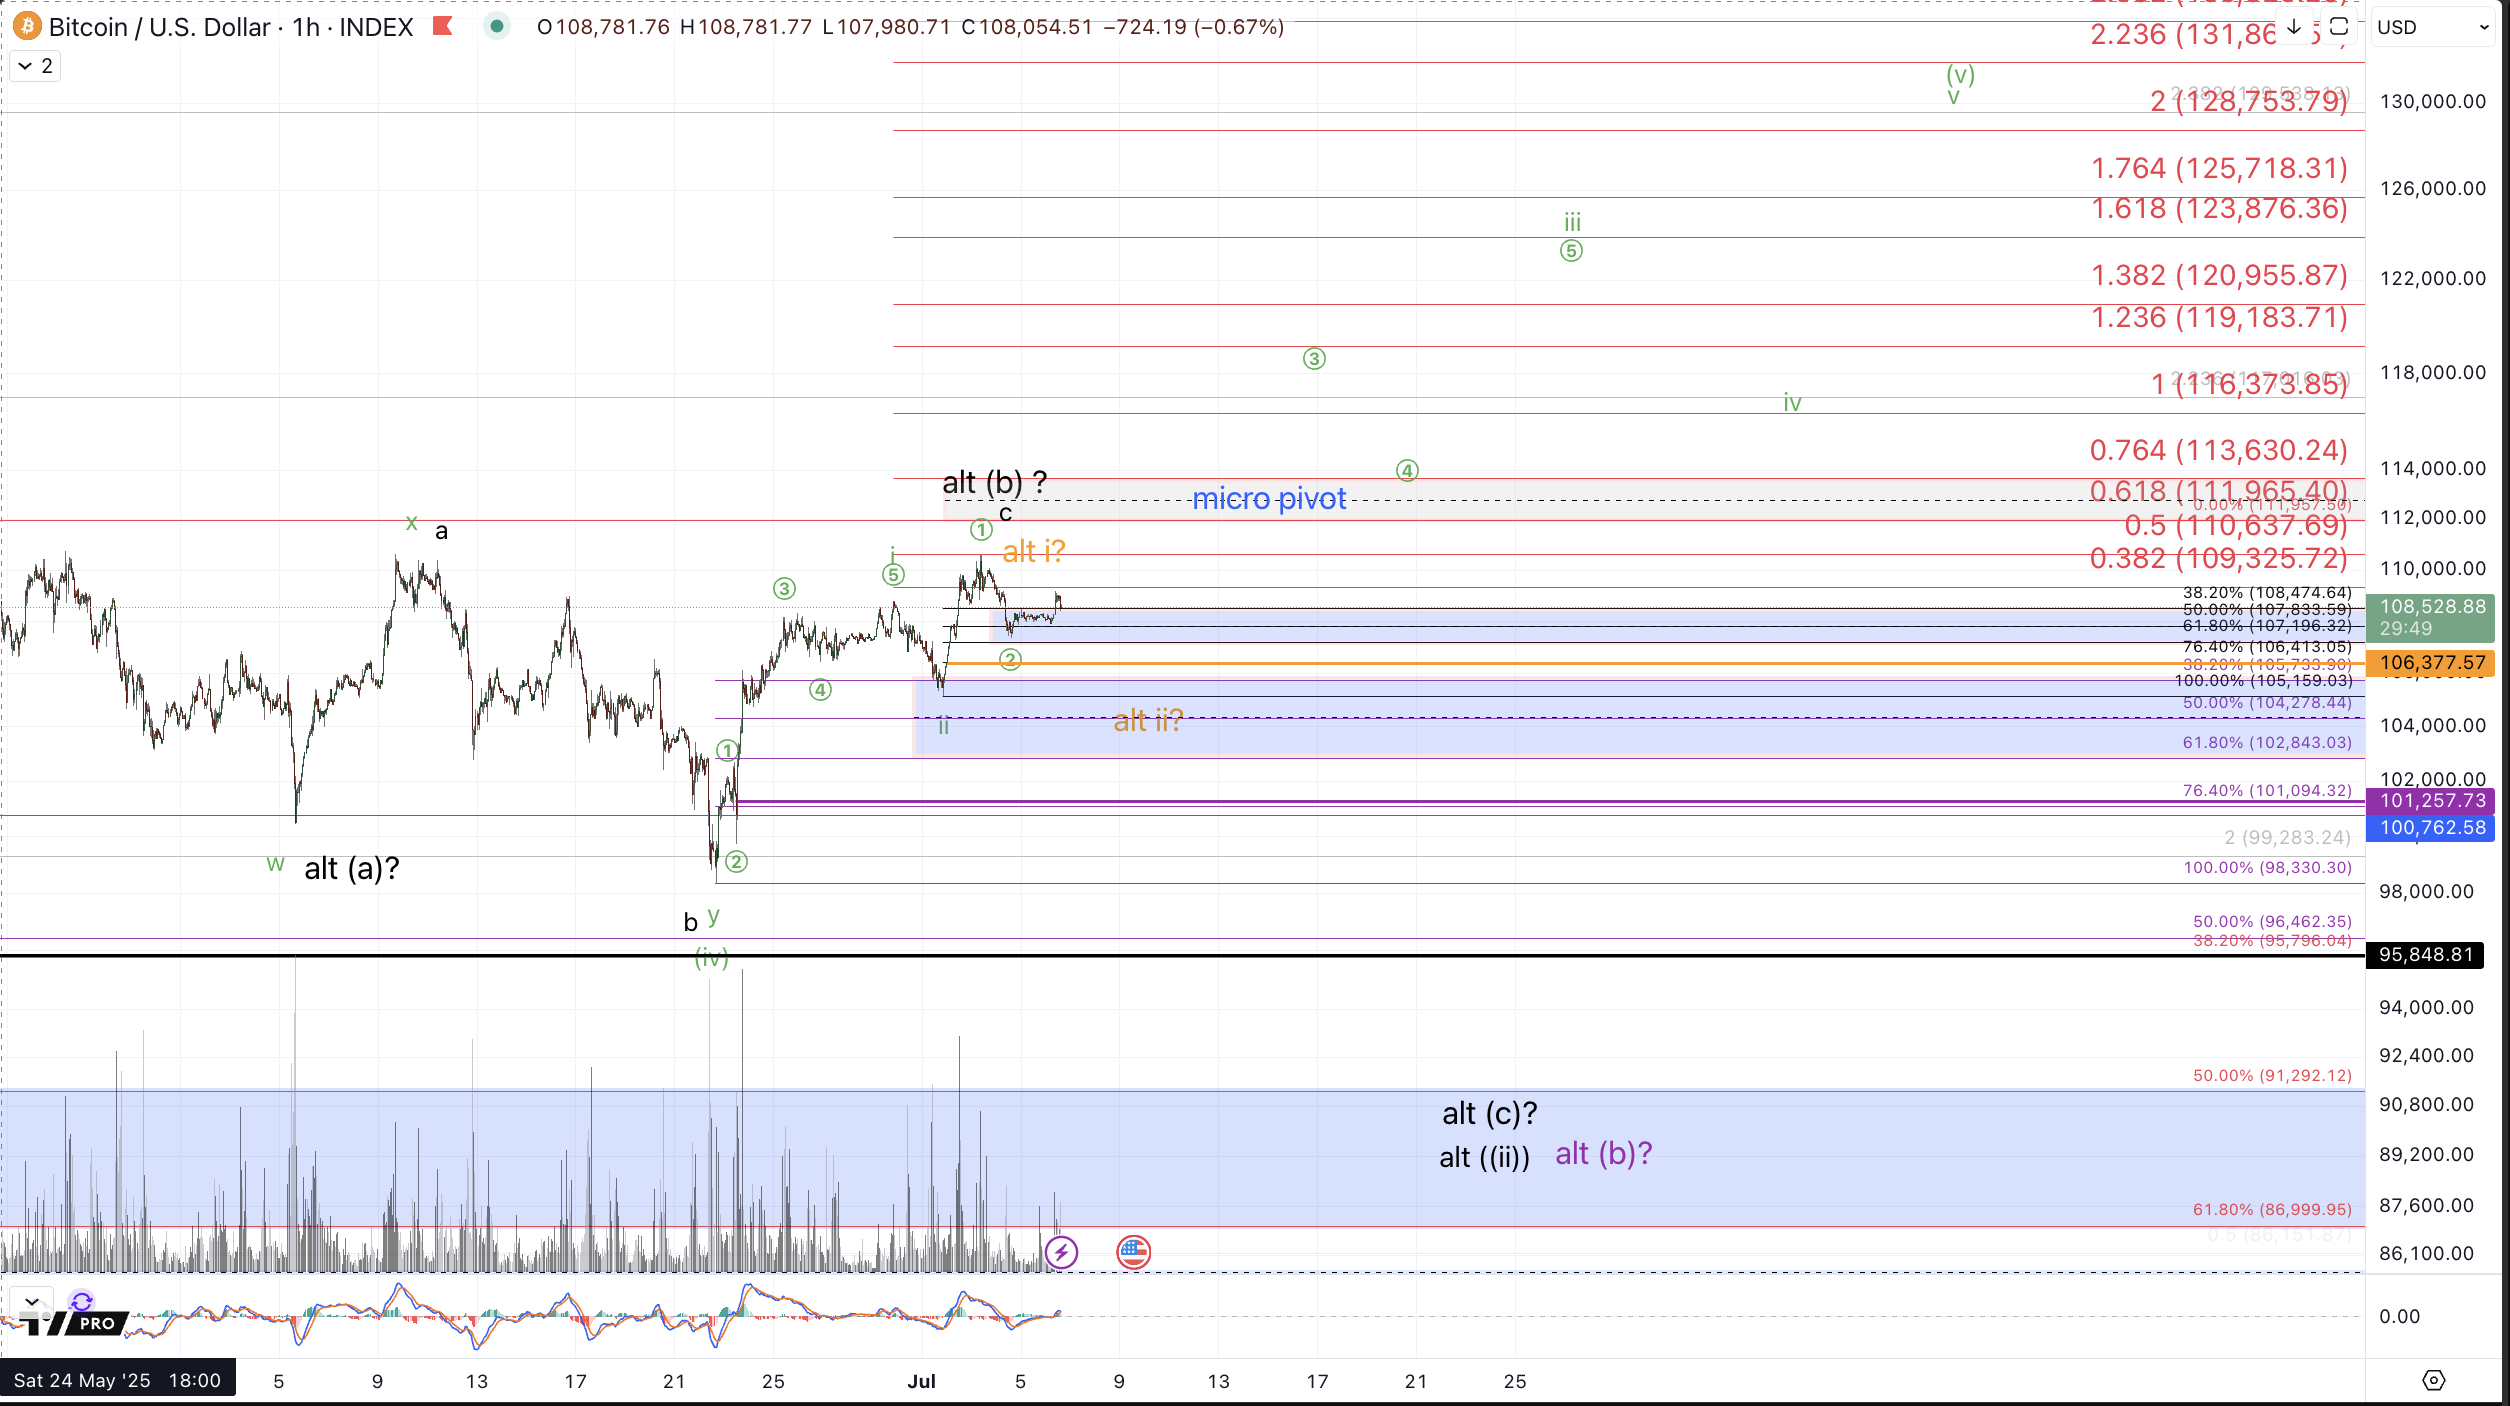
In order to embrace the green count as the primary thesis for a more direct move up to $125k+ without a retest of last Sunday's [6/22] low, we initially need an impulsive micro 5 wave rally. The move up from last Sunday's low has maintained a potentially impulsive path but I can not say that price has provided a clear micro 5 waves and thus the initial condition for making the green count primary has not yet been met. Also, beyond getting a micro 5 waves up, price then needs to hold a corrective retrace of this rally from the 6/22 low, which would mean a successful retest of support in the $101.7k-$105k region without a break below it, followed by a rebound and takeout of the price that forms a high to this initial 5 wave rally for wave i in green. That's still a tall order.
In the action that's subsequently followed since publishing last week's article, price has satisfied conditions for a clear micro 5 waves up (circle 1-2-3-4-5 subwaves within green wave i) followed by a successful test of subminuette support for wave ii and another impulsive extension for a wave circle 1 of iii. Also, I should note the prospect of a subtle alternative to the green path (shown in orange). The shallowness of the drop into Tuesday's (7/1) low allows for a reasonable interpretation of July's price action to be considered as an extension of a larger micro 5 waves off the 6/22 low, meaning the drop into the low on 7/1 and bullish reversal into the high on 7/3 can be a reasonable circle 4-5. This prospect is displayed in orange and would allow for another test of what I'll now call mid-support for a bigger i-ii from the 6/22 low. This region has moved up slightly to $102.8-$105.8k
So, immediate support for a direct breakout here has moved up to $107.2k-$108.5k and price is testing this region over the 4th of July holiday weekend. As long as $107k is holding Bitcoin is in a posture that's ripe for immediate breakout potential. However, for us to instead favor the aforementioned, larger wave ii, in orange, we'll need to see a break below $106.3k which would then favor a test of the noted $102.8-$105.8k region. Regarding an interaction with that region, those traders favoring a more direct move to $125k+ will not want to see a break back below $101.2k. Should that transpire, the "Fakeout" described last week comes to primary status and I'll be looking for a test of the $87k-$96k region, and ideally a test of $90k more specifically.
How much fuel is there for a direct blastoff?
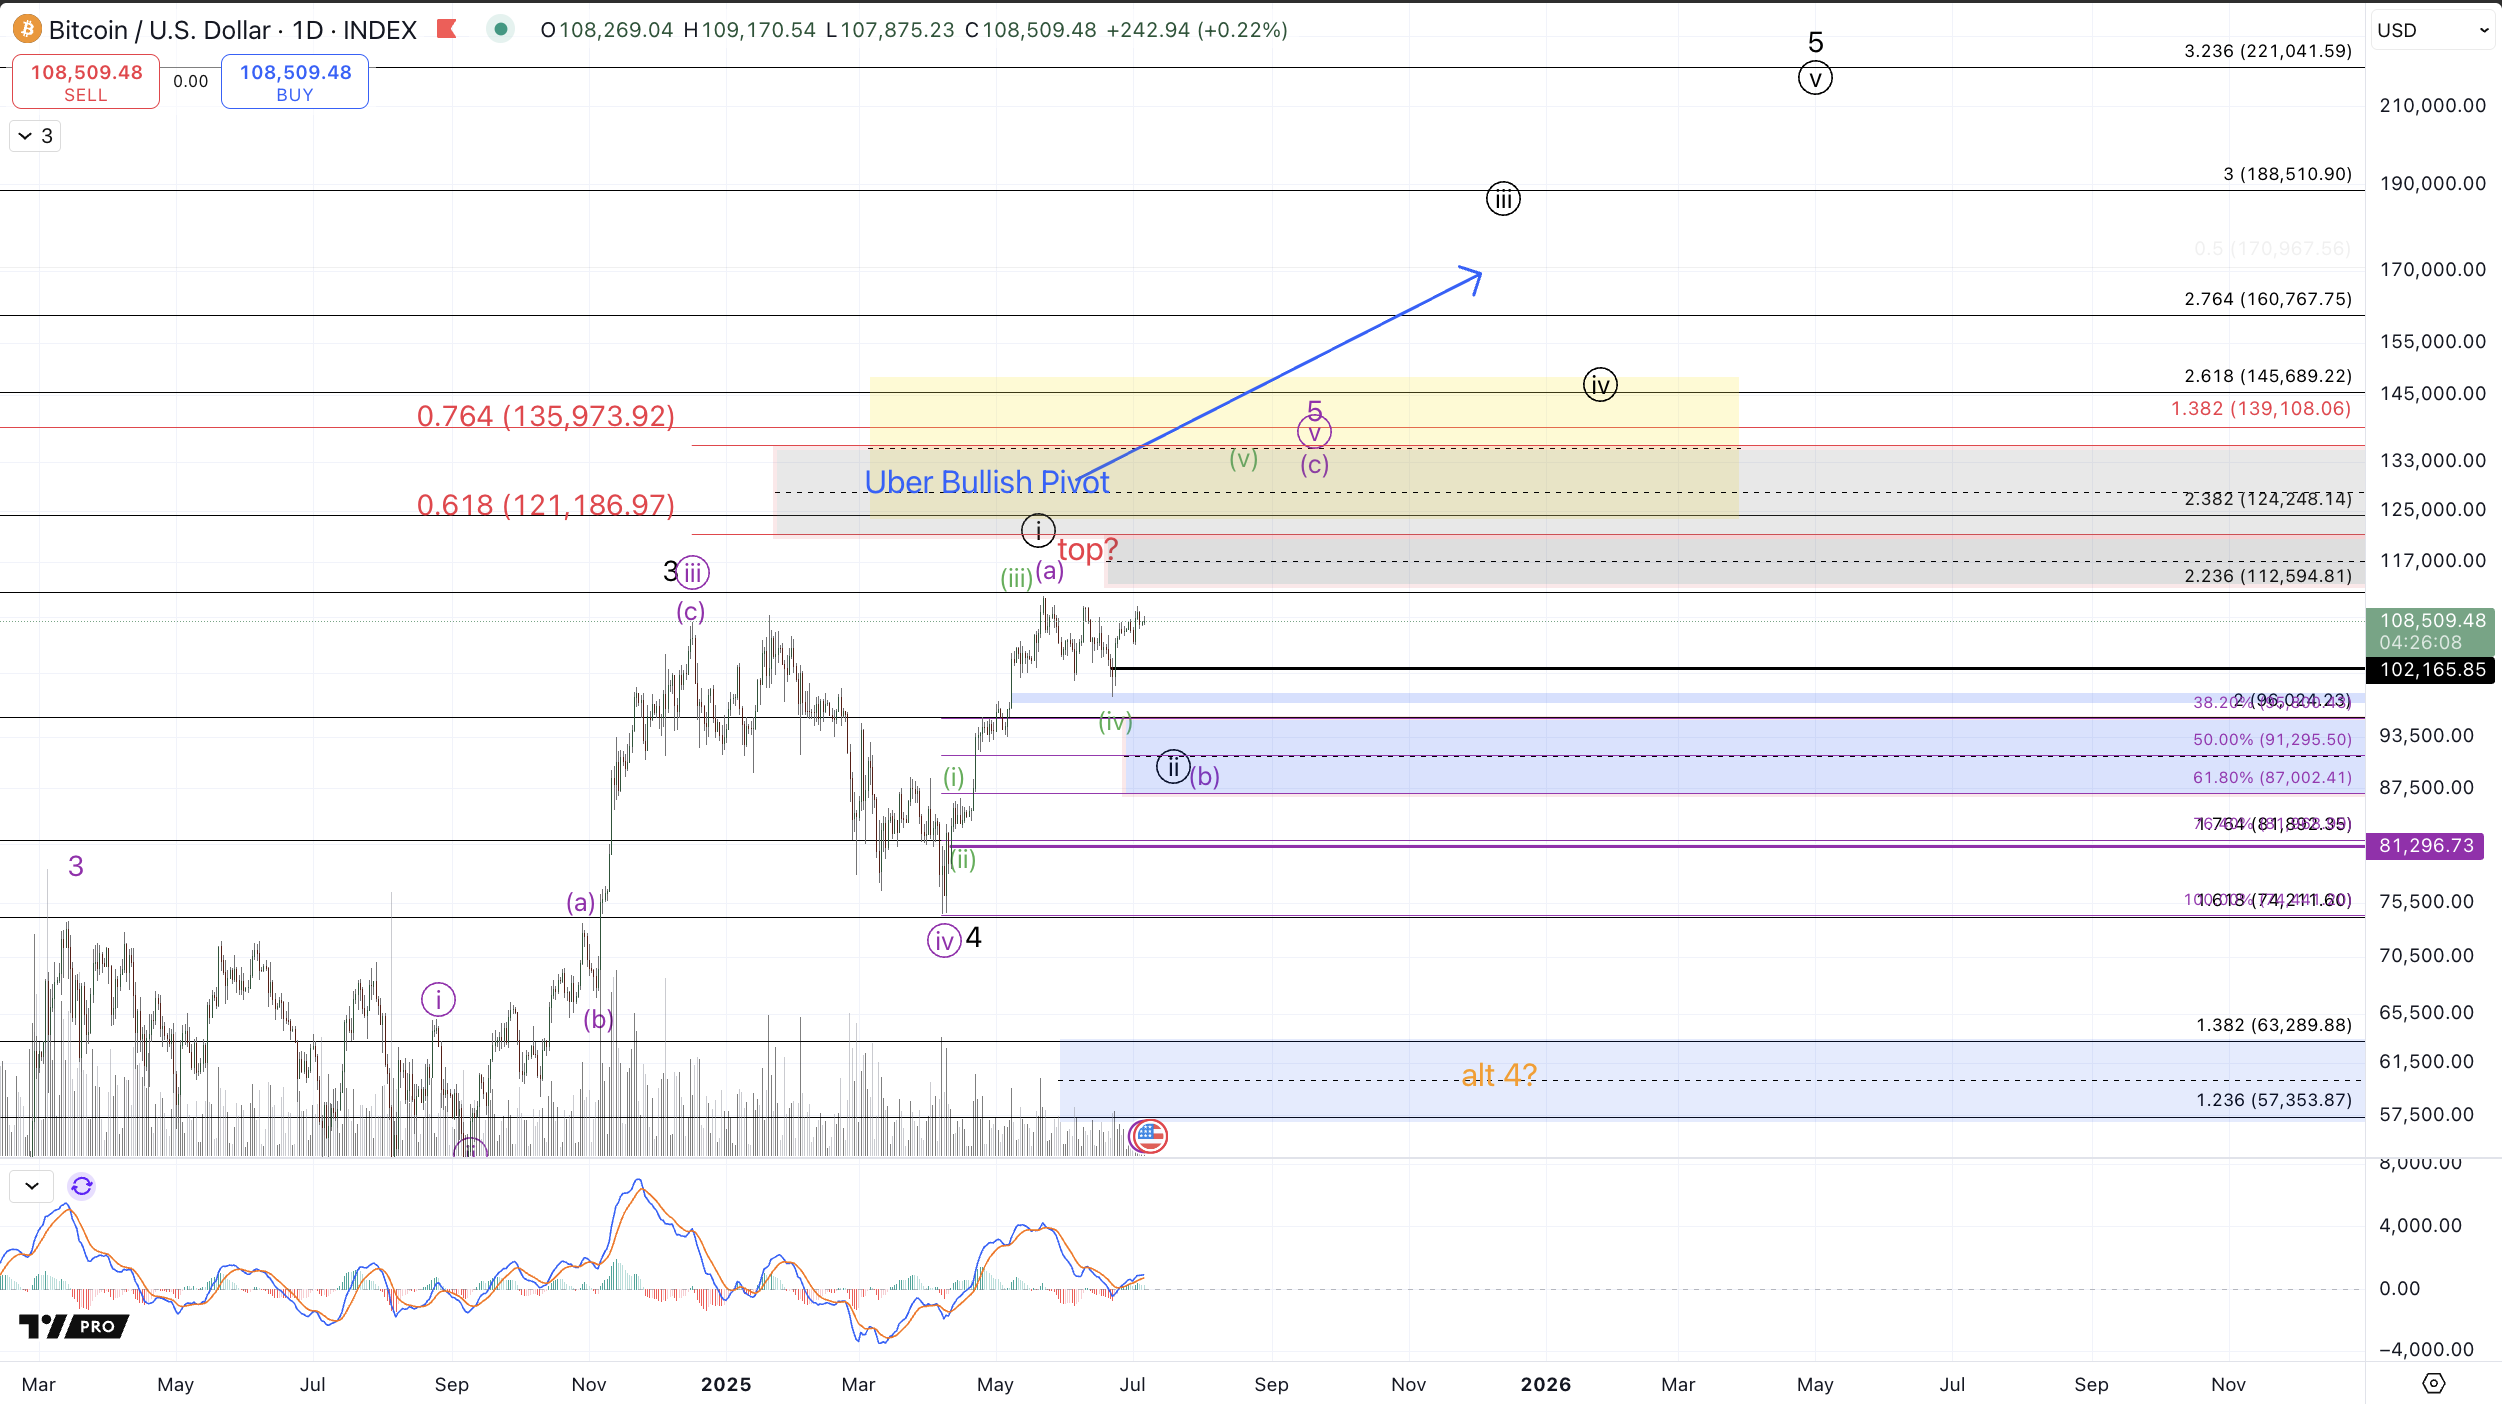
Presented in the recent weeks articles has been an implicit paradox: that a more direct move up to $125k is actually more likely to terminate in the $125k-$145k region whereas a more circuitous path, in which price tests larger degree bull market support ($87k-$96k) before reaching the $125k cycle target has increased likelihood to far exceed that level and instead target $200k+. It's important to note that this more direct move upwards towards $125k that's becoming increasingly favored on lower timeframes in no way precludes the larger degree extension to $200k. Should we see followthrough in the green or orange paths in the coming month, we must turn our attention to the $125k-$135k (specifically, $126.5k-$134.4k) region noted on the Daily chart as the "Uber Bullish Pivot" zone. If price breaks above $135k, the prospect of Bitcoin attaining $200k+ within this cycle becomes increasingly viable. The conditions for the that uber-bullish big breakout to become favored entail maintaining above $125k at all times after a break above $135k. Essentially, if price breaks above $135k, then $125k-$135k becomes necessary support to hold for continued breakout
Please note, I do not consider the breakout to $200k+ in this cycle as my primary thesis but I want readers to be prepared in advance for how this path might become that favorite so there's opportunity to capitalize on it. Overall, the larger context is that price is quite "mature" within this cycle from the 2022 low and holders of large positions would be very wise to mind their risk and consider some de-risking / profit taking within the expected targets. Similarly, this context demands maintaining mindfulness of key levels on the downside should Bitcoin's bullish structure collapse. As noted in previous articles:
Technical invalidation of further upside from the April low requires a break of that low which was struck in the $74k region. Clearly we'll want to see standard Fibonacci support hold ($87k-$96k) but I would certainly allow for a bit of overthrow before jettisoning the bullish thesis. Bitcoin trading back below the 4/21 low, $85k~, starts to become cause for concern, and concerns increase should price break below $82k (the .764 retrace). Specifically, I'm watching the $81.3k level, which is an untested hourly low in the rally up from early April. So, below $85k is a warning shot of the potential that a much larger degree top might have been struck and below $81.3k signals likely impending invalidation of further bullish continuation up from April.
Please keep in mind that this cycle from the 2022 low has rallied as much as 624%, trough to peak, (so far) and has what can count as a complete 5 waves up [already having completed]. This larger degree posture outlined in the 6/4 article should be considered regarding the overall risk and that in a larger sense we would be wise to prepare for a more significant top and subsequent bear market.