Anticipating The Bounce In GOOGL
Sometimes when we don't see a setup on a daily chart, the lower time frames fill in the blanks and we find one!
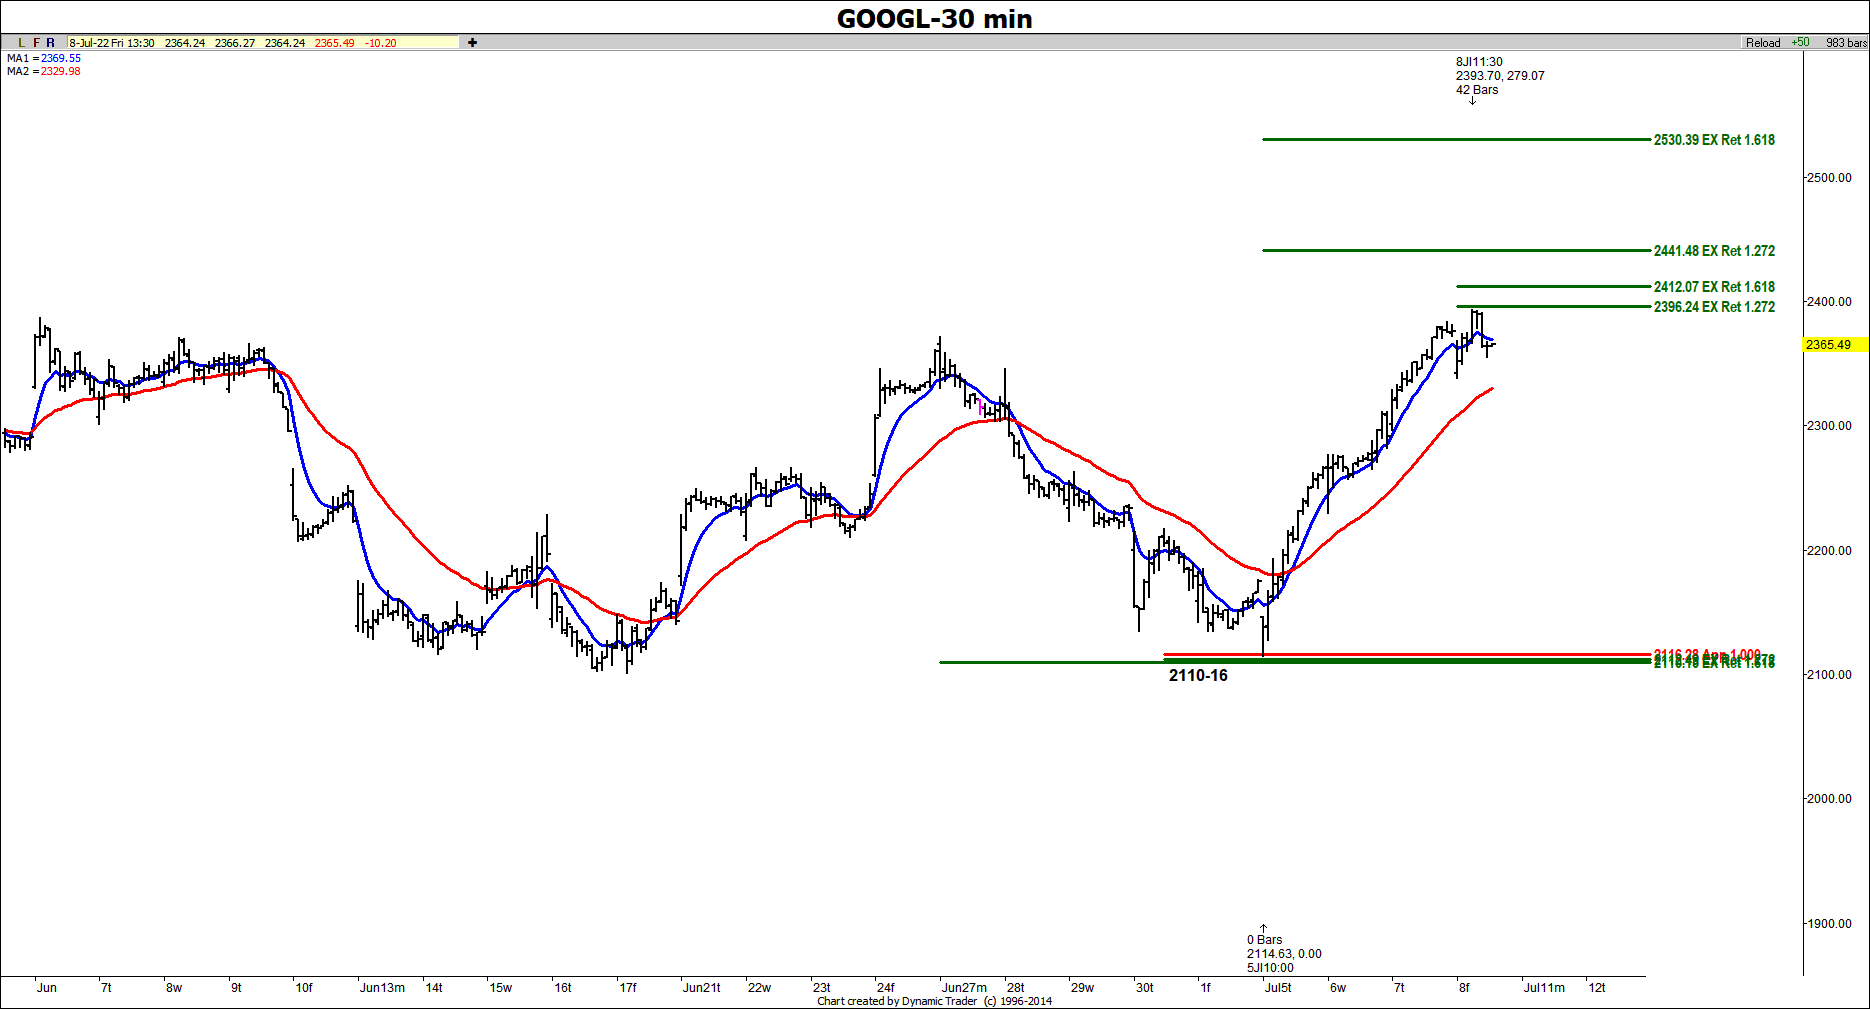
This is an example of a 30-minute chart setup in GOOGL that ended up being tested on 7/5. The zone came in at the 2110-16 area. The actual low was made at 2114.63 which was directly within this price cluster zone. The rally that followed a test of this low has been $279.07 from it.
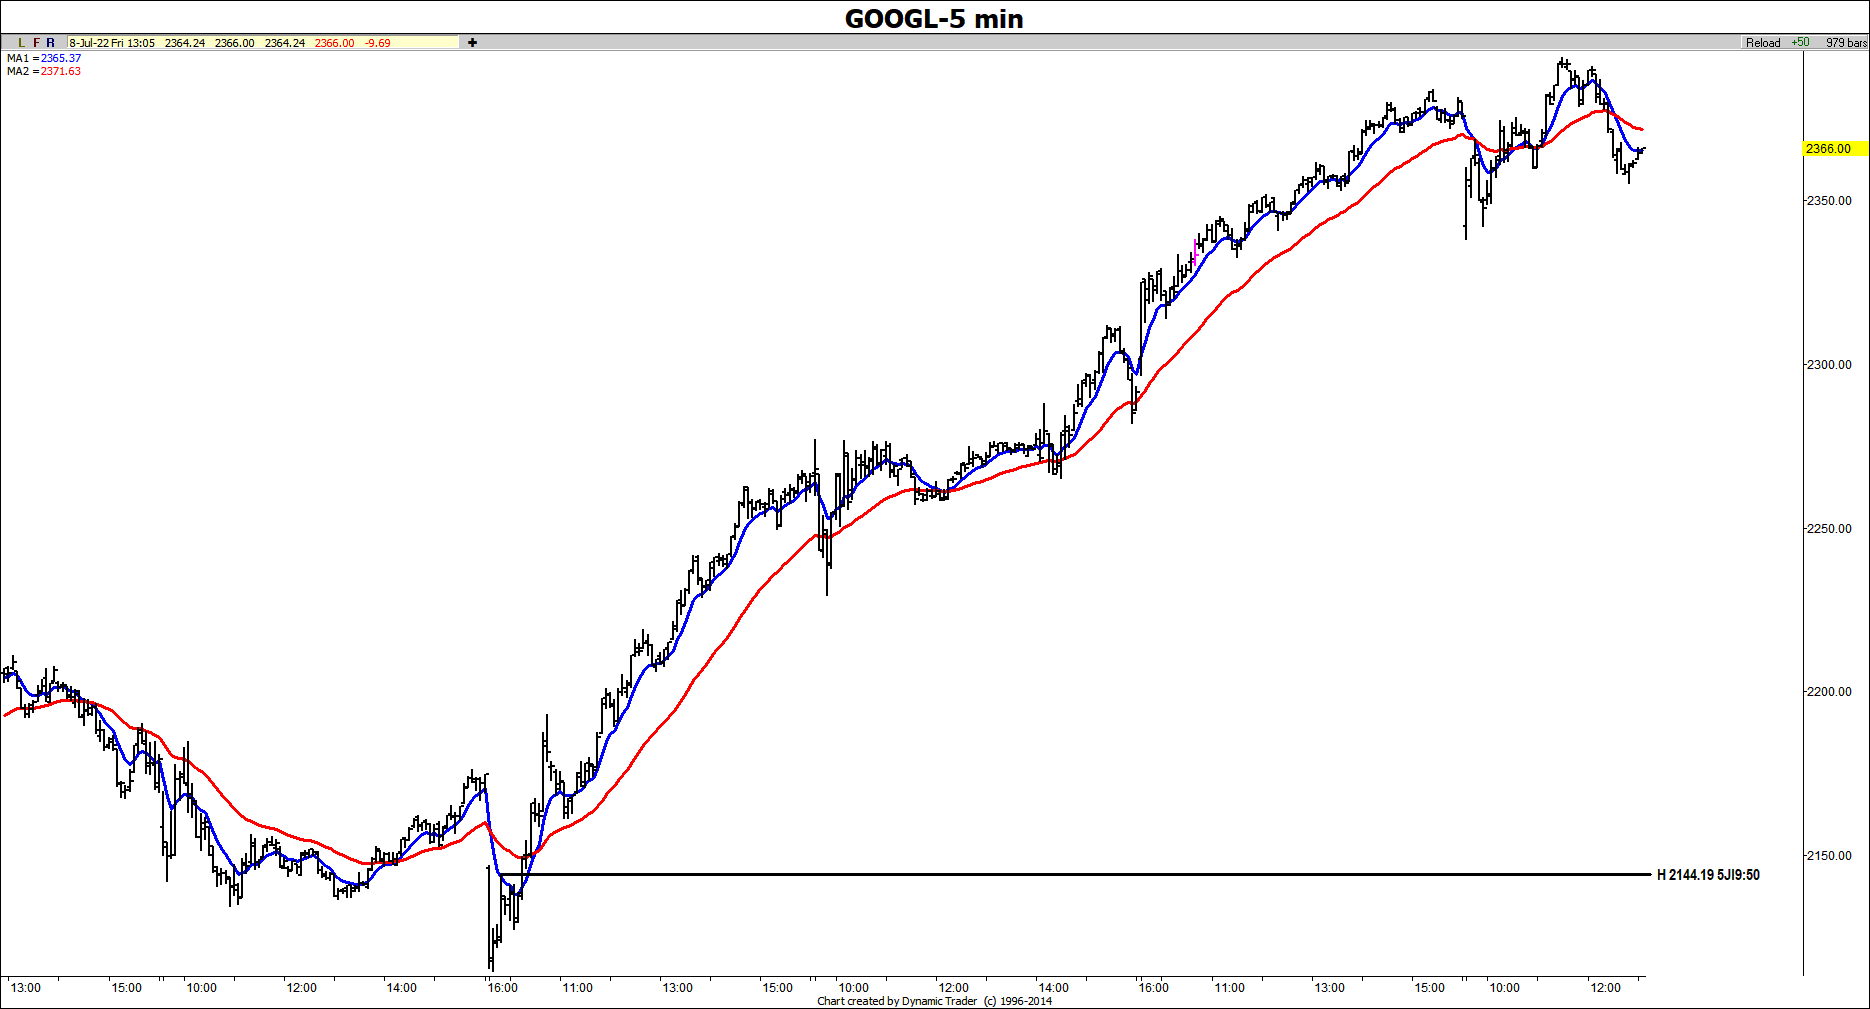
Here is an example of a 5-min chart trigger. Once we saw a prior swing high taken out on the upside along with the 8/34 ema crossover to the upside, you could take the long and risk below the last low or below the actual cluster zone.


