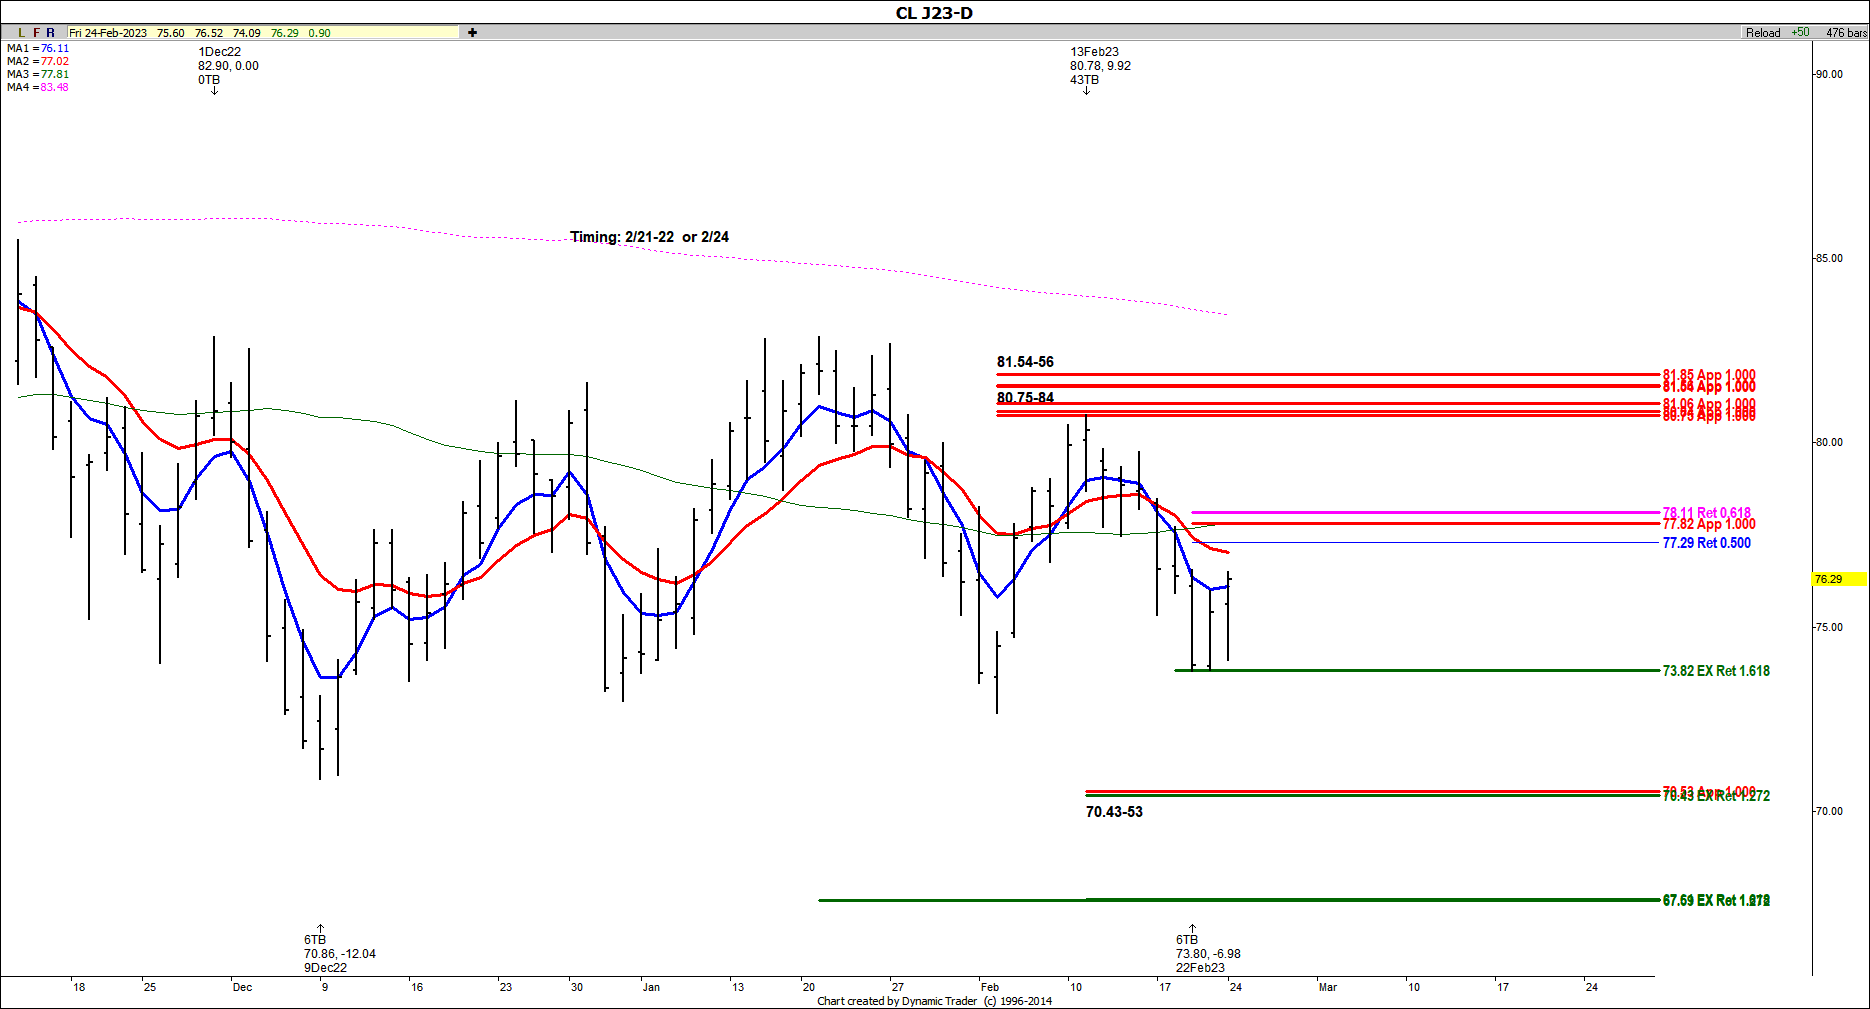
Anticipating Crude Oil's Decline Off Symmetry Resistance
Our crude oil chart recently showed a cluster of three symmetry projections that came in between 80.75 and 80.84. That is where we watched for the first meaningful resistance to the rally at that time.
The actual high was made directly withing this zone at 80.78 on February 13, which was followed by a healthy decline of nearly $7.
The next decision that I want to watch now is the 77.82-78.11 area. If we test that area and can't clear it, I will look for another sell signal against that zone with the maximum risk above the 78.11 area.


