Anatomy Of A Fibonacci Trade: NQ
 By
By
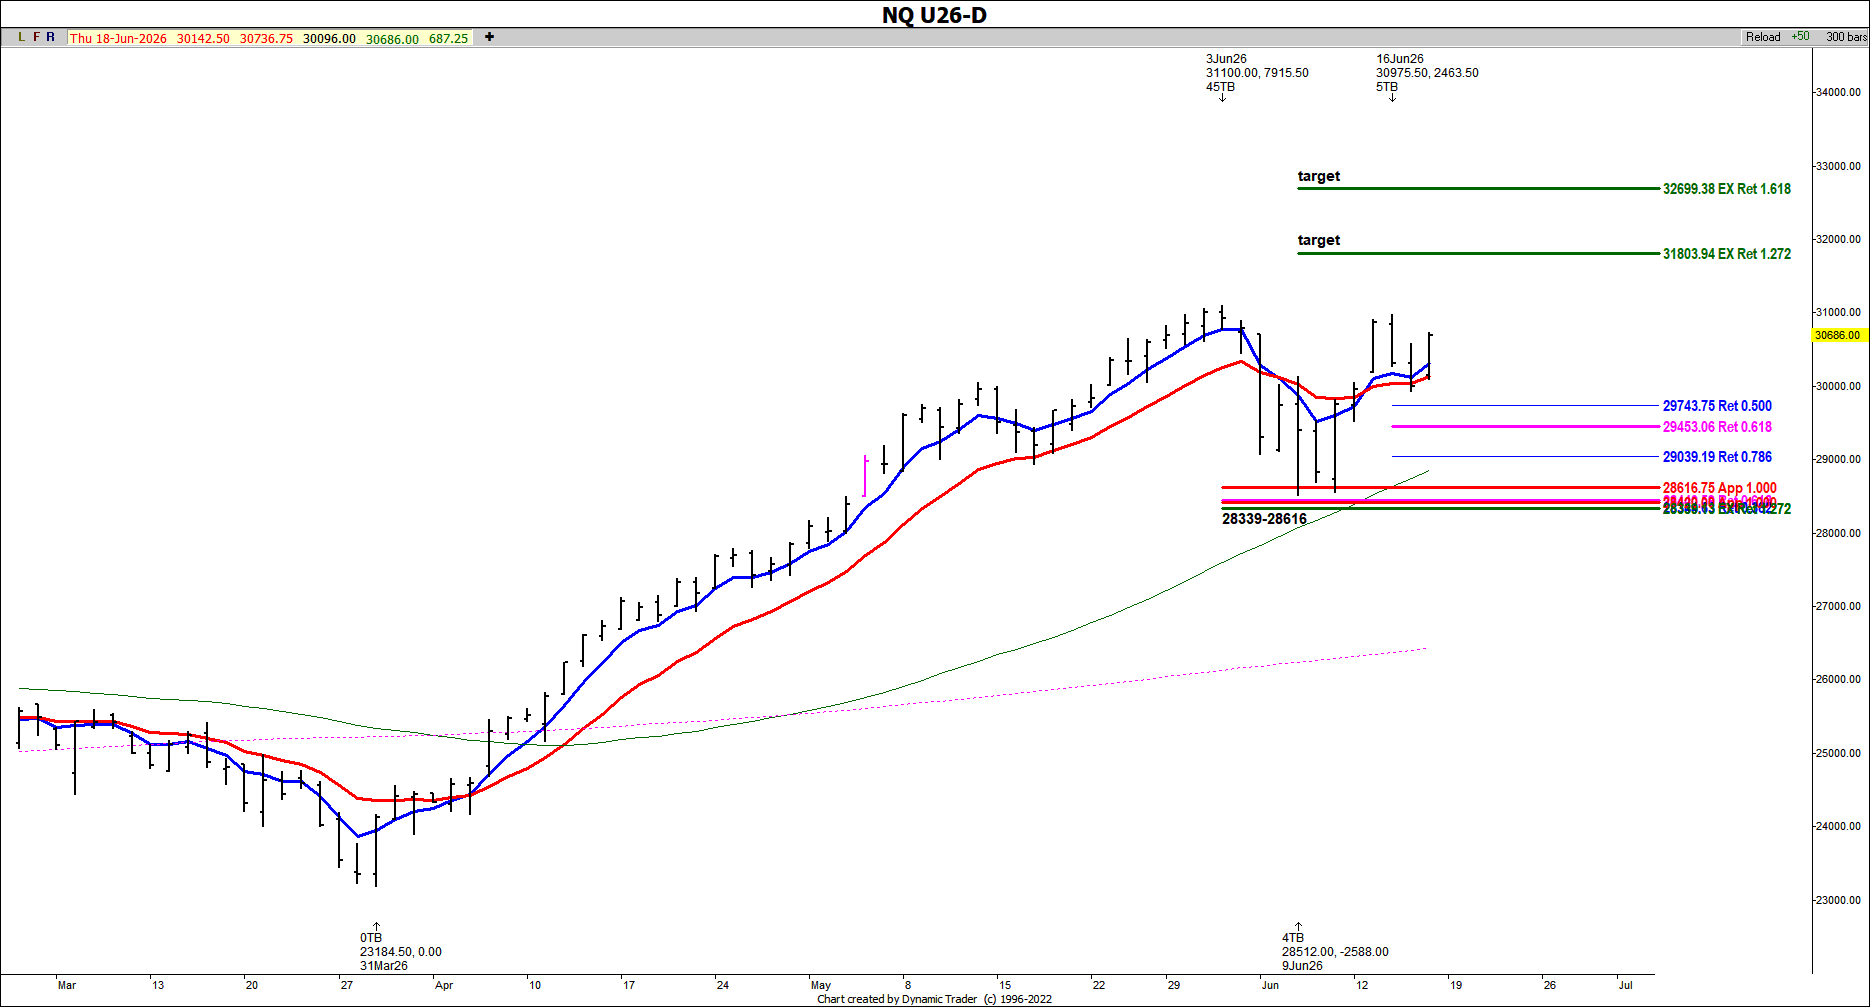
Let's take a look at a setup we saw on June 9th in NQ futures. We had a relatively wide zone of support in the 28339-28616 area that was tested in early June. See the NQ daily chart below.
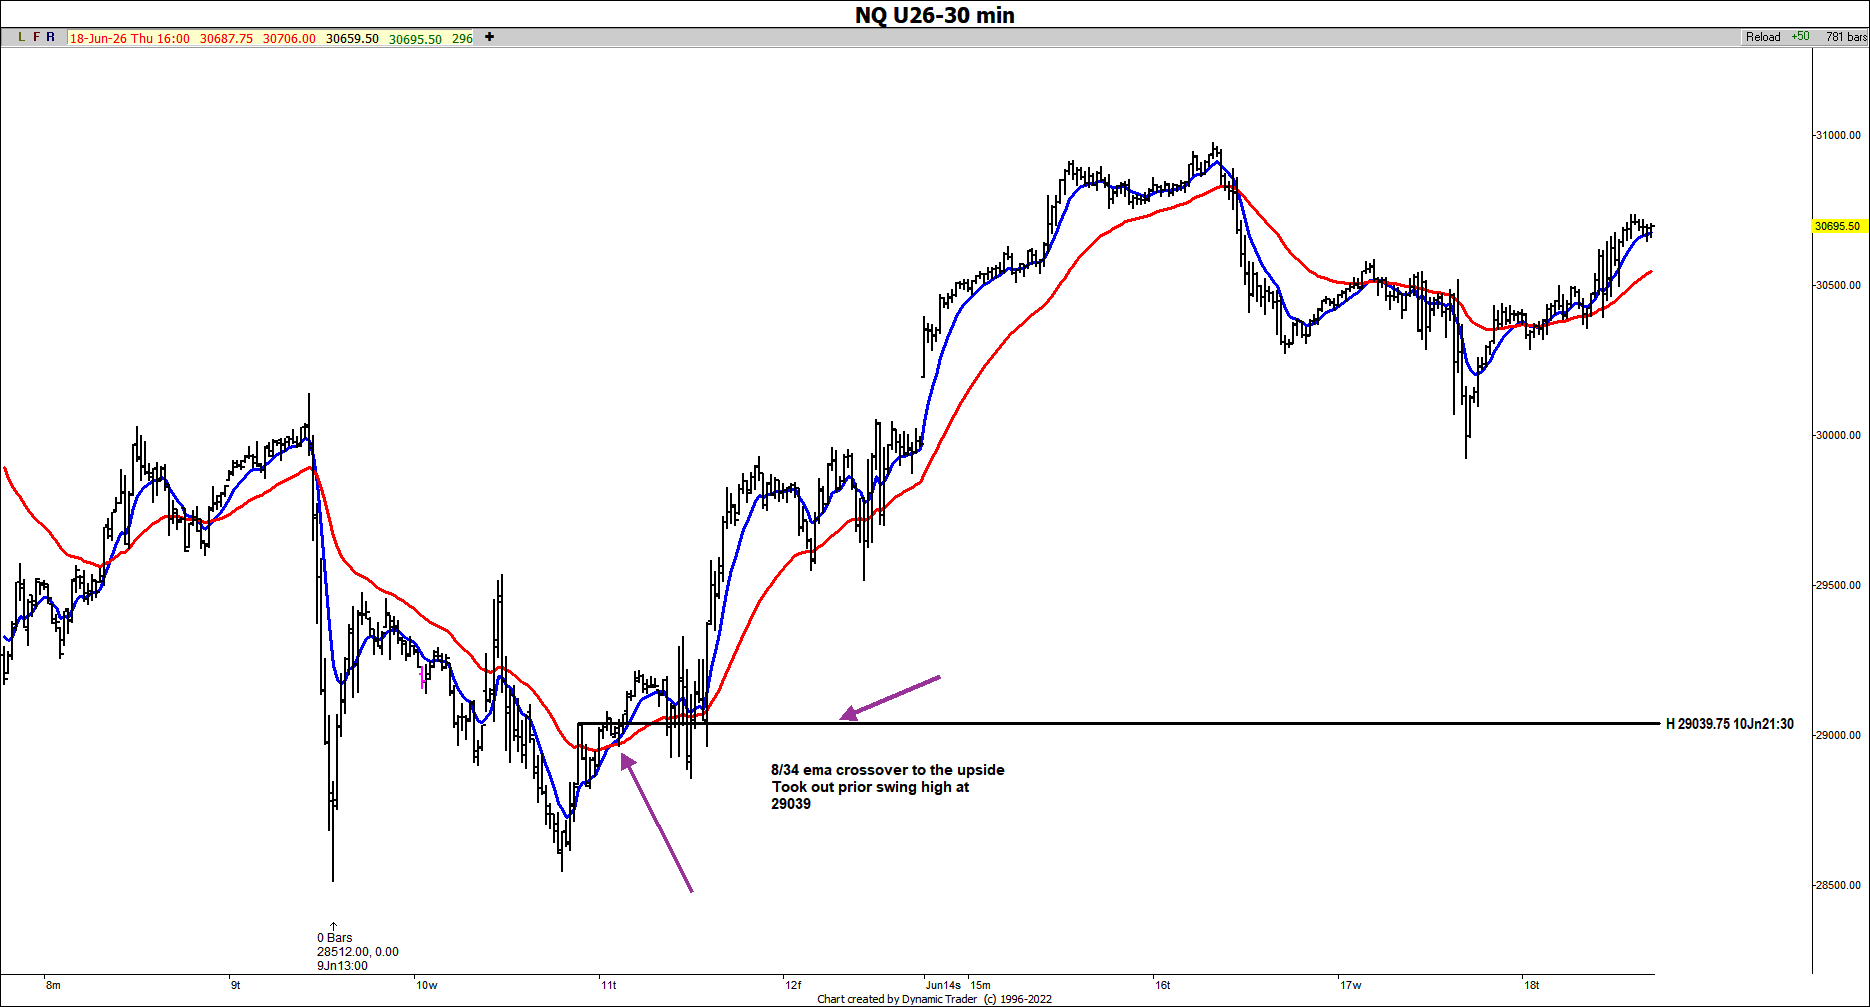
 We you see a zone "hold" (essentially remain above or into this zone), this is when you want to start watching for buy triggers against this zone. For a swing trade entry I like to focus on the 30-minute chart with the 8/34 ema crossover and taking out a prior swing high for the trigger. Note that on the 30-minute chart we had such a trigger on June 11th, taking out the prior swing high at 29039.
 The initial rally was to the 30975 area from this zone. There is still potential for us to see an upside target met around the 31803 area, so now we will look for new setups on the lower time frame charts that may eventually take us to much higher levels. The initial MAX risk definition could be been defined under the June 9th low, though you could use a tighter stop. Many of my subscribers have been using options strategies to keep the risk relatively low.
