What is Fibonacci Pinball And How Did It Predict The Trump Rally?
If you are like most in the market, you probably believed Hillary was going to win the presidential election in November, that the stock market would rally because of it, and that gold would tank. And, you were also told that if Trump was able to pull off a win, then the market would tank and gold would skyrocket. These perspectives were solidly based in various fundamental perspectives which dictated these market expectations.However, what occurred in the real world was drastically different than what was expected. Well, that is, from what was expected by most. You see, our sentiment analysts was looking for a stock market rally and drop in gold (to our bottoming target) no matter who won. Yes, you heard me right.
The Importance of Sentiment
You see, markets are not driven by the substance of news or exogenous events. Many social experiments have been conducted over the last 30 years which proves this to be true, despite the public’s belief to the contrary. And, as these experiments have proven, what does control market direction is something we term “market sentiment” or “social mood.”
The prevailing social mood or market sentiment interprets the exogenous events we hear about, and the “spin” applied by the prevailing social mood is what moves the market. If sentiment is positive, then the market will react positively, even if the news is negative, and vice versa. This is why we often see markets go up on bad news and down on good news, and it makes so many scratch their head, especially if they are looking to “logic” in the markets or if they are looking for their directional cues from the substance of the news or fundamentals. And, this is why so many were looking the wrong way when Trump won the election.
Market sentiment for equities was clearly suggesting we were heading higher in early November no matter who won the election, as well as pointing down for gold to our bottoming target.
Measuring Sentiment Through Mathematical Analysis
How does Elliott Wave analysis measure market sentiment, and what does “Fibonacci Pinball” have to do with any of this?
The answer begins with an understanding of a mathematical principle called “Phi.”
In 1228, Leonardo Fibonacci da Pisa published his monumental work entitled Liber Abaci, in which he “rediscovered” what is commonly known today as the Fibonacci sequence of numbers: 1, 1, 2, 3, 5, 8, 13, 21, 34, 55, 89, 144, etc. Within this sequence, each higher number is the sum of the prior two numbers, and the ratio of any two consecutive numbers approximates 1.618 or its inverse, .618. The higher you move through the sequence, the closer you move towards the 1.618/.618 relationship. This .618 number has been referred to as the “Golden Mean” throughout history. We also refer to this number as Phi.
There is significant evidence, based upon recent studies, that behavior and decision making within a herd and on an individual basis display mathematically driven distributions based on Phi. This basically means that mass decision making will move forward and move backward based upon mathematical relationships within their movements. This is the same mathematical basis with which nature is governed. The same laws that were set in place for nature also govern man’s decision making, en masse, and on an individual basis.
Elliott Wave’s Use of Fibs to Predict Markets
In Elliott Wave analysis, we use ratios based upon Phi the Fibonacci ratio of 1.618 and its inverse .618, among other ratios, to predict the progression and regression of stock prices.
Below is an example of a classic 5-wave market advance. As you’ll see, each up-wave has 5 sub-waves within it, and each down-wave has 3 sub-waves, with each sub-wave having a specific Phi-derived target.
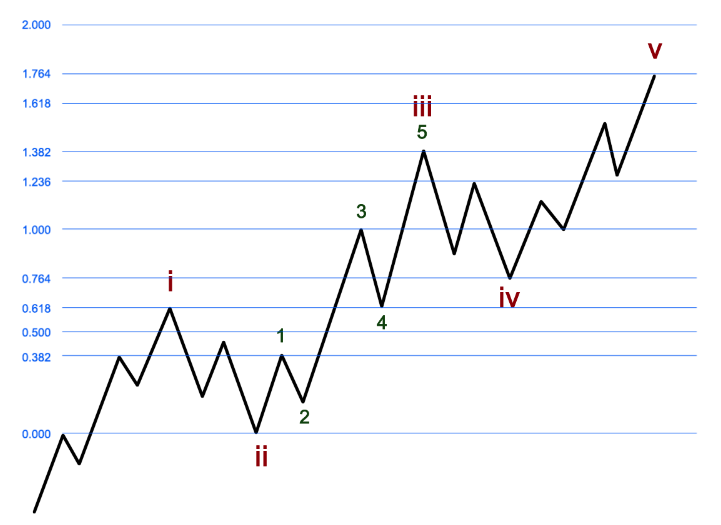
Once the first two waves (i and ii on the chart) are complete, the sub-waves of the following three waves become relatively easy to prognosticate, as they advance or decline based on Fibonacci extensions that are calculated based on the length of the first two waves.
We call this phenomenon, in which we can more reliably predict the sub-waves starting in the 3rd wave … Fibonacci Pinball.
Essentially, like a caroming pinball, price takes off in a classic 3rd wave, zigzagging in five relatively predictable sub-waves. The relative predictability continues into the 4th and 5th waves.
We used Fibonacci Pinball in predicting the Trump Rally.
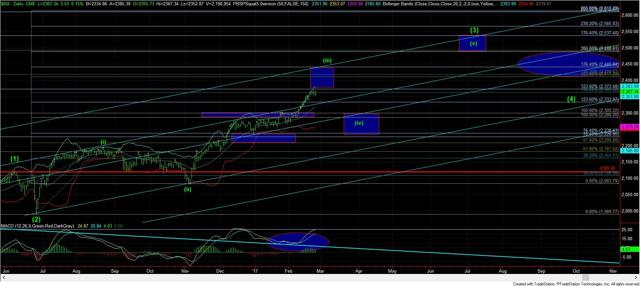
The simple truth was that the market was in the heart of what us Elliotticians call a “3rd wave”, and they are relentless and the most powerful segment of a 5-wave Elliott structure. In fact, we have been within the heart of a 3rd wave since early November when we went against the common “market-think” and called for a strong rally to 2300 and beyond, even though Trump won the election.
On Saturday, November 5, the same day Barron’s predicted a 10% sell-off should Trump win the following Tuesday, we wrote: “I would not expect a larger downside move to occur from here if our expectations are correct. Once the market moves strongly through the 2098SPX level, and is able to continue through 2125SPX, that is our initial indication that we could have a long-term low in place, and finally begin our run to 2350SPX next.”
The S&P 500 blew through 2098 the very next session, on Monday November 7, and has hardly looked back since. It surpassed our 2350 target in mid-February, came down into mid-April, just as we anticipated on the chart below (from February 25), and proceeded to rally into late July, reaching the lower end of our target (in the 2480’s on the SPX) as of the time this article was written.
As for gold, we also wrote on Nov 5: “Normally, based upon our Fibonacci Pinball perspective, the wave (4) of iii pullback ‘should’ not break below the .618 extension, which was at the 25 level. And, since we broke that level, this is a warning to me….As long as the GDX maintains below 25.47, there is a downside set up in place. In order to follow through on this immediate downside set up, we need to break below 24.42, and follow through below 23.90.”
The metals broke down the next session (Monday) and bottomed below 19 in the GDX in late December, right in our bottoming target region.
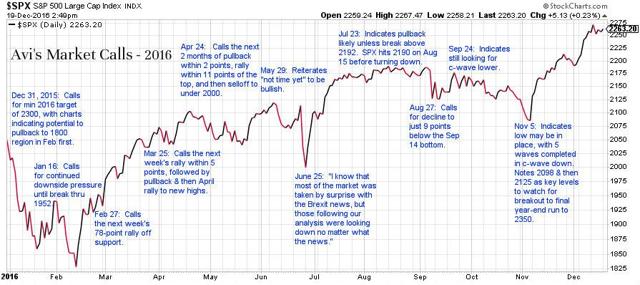
Our call for a post-election rally in the S&P 500 was actually one of many correct market calls in 2016. All year long, we were noting that the market was set up to rally in 2016, with a minimum target of 2300, even while many were still looking for that elusive stock market crash. Our expectations for a rally did not care about Brexit, who won the US election, the referendum in Italy, interest rate hikes, terrorist attacks, or any other exogenous event ... and it seems that neither did the market. The set-up for this move -- based on Elliott Wave & Fibonacci Pinball analysis -- had been in place for some time, with the market providing some twists and turns along the way, most of which we were able to identify before they occurred throughout the year.