S&P 500 in the Support Zone
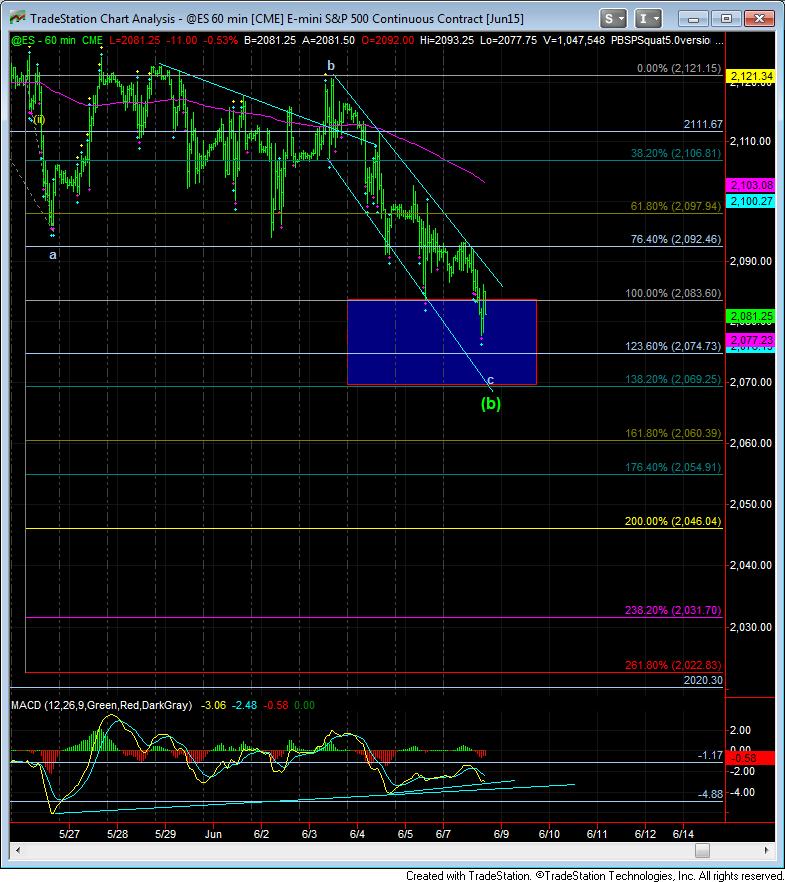
With the S&P 500 (SPX) breaking below Friday’s low of 2085.67 on Monday, the index gave us a strong indication that it wanted to drop even further to our secondary support level at 2072. The question is: Will it go even lower than that, or should we expect it to bounce off support?
We analyze the market in terms of Elliott Wave theory, in which the market moves in five waves in the direction of the trend and three waves in a countertrend direction. In its current channel down, it appears the S&P 500 is in the third (and last) wave of a countertrend, or corrective, decline.
We believe this to be the case because this current downwave is weaker than the one that proceded it.
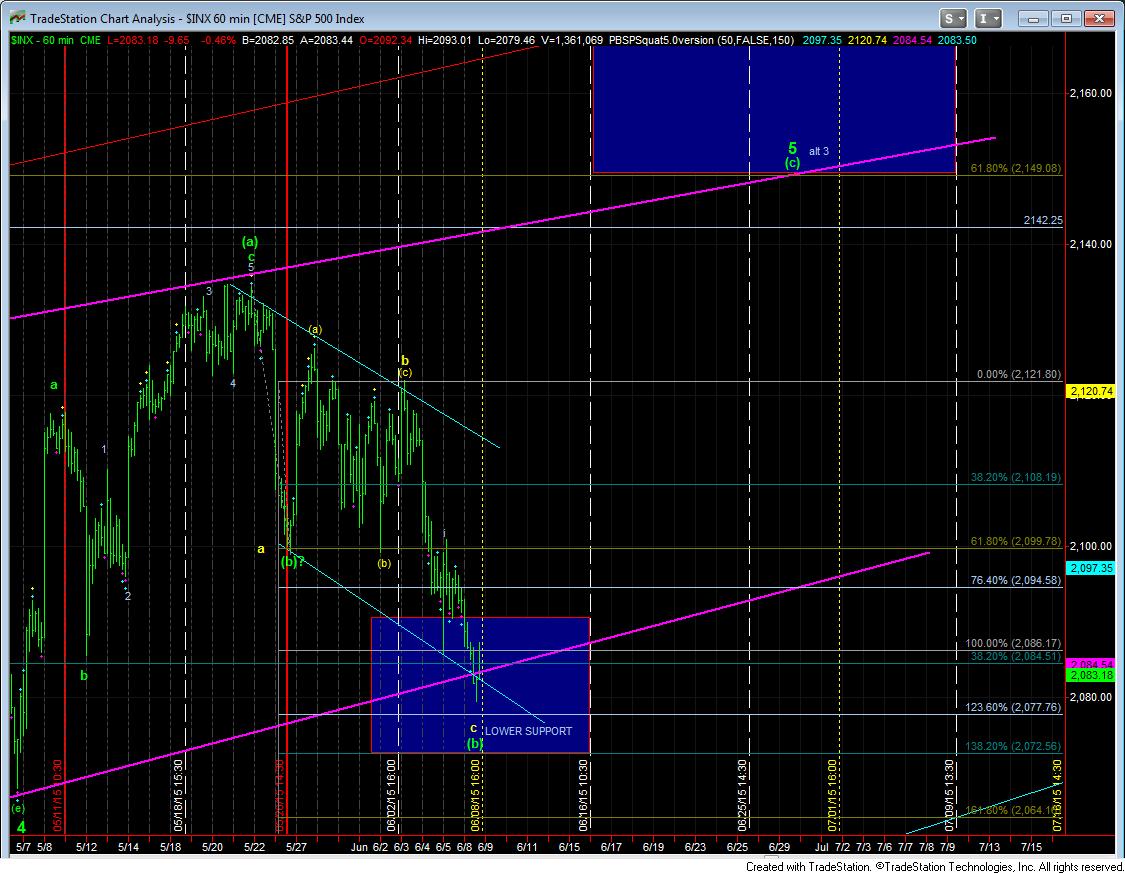
However, even though it is a corrective pullback, the market can continue lower and lower, until it provides evidence that it has finally turned. Clearly, we would need to see the market break out of the downtrend channel it has been in for the last four trading days. And, ideally, we want to see the market break out of that channel in an impulsive fashion -- with 5 waves off the low -- to signal that we are on our way to the 2150 target box on our chart.
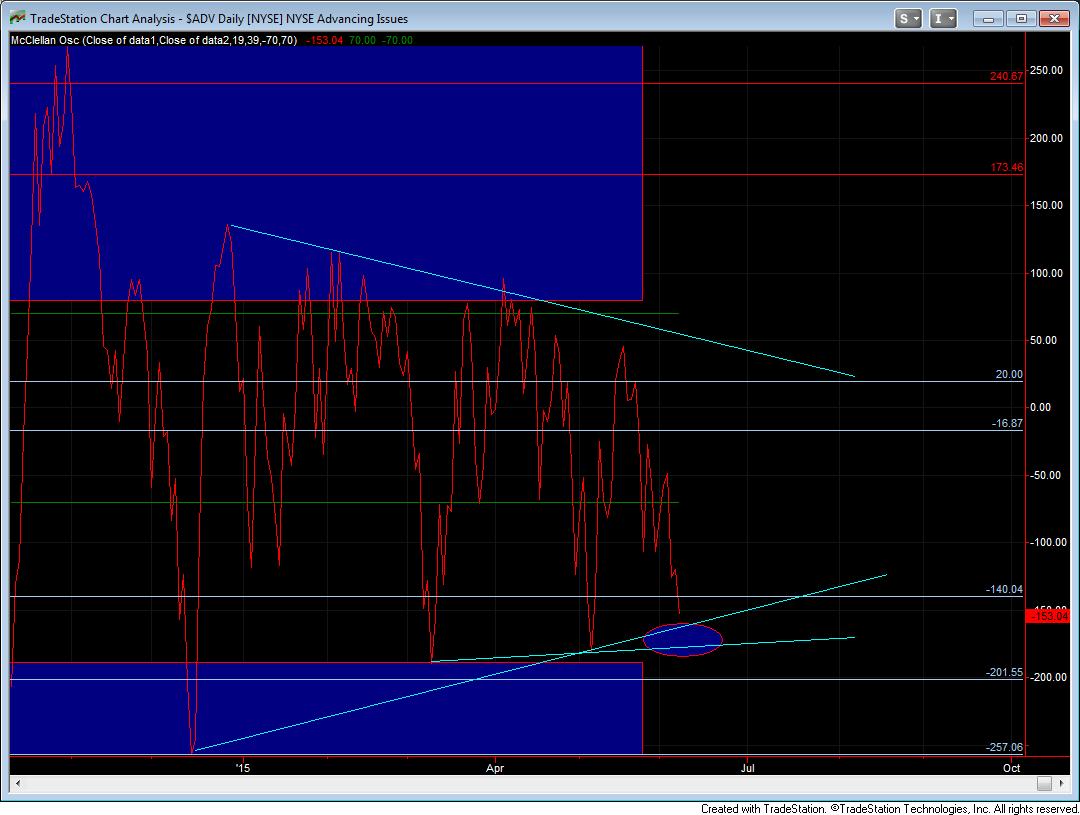
The other indication that we have been following is the McClellan Oscillator, which is now clearly at support. Ideally, we would want to see support held, and the market breaking out to the upside out of its current triangle pattern.
I would also like to remind you that today is a Bradley model turn date. Therefore, it is yet another clue I am considering as I looking for a potential low in this region of the market.
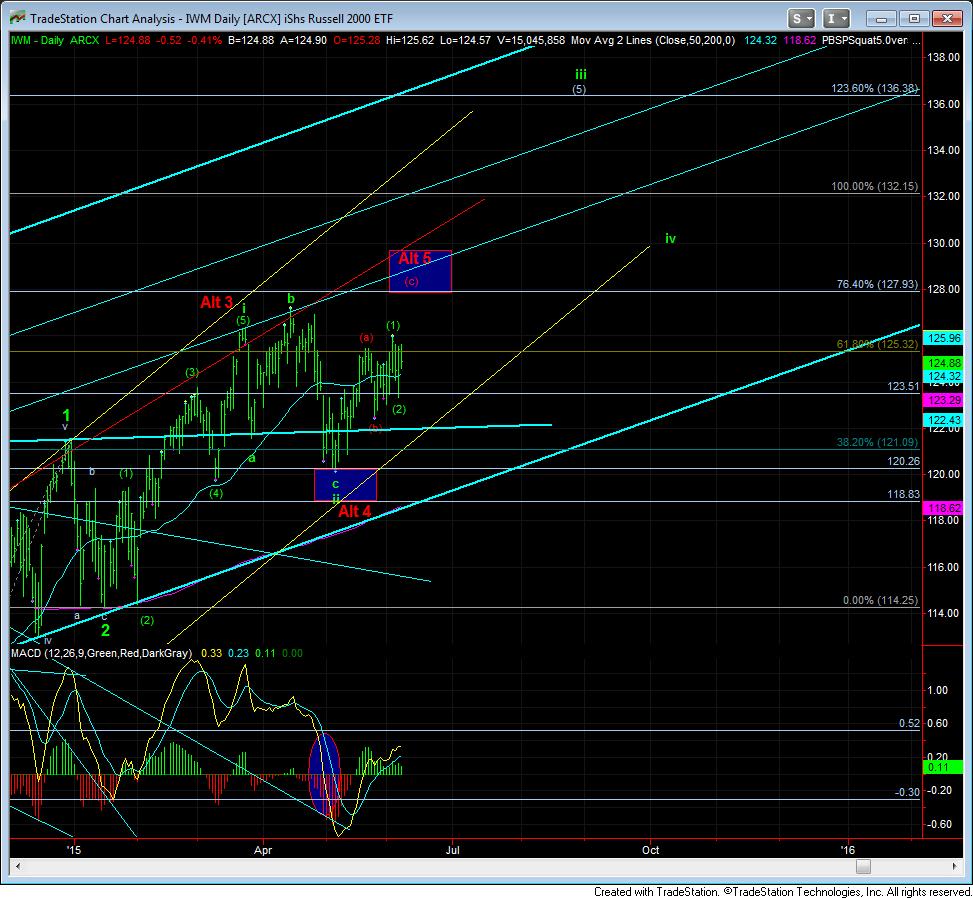
Lastly, while I have noted that the SPX should not break the 2065/70 region of support for me to remain bullish for at least one more high, the iShares Russell 2000 ETF (IWM) has remained quite bullish in its own right. Therefore, as I have mentioned before, not only will I need to see the SPX break support for me to suggest that we have finally topped and begin looking to the 1800 region, I will need to see the IWM confirm that it has also broken its support below 120.25.