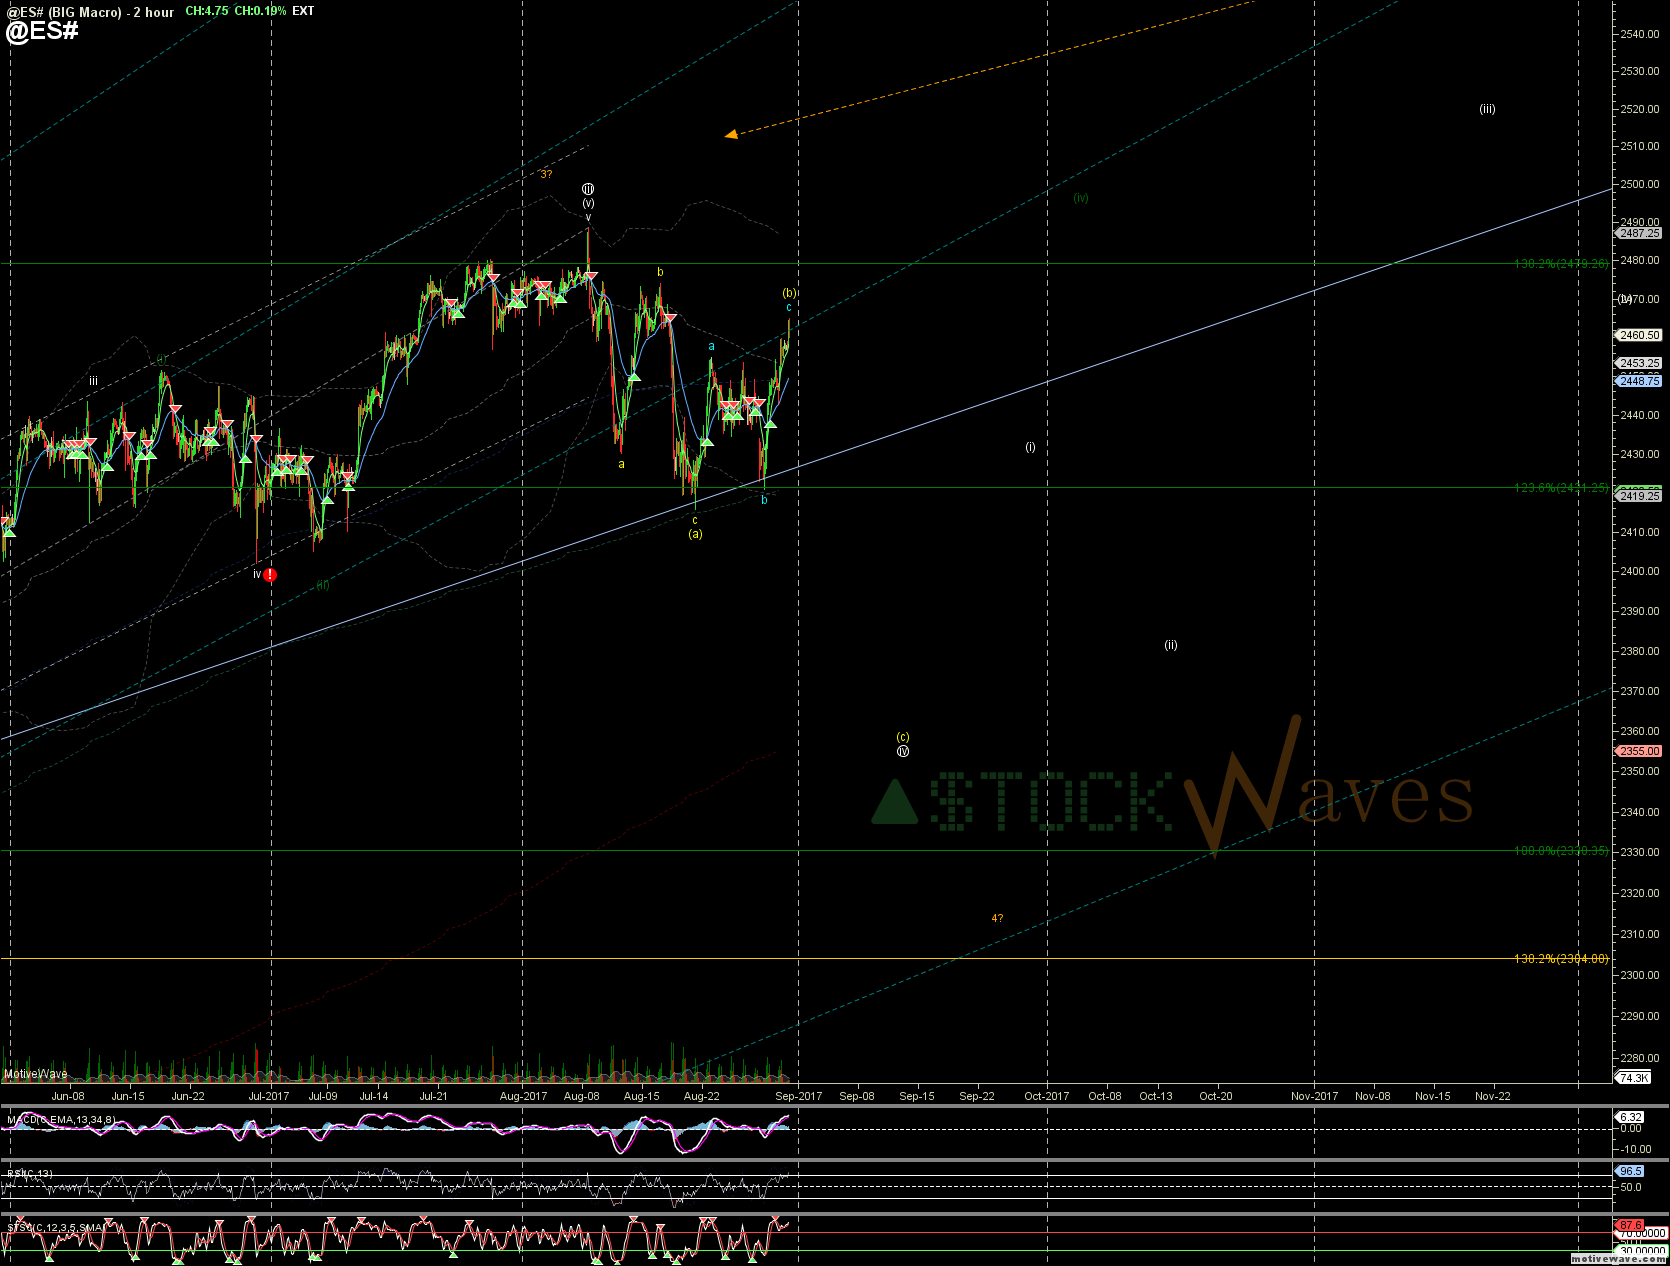
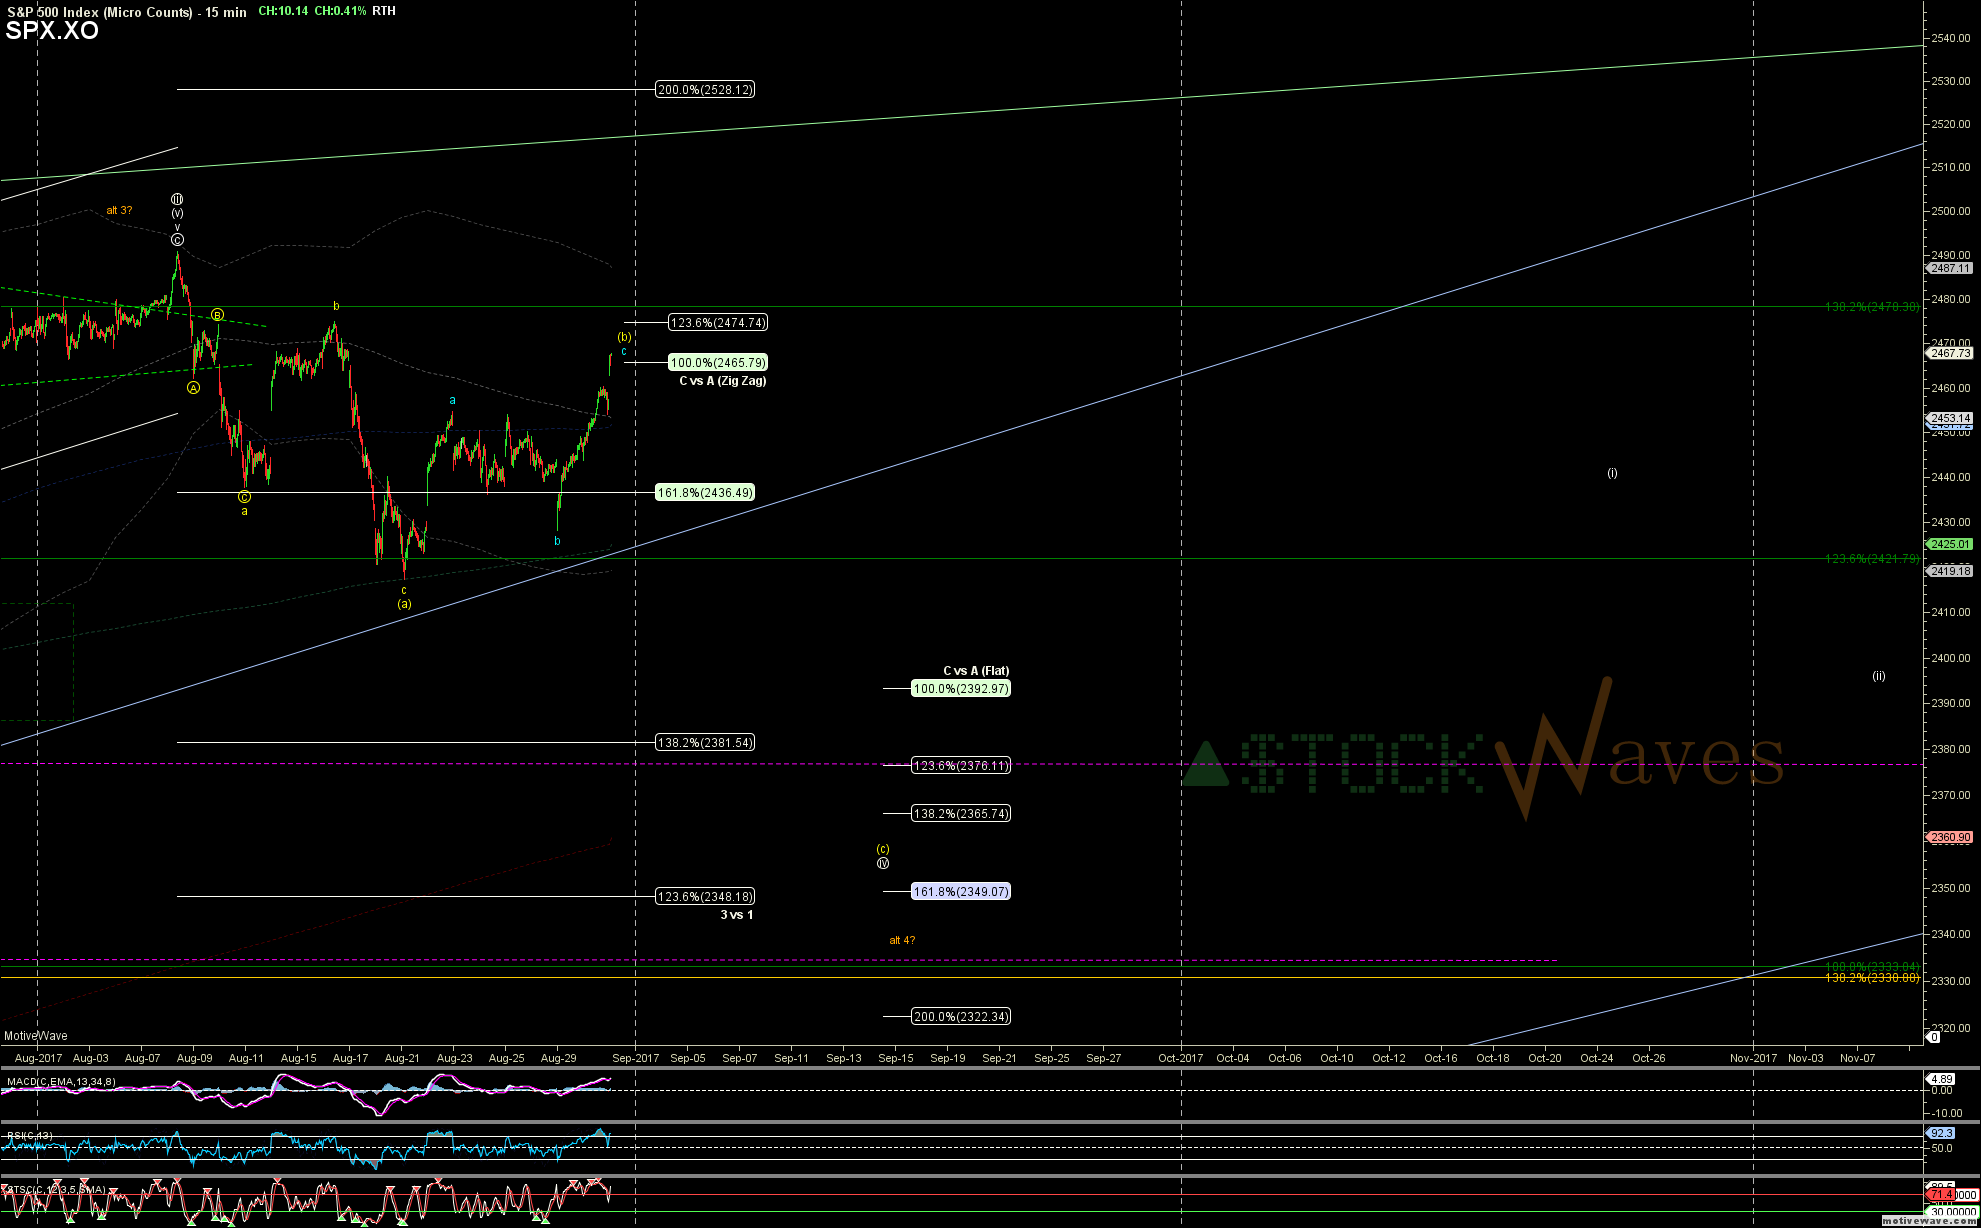
Market setup for more short-term downside
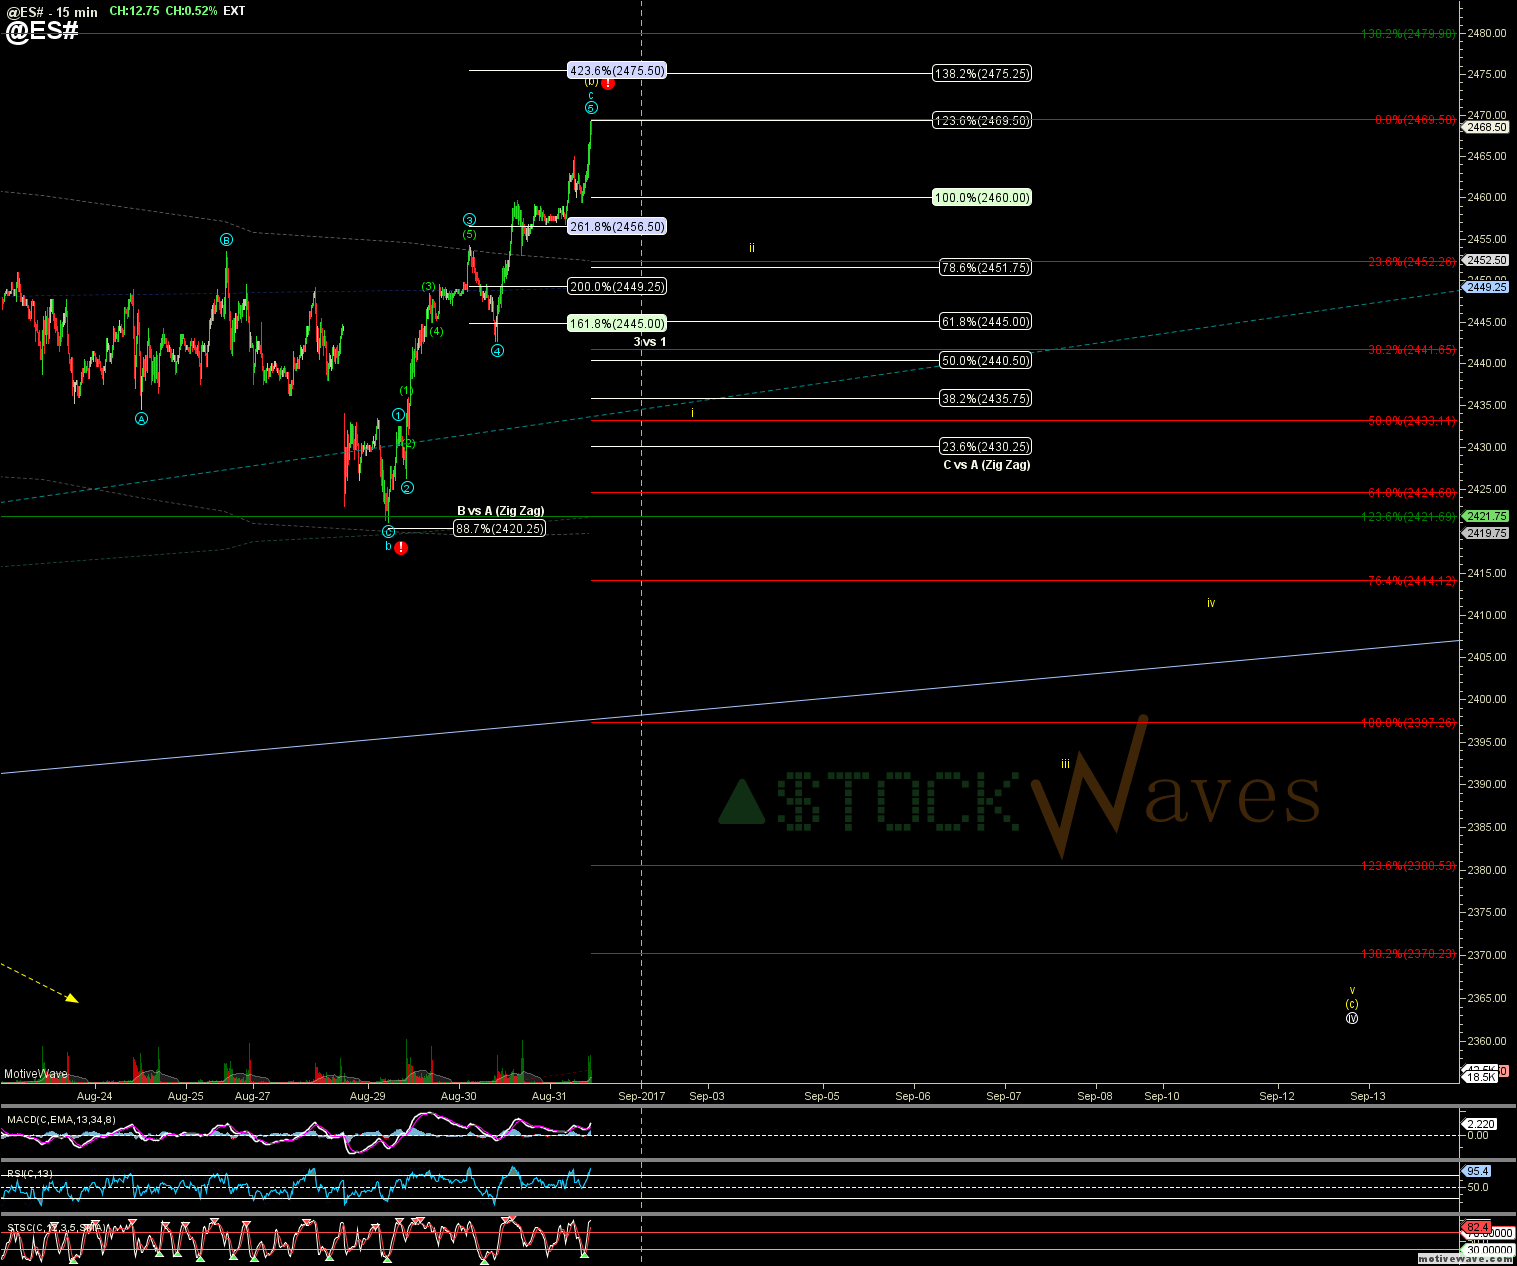
Still room for a bit more extension in the c of (b) and it seems the SPX wanted to tag its 100% of c at 2466 in RTH, but the count looks full and poised to start unfolding in the (c) down on ES/SPX/SPY
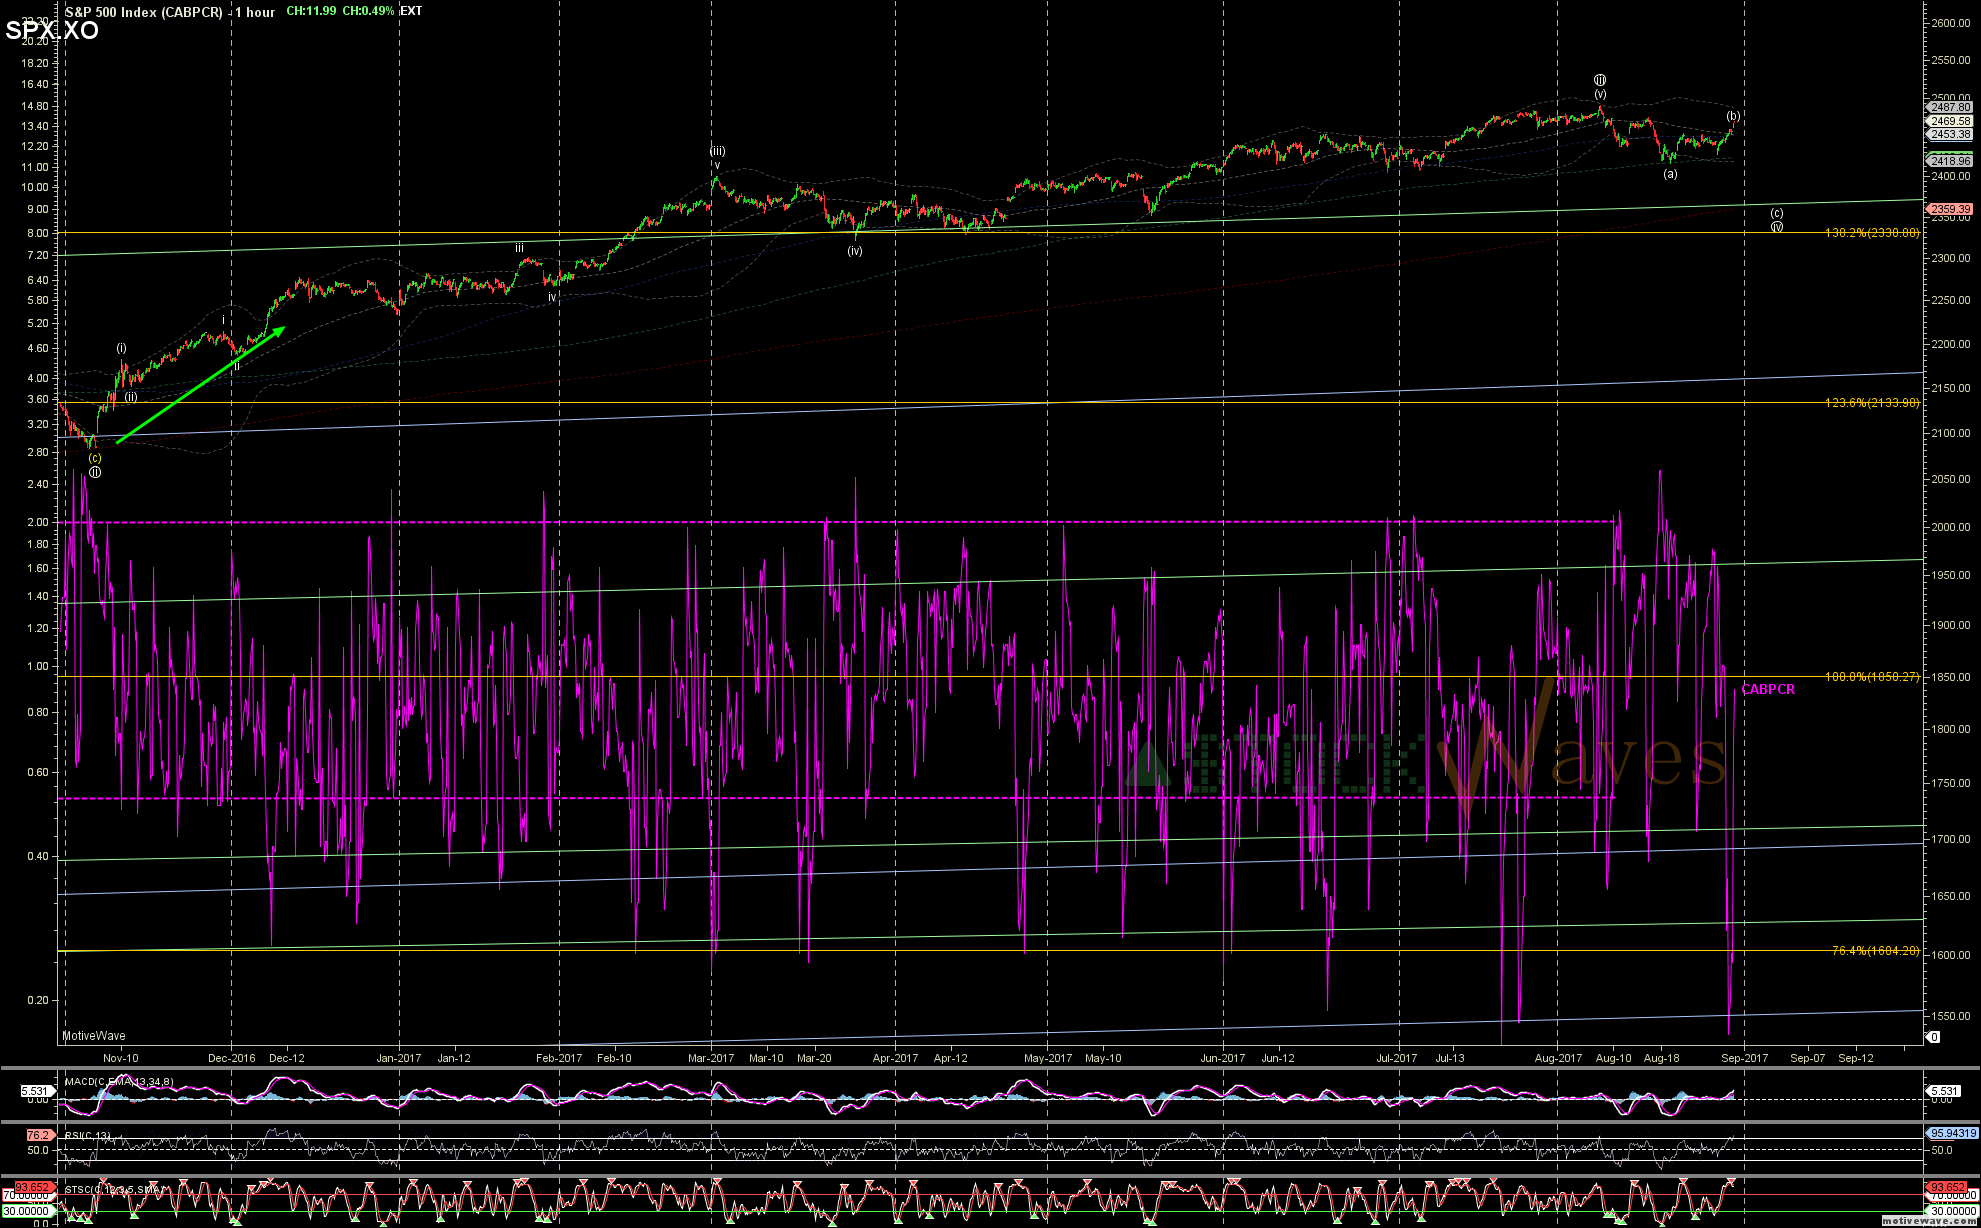
The 2hr & 4hr ES charts now have little red triangles on the Stochastics. Also a (c) down toward the 200MA would likely get the Daily, 3day AND Wkly Stochastics all in sync in the bottoming region. Last times we had that was Feb 2016 and Nov 2016.
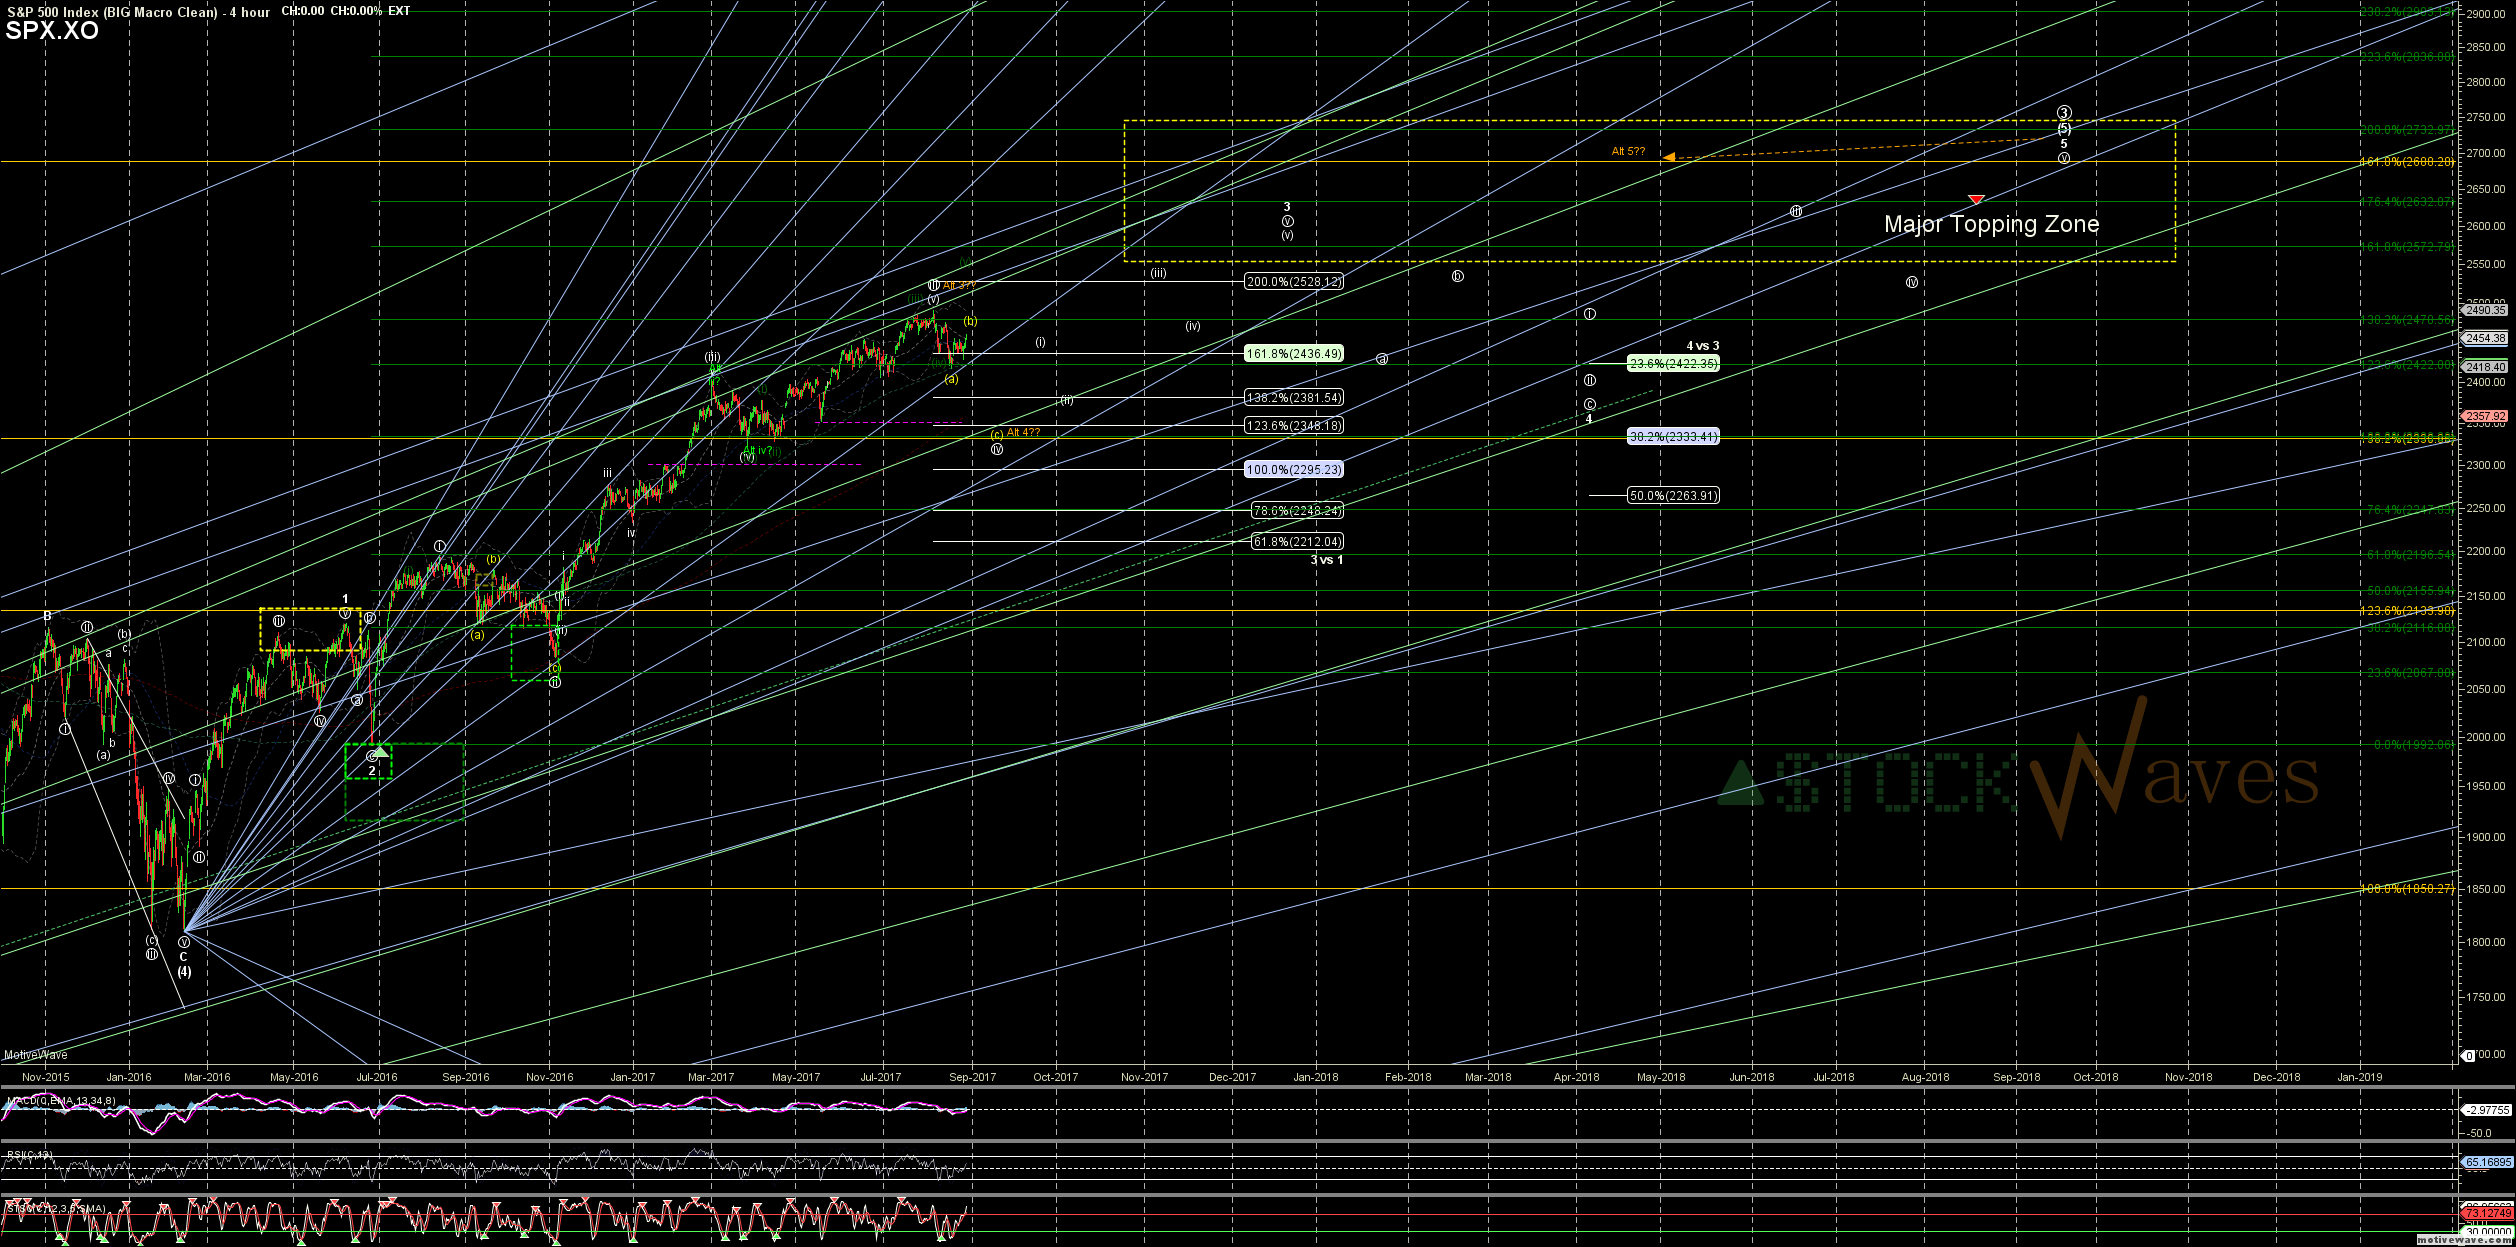
Fractal similarities here both EW pattern and MACD with Dac 2015 though of a smaller degree.
CABPCR just spiked down to an extreme reading of .17 on my hrly and is reversing hard.
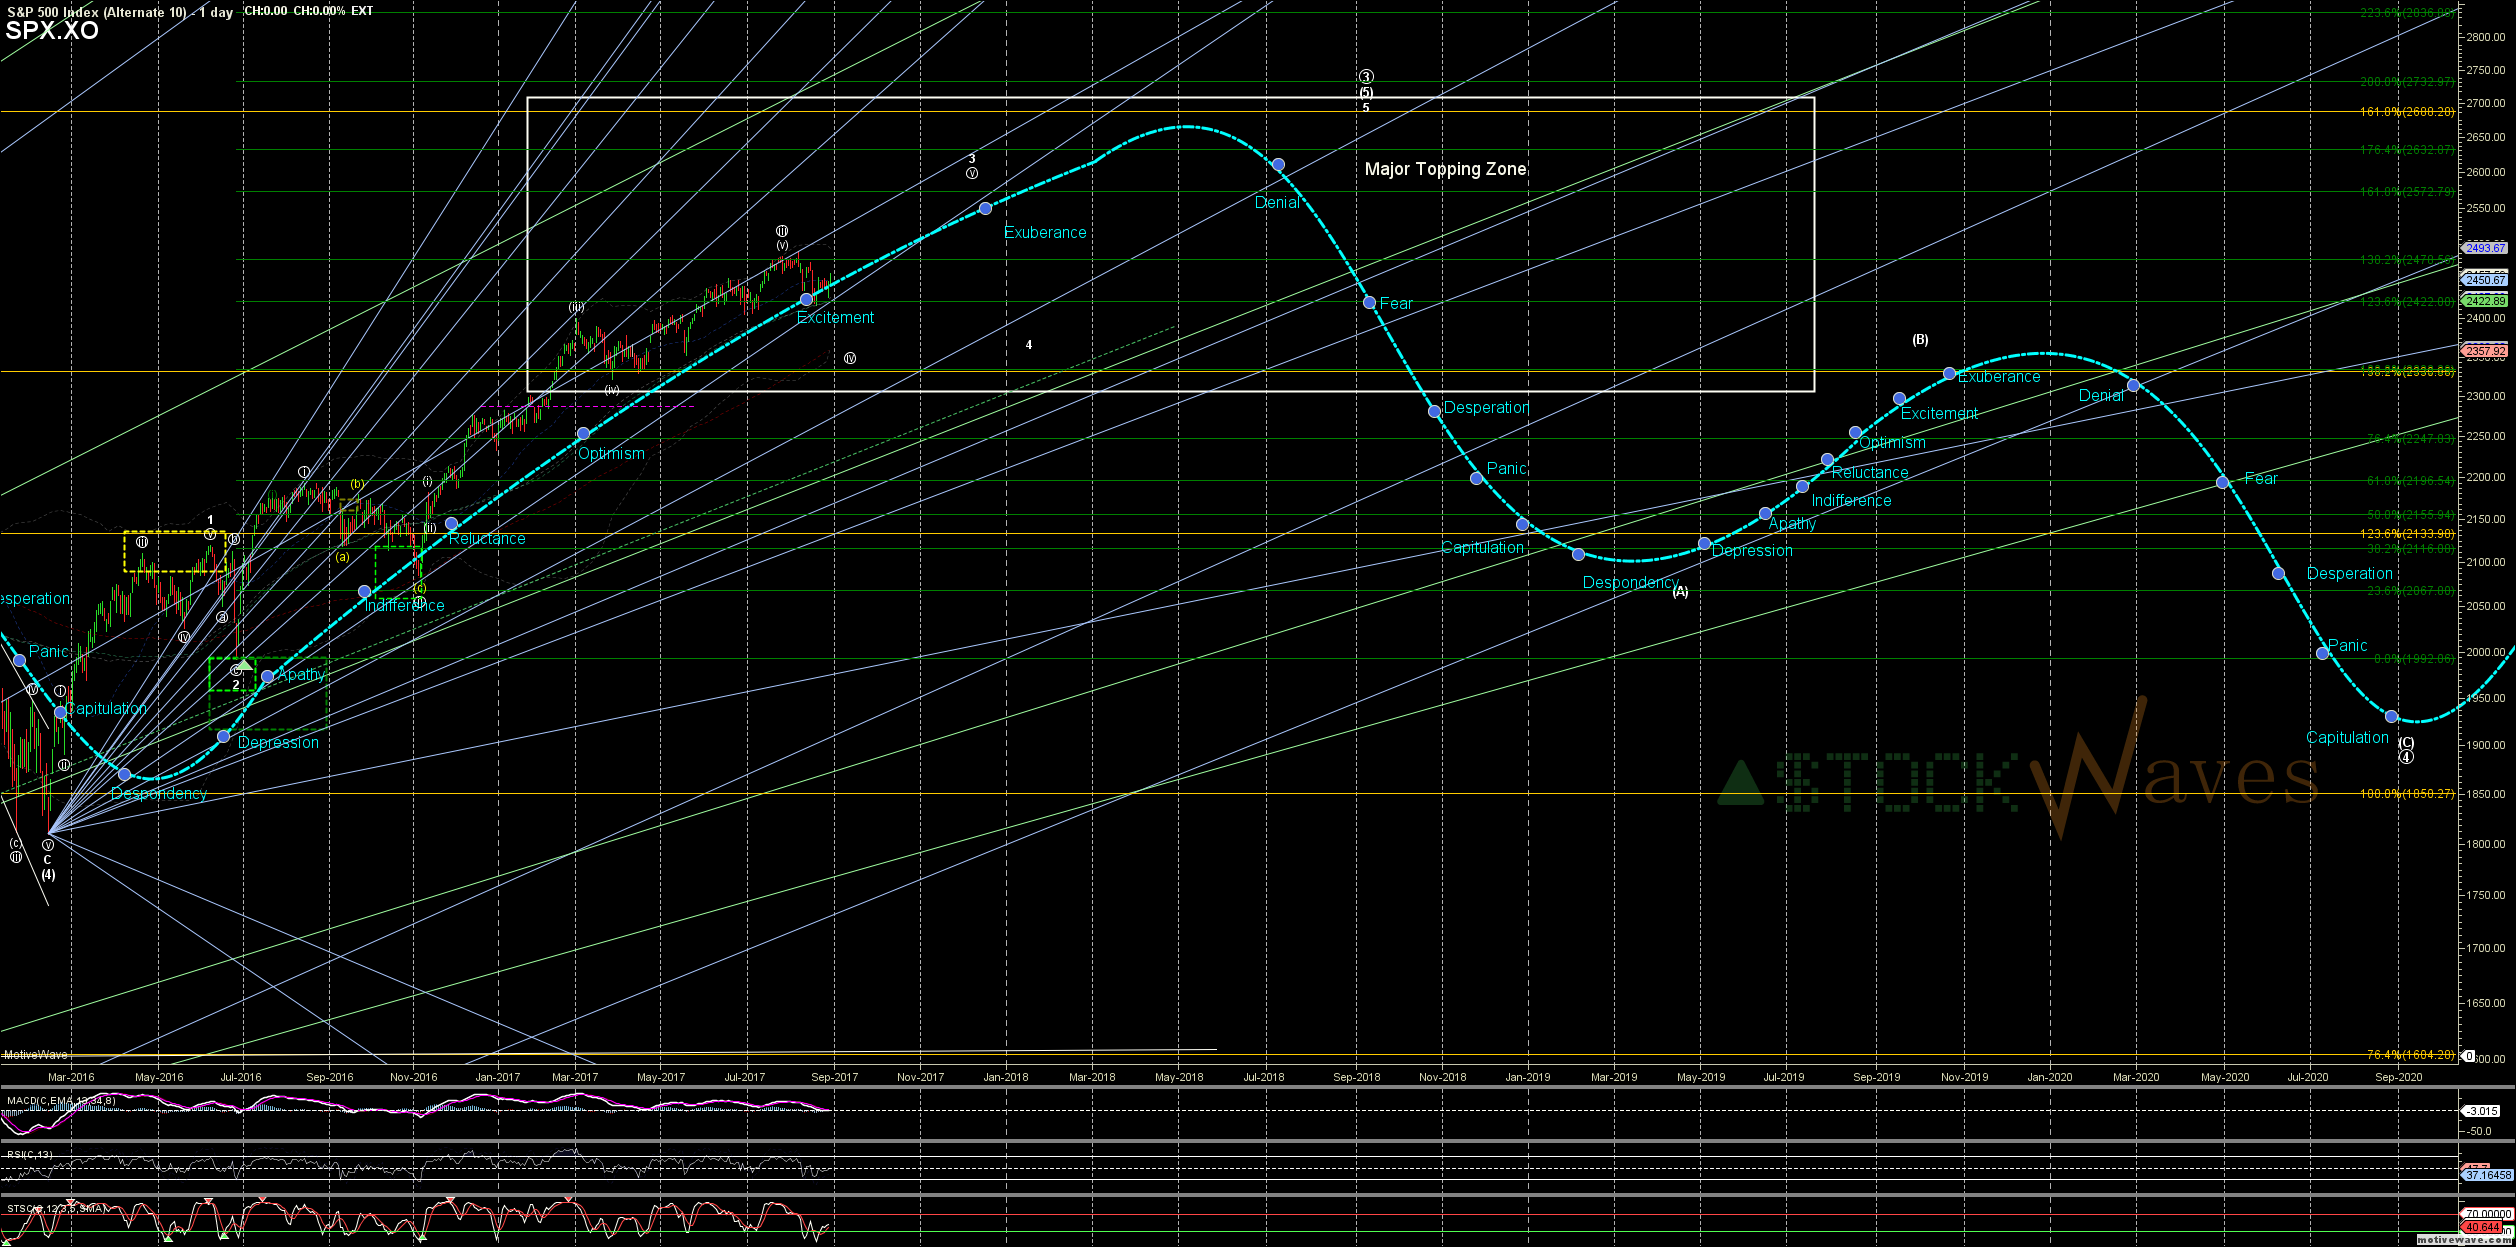
We still have more of the "peak excitement" to burn off...
Support for a (c) wave extends from 2390-2330 but the 200MA and 138.2% extension of (c) line up for nice confluence in the 2360 region.