Charts on EBAY & GDX
Broad market counts suggest that the move off the October low is nearing its end, causing me to be a lot more conservative with respect to the long setups that I take on. However, a variety of micro charts paint a more bullish picture. I will continue to be looking for short setups to complement the longs, however, should very clean bottoming setups emerge, I will consider playing those long setups as well. I have a long bias into July, potentially stretching out to September.
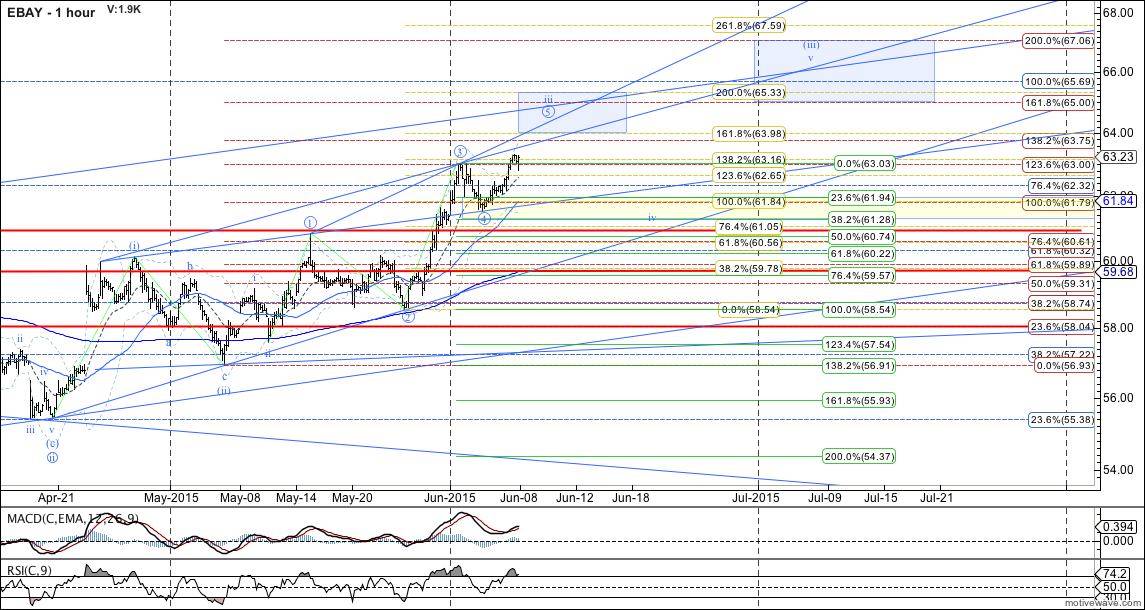
After breaking out, EBAY pulled back to the 61-handle support area, allowing me to unwind the puts entered into at resistance, which was just in time, as EBAY reversed to push to new highs, despite a week tape. At this point, it is likely that wave (iii) of circle-iii will reach at least the 1.618 extension of wave (i) at 65.00 (red fibs). I will consider reducing risk at that time. Conversely, further pullbacks to 61 handle will have me consider adding to the long side of the trade.
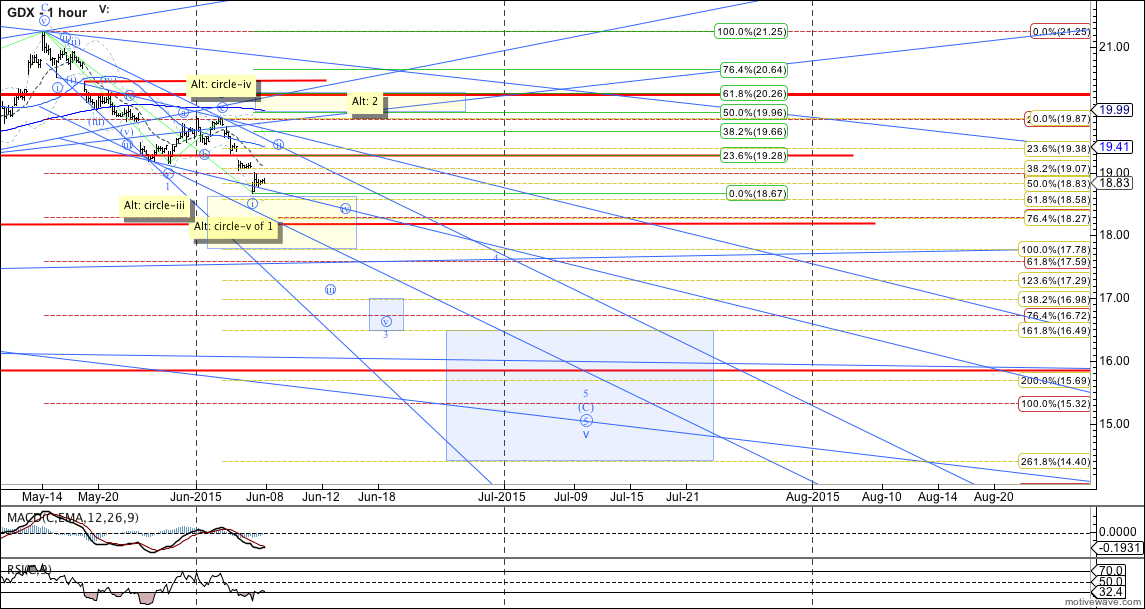
With GDX showing signs of bottoming at around the 19.0 support that I've been mentioning for several weeks, I reduced risk in the trade last week, by unwinding a portion of the trade. At this time, two main routes that I'm seeing are that GDX has either already started wave 3 down (labeled as base case), or it has just completed wave 1 and will yet see a wave 2 bounce, before heading to lower levels (Alt).
Base case remains valid for as long as GDX maintains below 19.87, though ideally it will hold the declining top resistance, currently ~19.55, in its wave circle-ii of 3 bounce. Alt count would likely see a breach of 19.87, with standard retrace for 2 pointing to 19.96-20.26. Should such bounce back towards 20 be seen, I will look to add back the portion that I took off. Targets remain unchanged, with ideal target of 15.32-15.69, and a target range of 14.40-16.49.