Charts on Bitcoin, Ripple, Ethereum & Verge
Below are descriptions of the 6 cryptocurrency charts presented on this page:
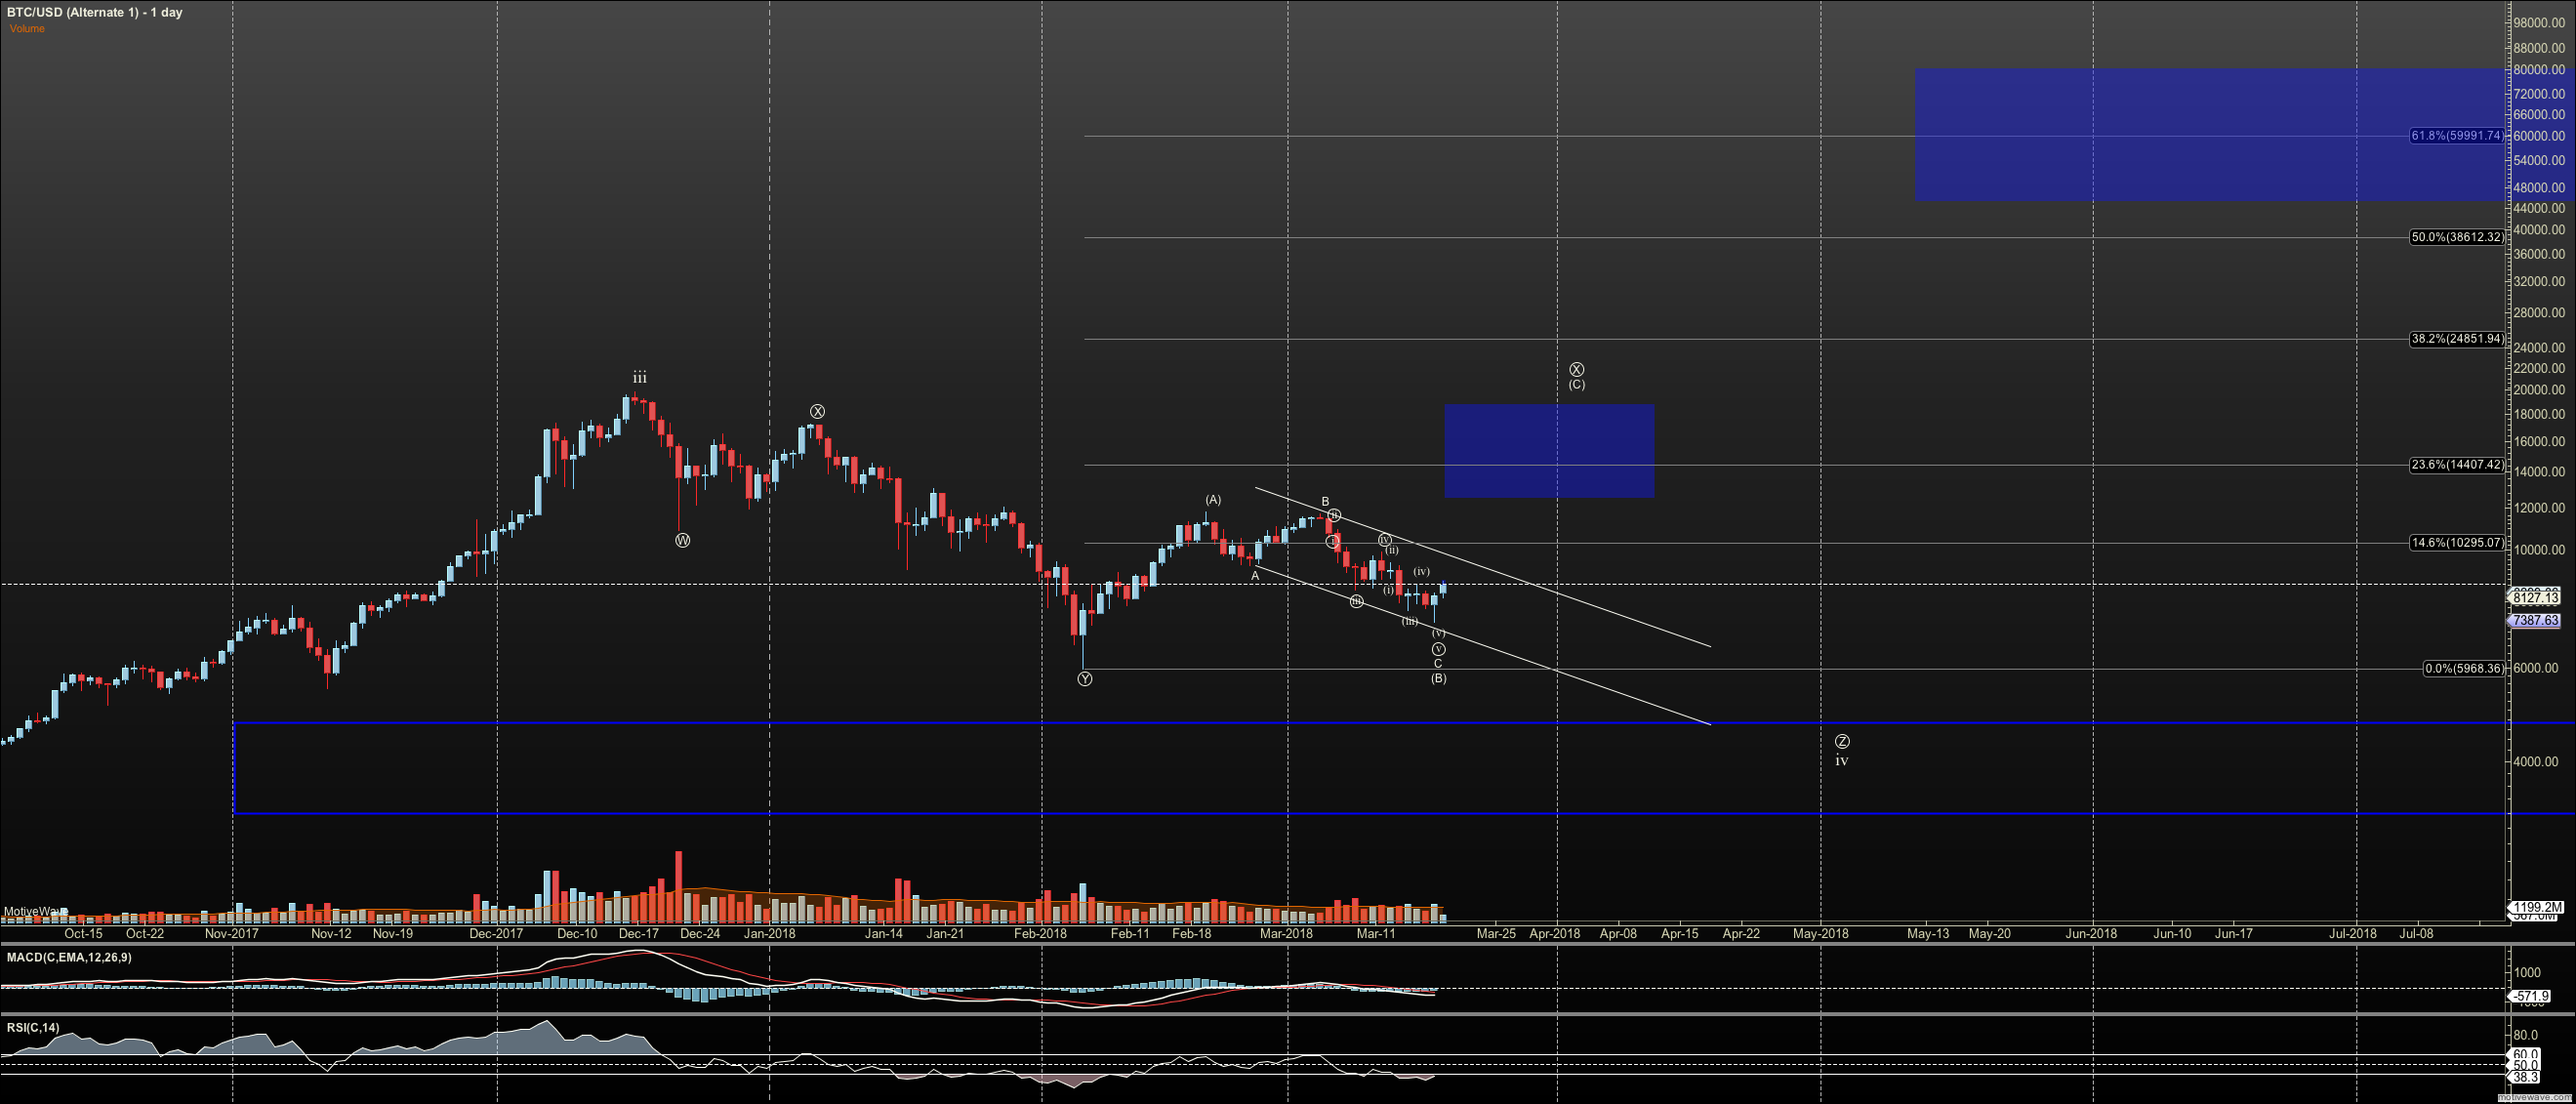
Bitcoin: At the time of writing we have the potential of a local bottom. It is our belief that this local bottom is the c of b of a larger B wave in this correction. This is the best explanation for what we have now, with three waves up and three waves down. We now expect a five wave C wave to complete this larger B wave. We have little confidence that we will see Bitcoin push higher than $18,775 before a larger C wave down takes hold. If the price moves over $18,775, then we’ll reconsider our thesis.
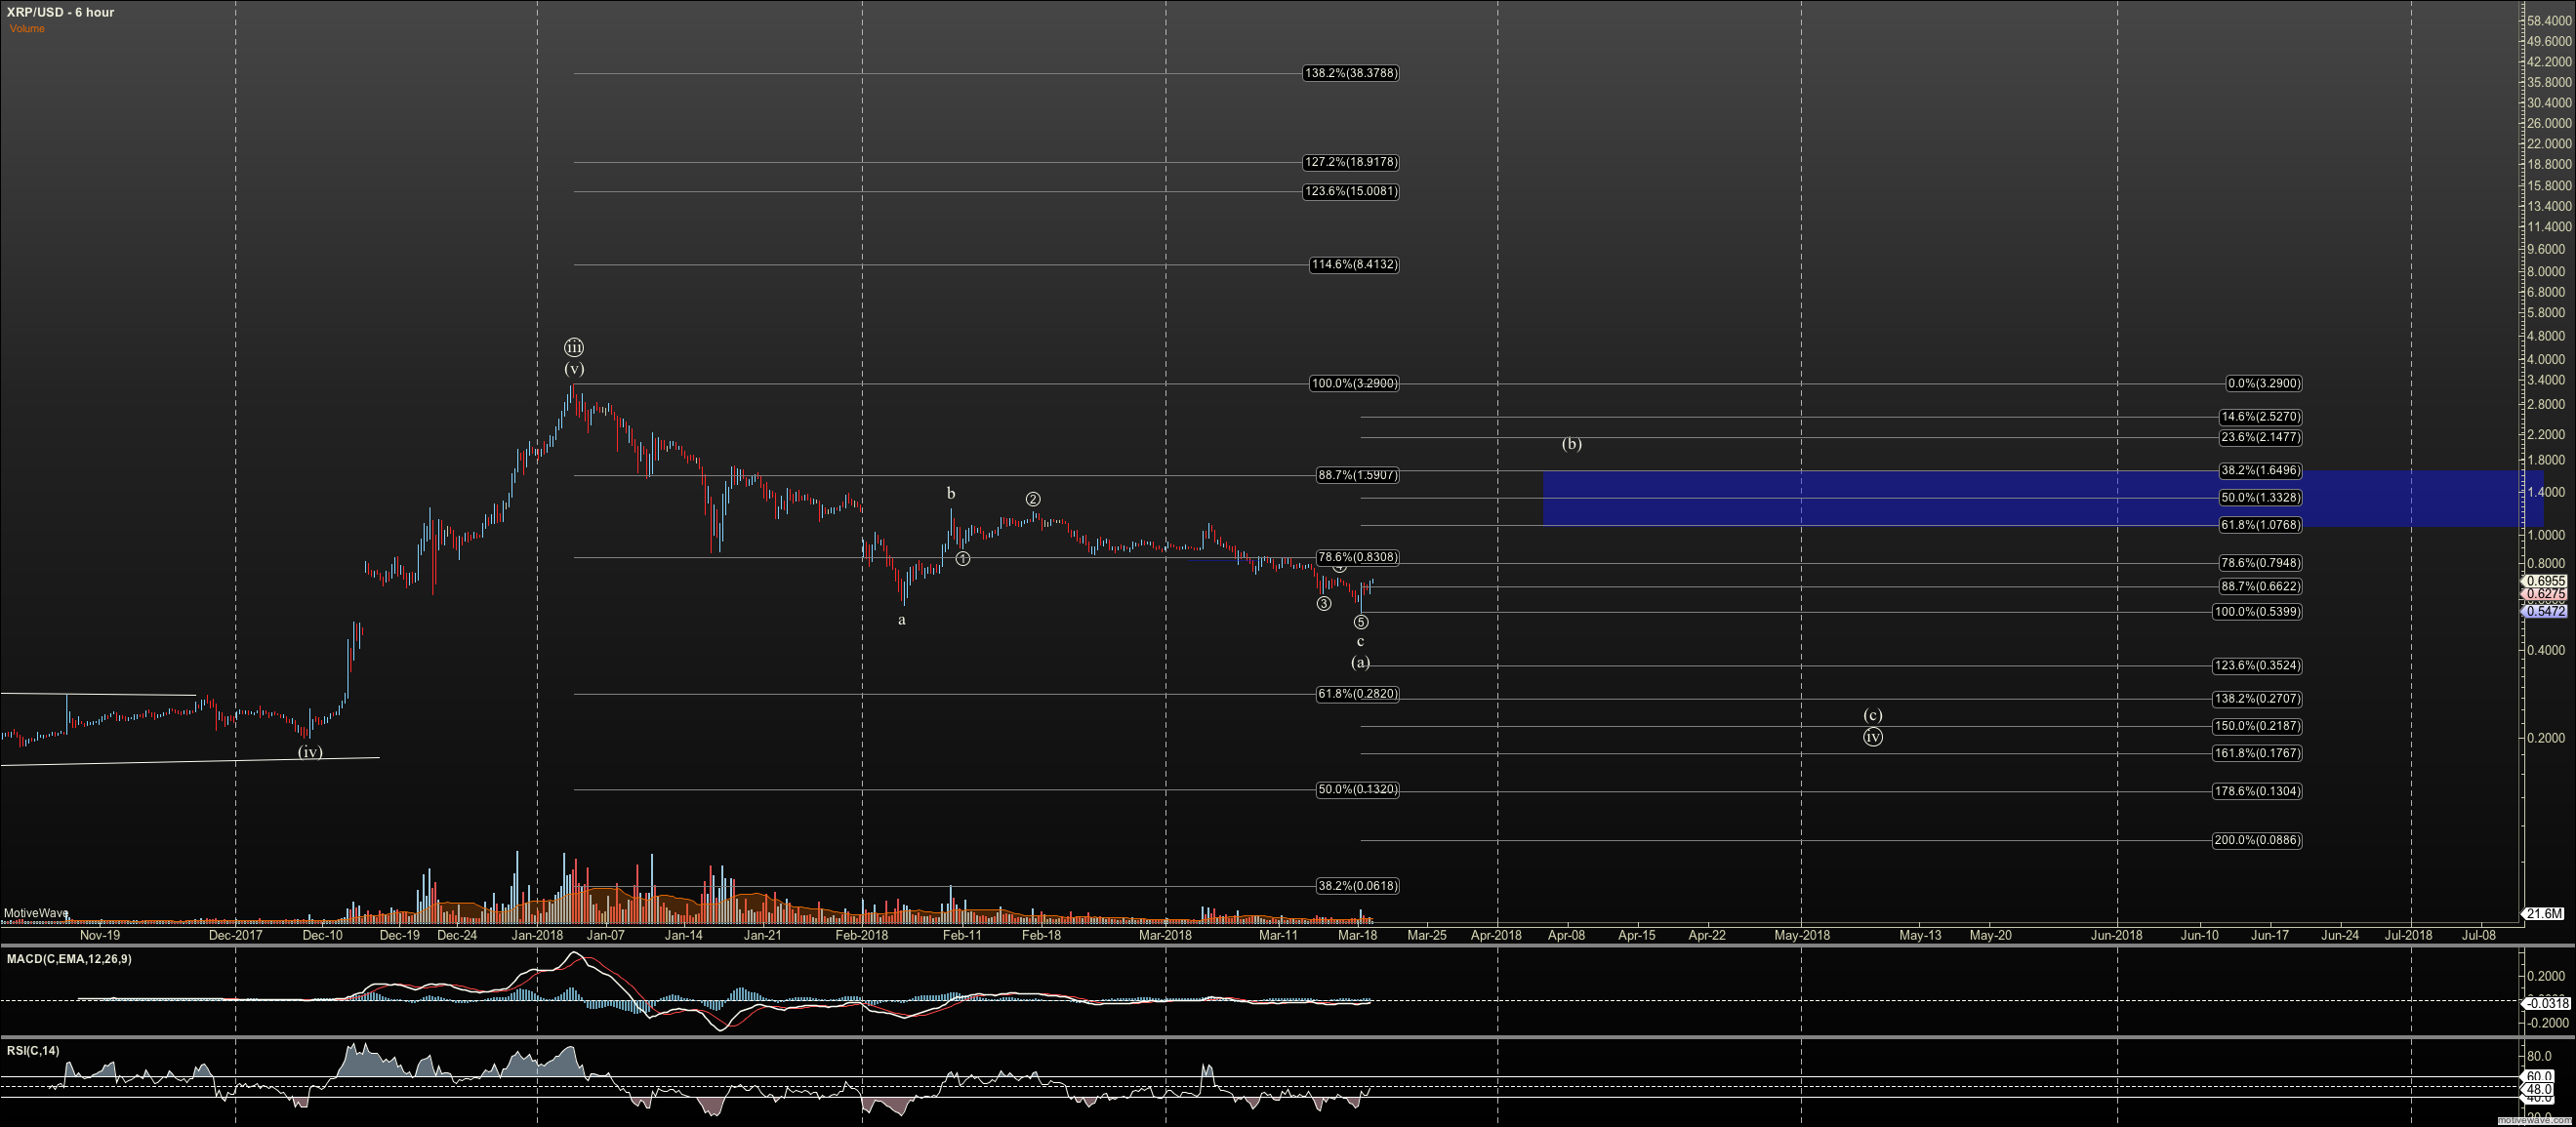
Ripple: In my last article, I said that I expected Ripple to take a direct run to the B wave top. Instead it failed after the 1-2 setup of C and took a detour. As shown in the chart below, we believe we have completed c of a lower b of B. This structure is much like our pattern in Bitcoin above. A reminder: We have a possible target of 20 cents for Ripple after the B wave top completes.
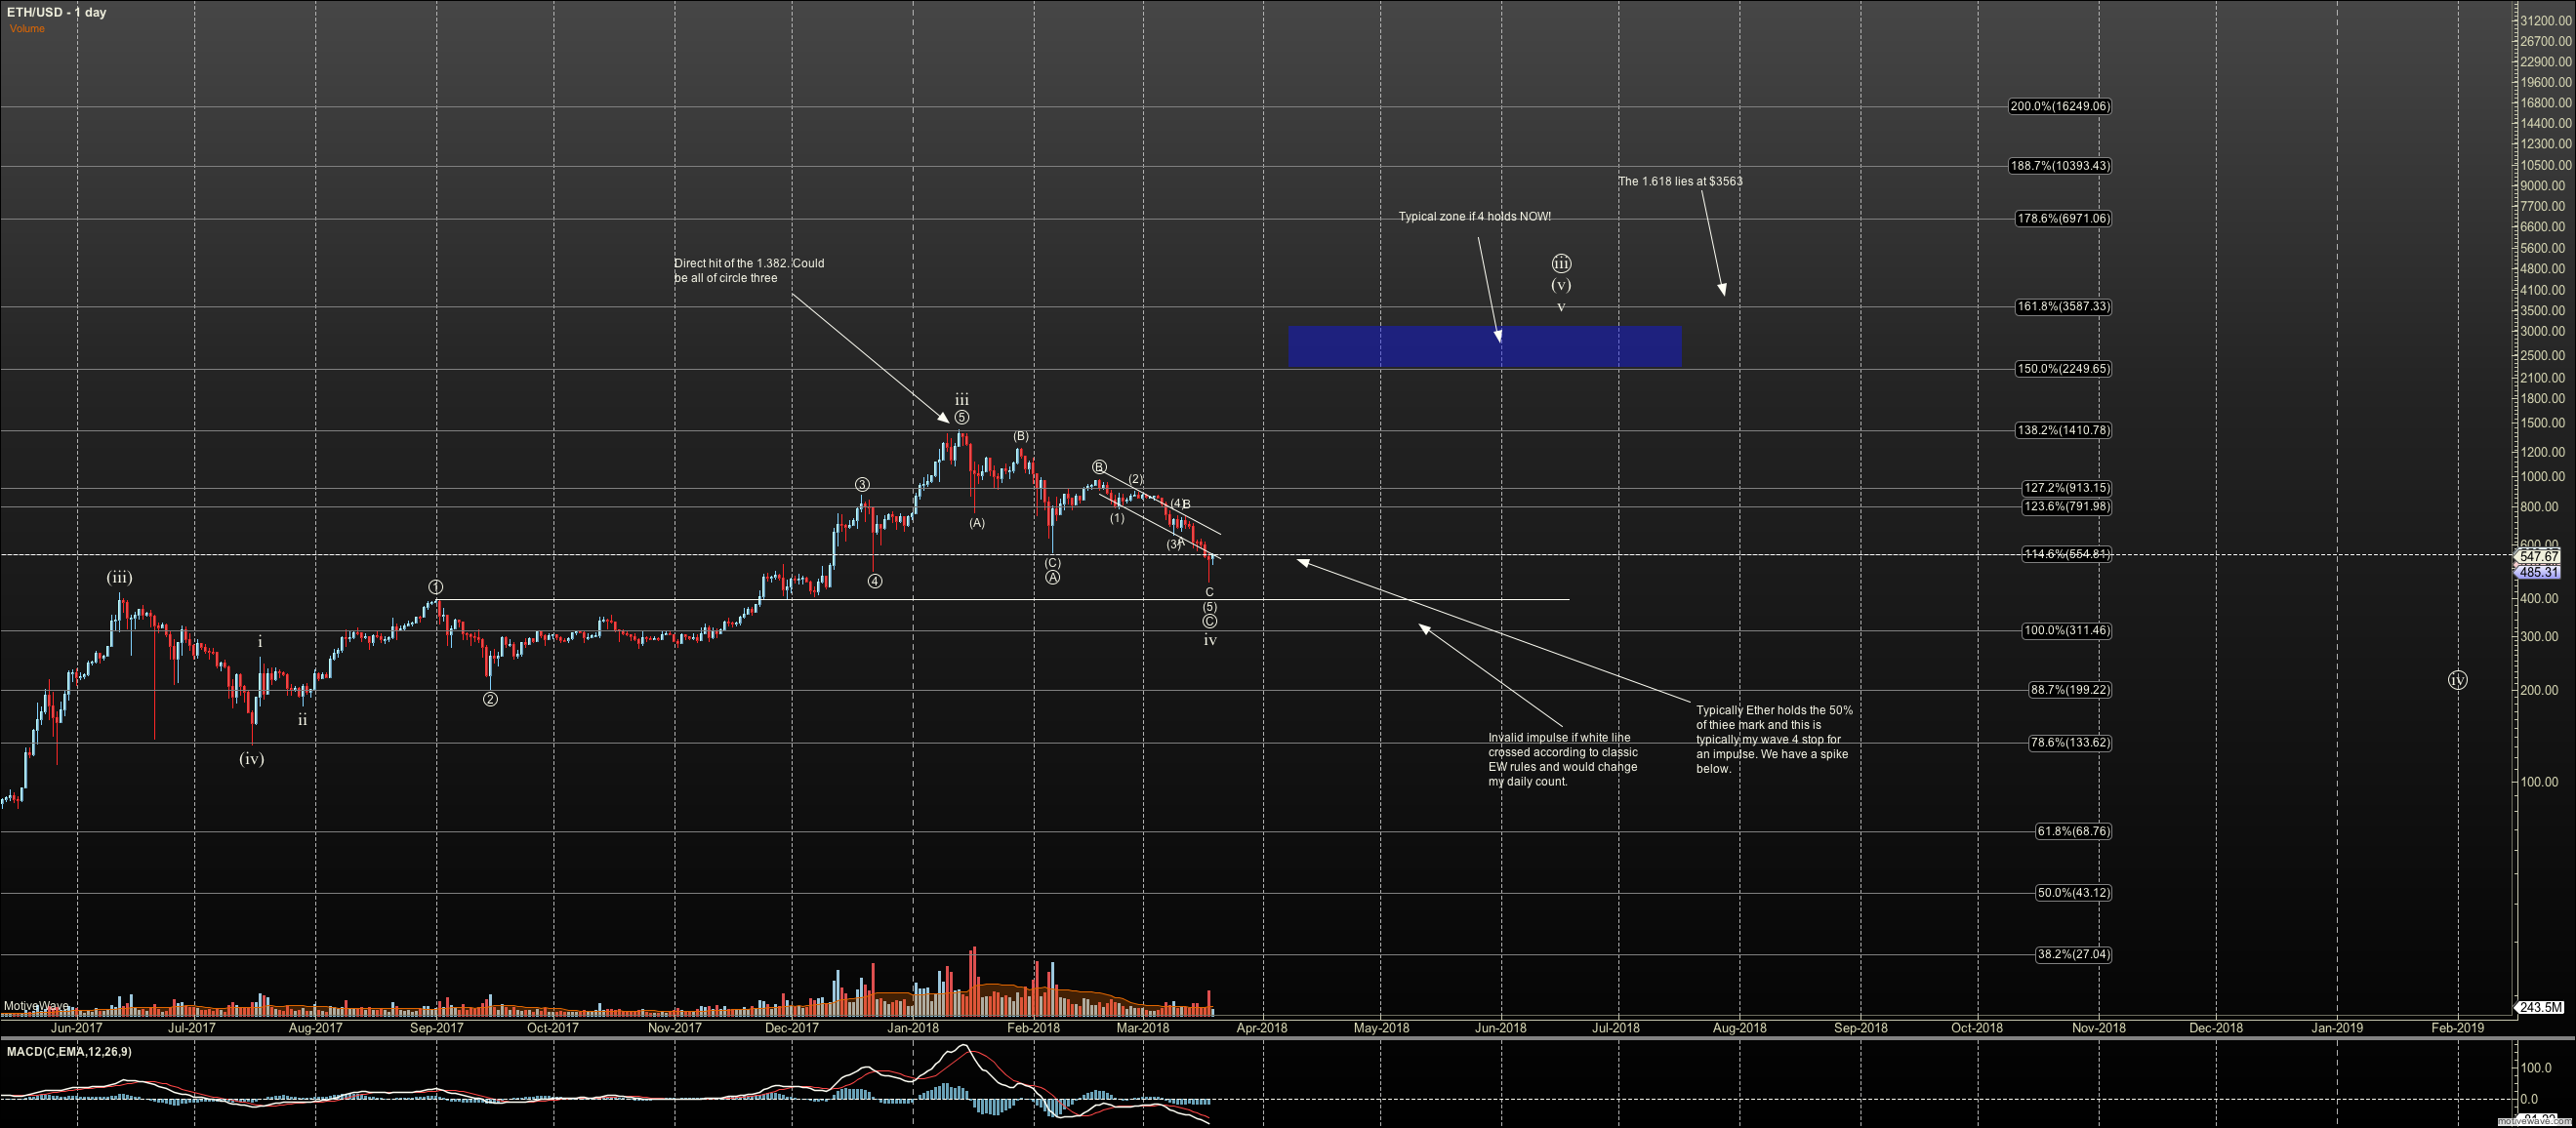
Ethereum: The structure in Ethereum is quite different, as it broke to new lows below those of February 6th. Further, it moved directly into support for our 4th wave of primary three, targeting $3560. Therefore, it is my opinion that if this area doesn’t hold, I must reevaluate my long-term count, and targets. I have attached both the hourly and daily charts with notes, so this is clear.
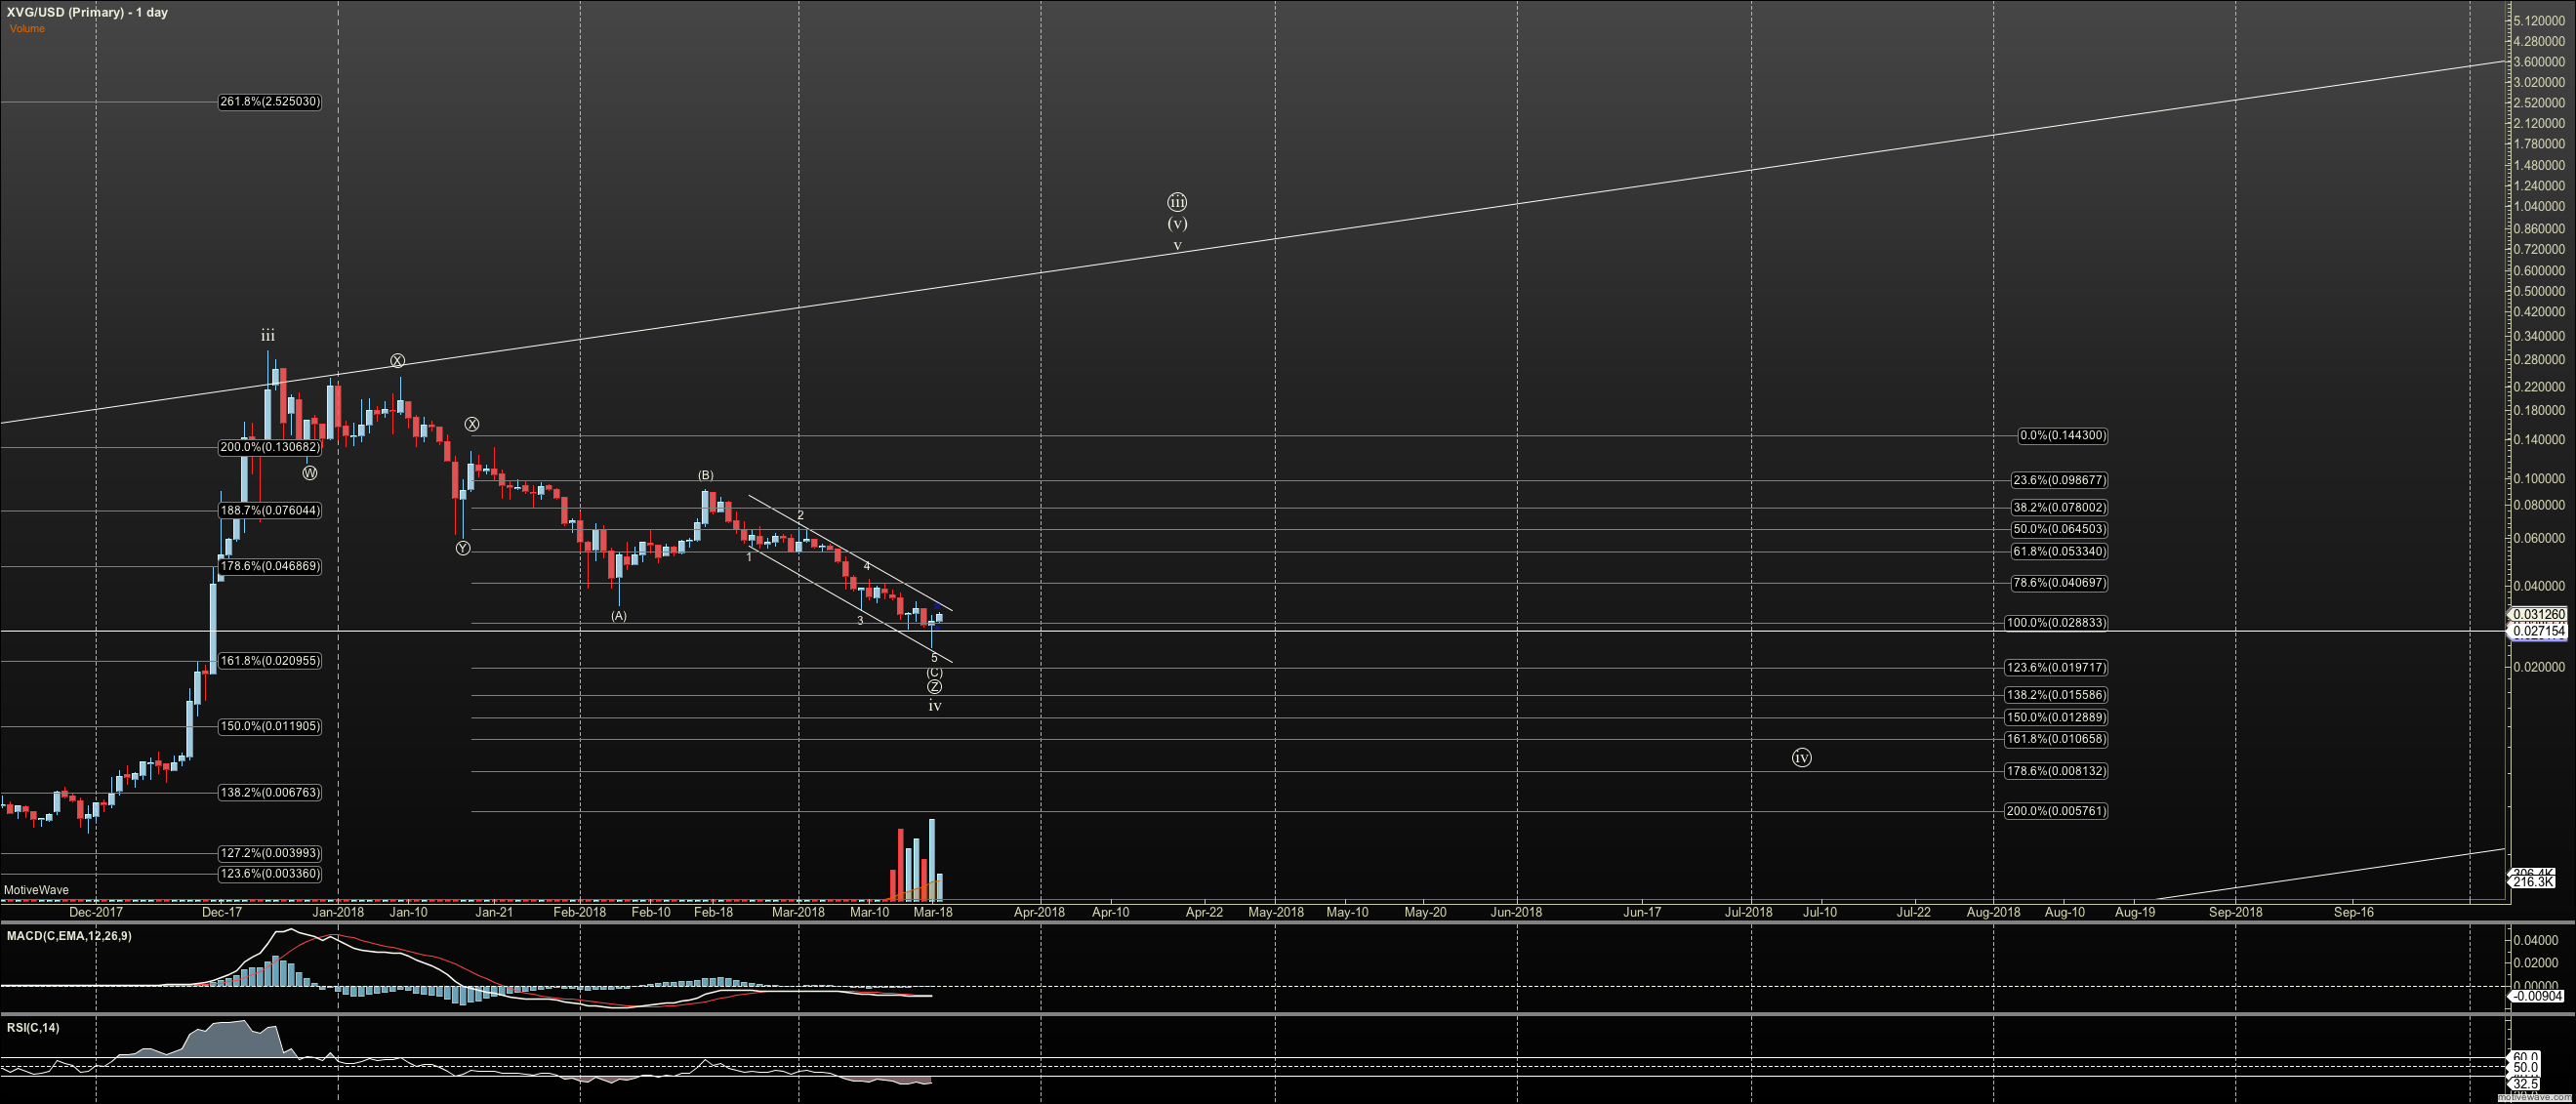
Verge: Verge is very similar. It came directly into long-term support in a very complex pattern that Ellioticians call the WXYXZ. The good news is that such a complex pattern usually signals the completion of a correction. The bad news is that as with Ethereum, we are barely hanging on to long-term support. If we don’t see a strong rally out of this zone, I will likewise need to reevaluate future targets.
Bitcoin Triangle: The question in my mind now is how Bitcoin, our bellwether, can be set up for further lows in this correction, while Ethereum and Verge, along with many other coins, small and large cap, appear to have stretched into major lows that should hold. Will those new lows fail further, or might Bitcoin have something surprising hidden under the hood?
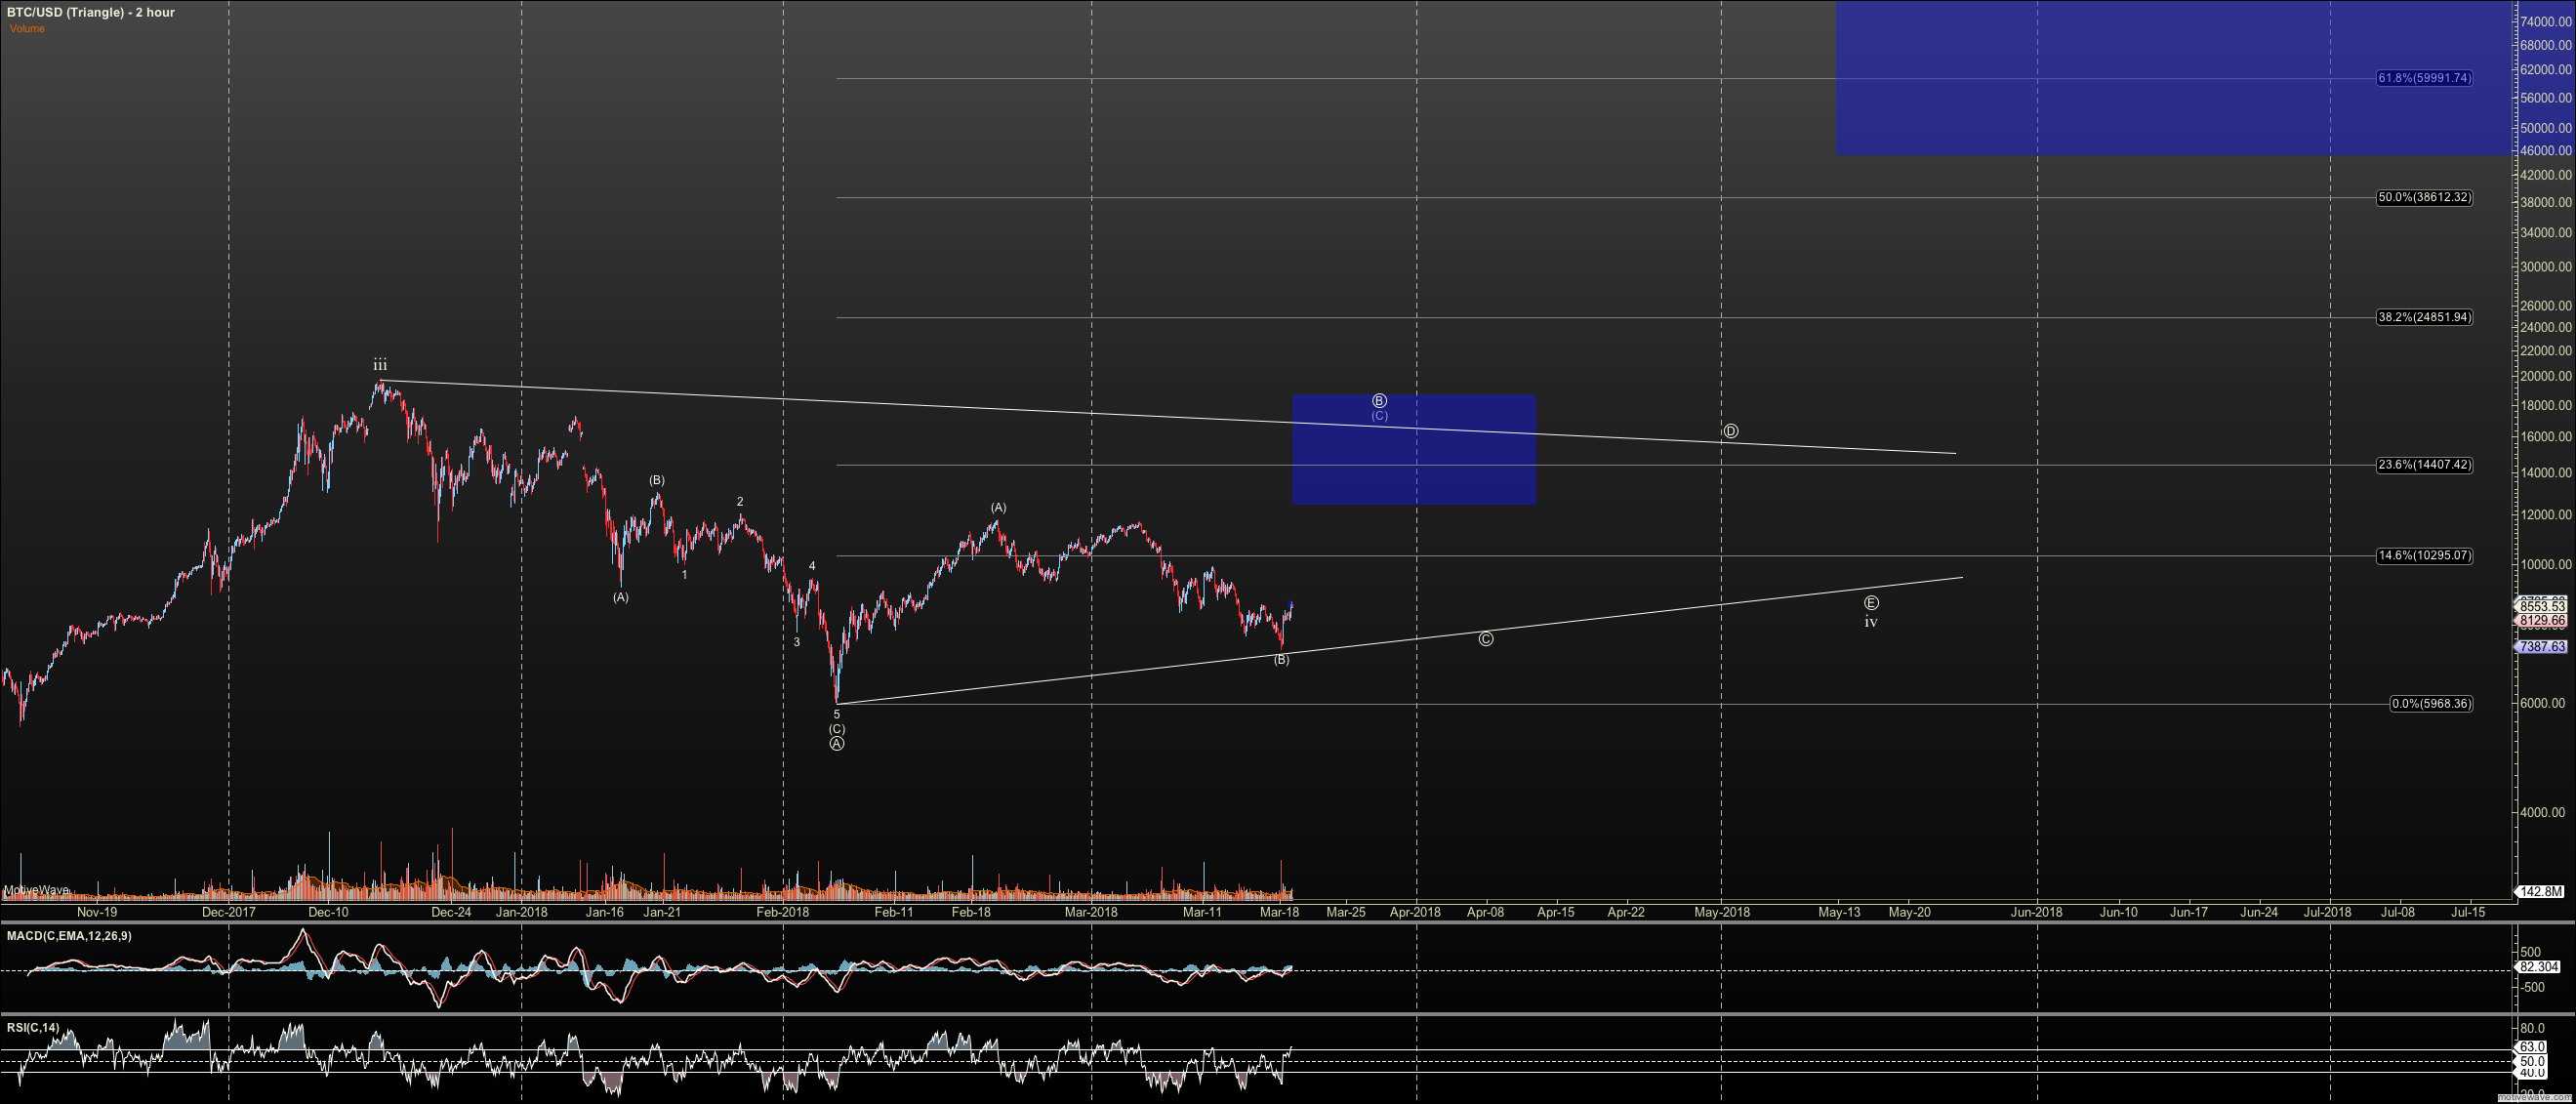
Since the move off the February 6th low in Bitcoin is best described now as three waves, we can say an impulse is unlikely. But there are two alternate possibilities that would hold the February 6th low: a triangle and a leading diagonal, both of which can begin with three waves up.
The triangle involves 5 waves sideways, each of them subdivided by three waves. From this viewpoint, the bottom is in, but the correction will stretch out in time.
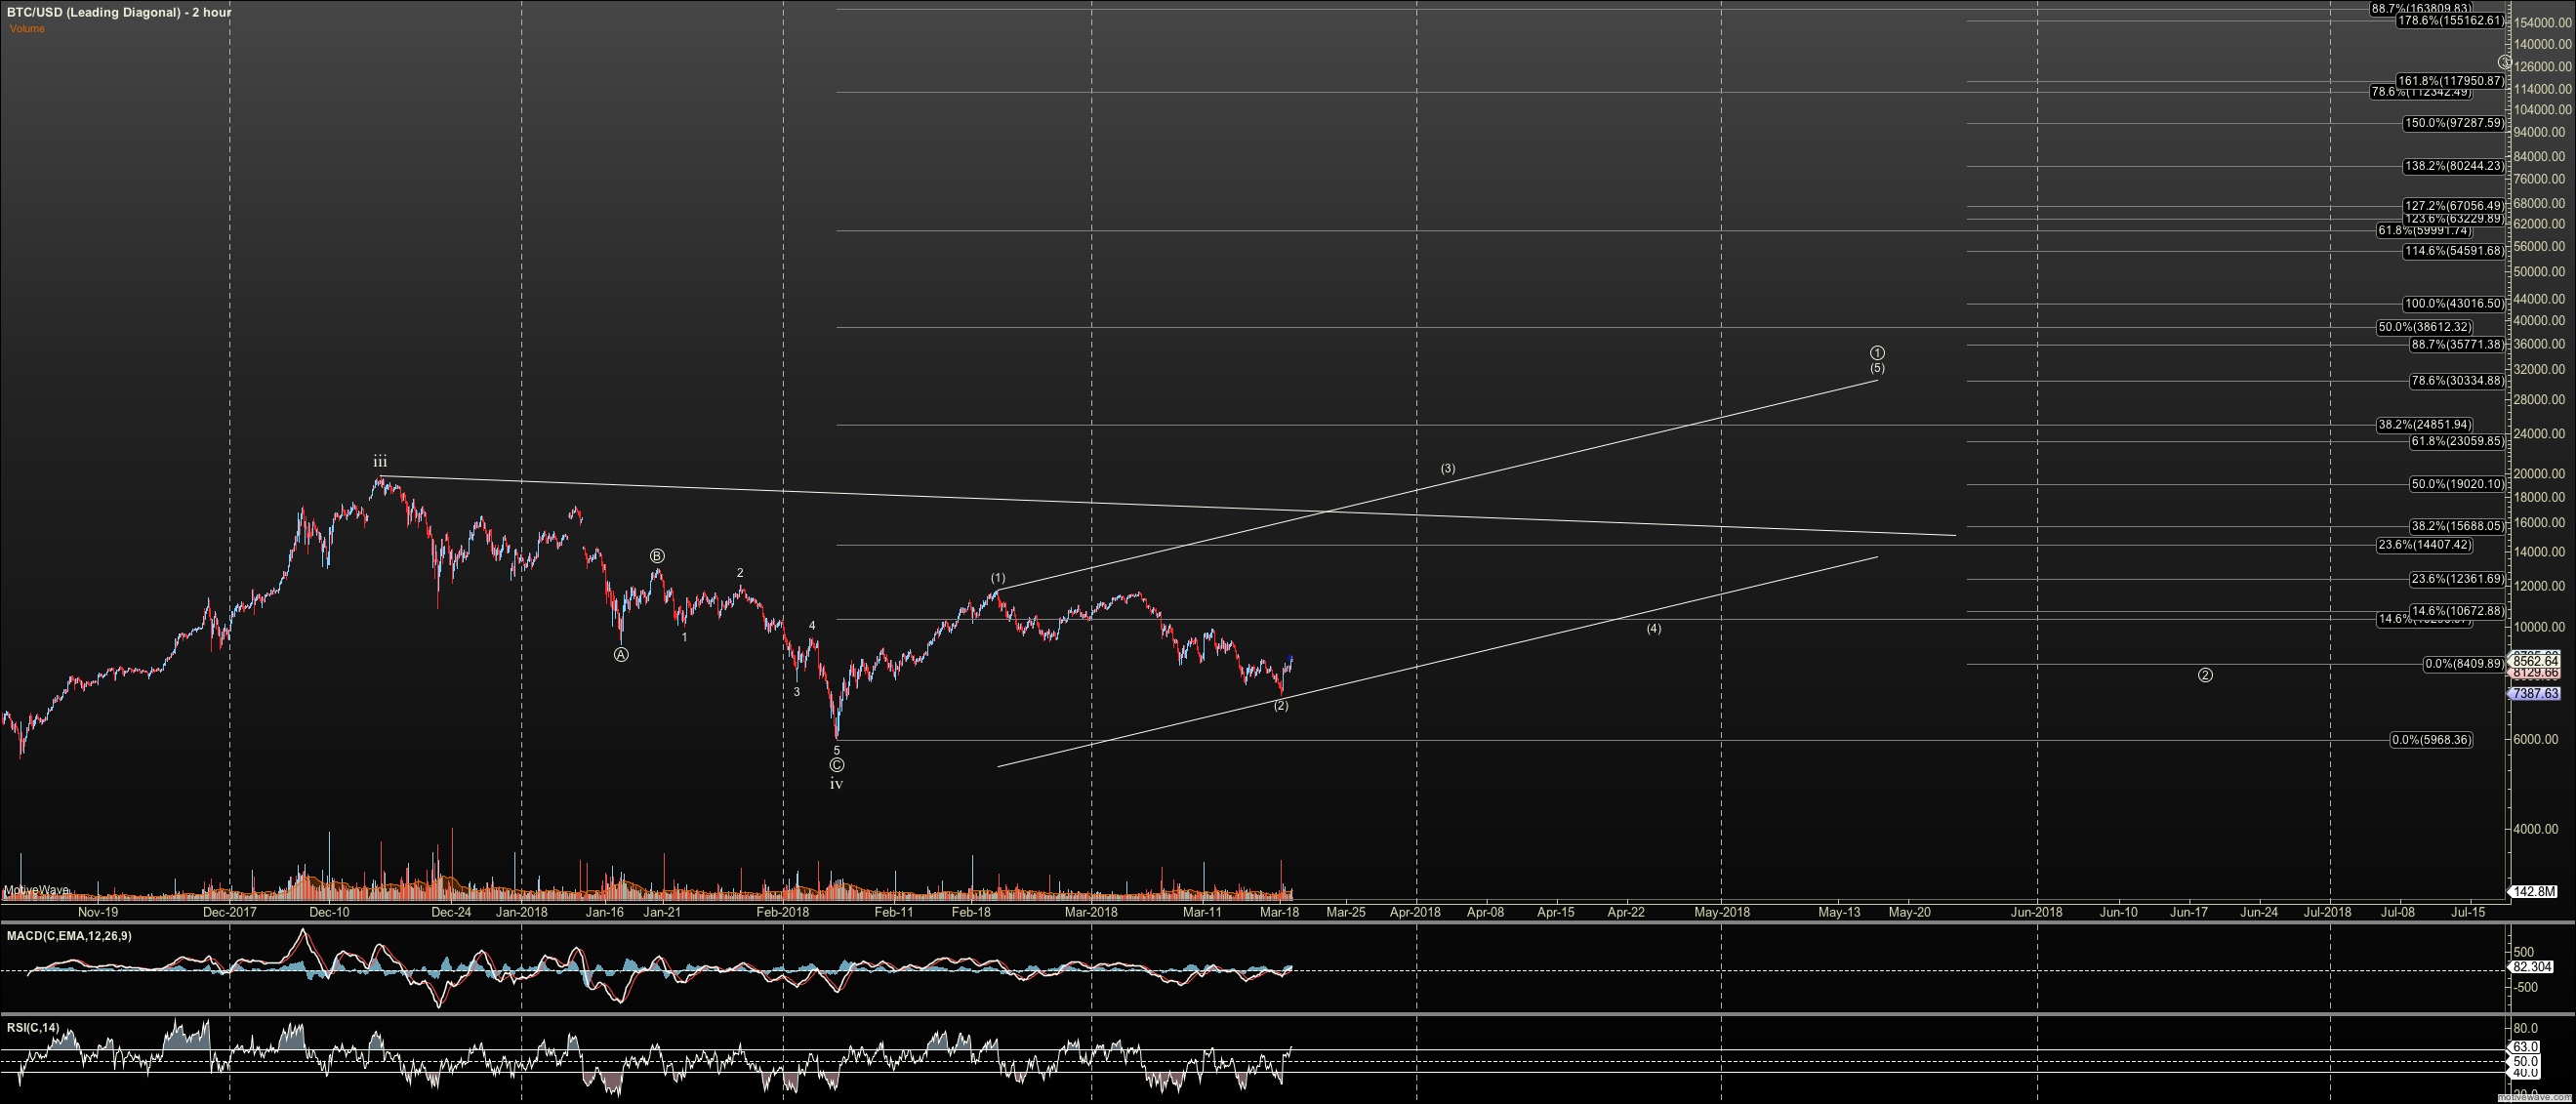
Bitcoin Leading Diagonal: The leading diagonal is also made of five waves with each possibly subdivided as three waves. But instead of moving sideways it slowly grinds a northward course, a bit slower than an impulsive structure, before completing the first wave up. Diagonals also have deeper corrective waves than a standard impulse, requiring more patience in holding on to one’s position. See the attached chart.
In conclusion, we are making yet another attempt at a bottom here. Yet we now have less confidence that this will be the end of the correction, given the structure of Bitcoin and the fact that some of our small-cap and large-cap coins other than Bitcoin are now testing major support levels. I’ll check in again soon, after we have more action, to see if the view is made more clear.