Chart on S&P 500 (INX) and IWM
As noted over the weekend, the market needed to see a big gap up today to maintain the bullish Elliott Wave count we have taking us to the 2150-2175 region next. And, the market did not disappoint.
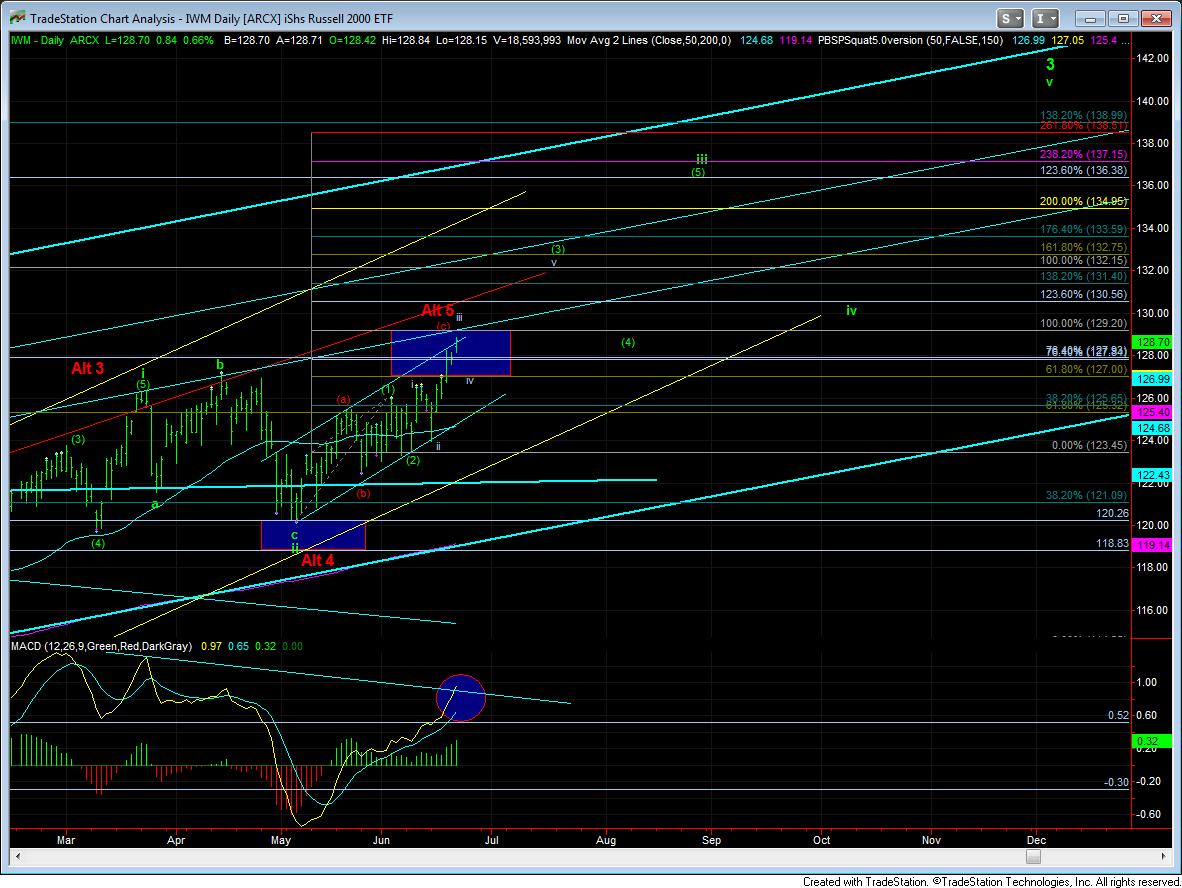
While, even in the more bullish Elliott Wave perspective, the S&P500 is still presenting a pattern which is going to provide us somewhat limited upside, the IWM is still maintaining a very strong bullish Elliott Wave pattern. In fact, as long as the next pullback does not break down below the 127 level in the IWM, the pattern taking us over 140 is still holding strong.
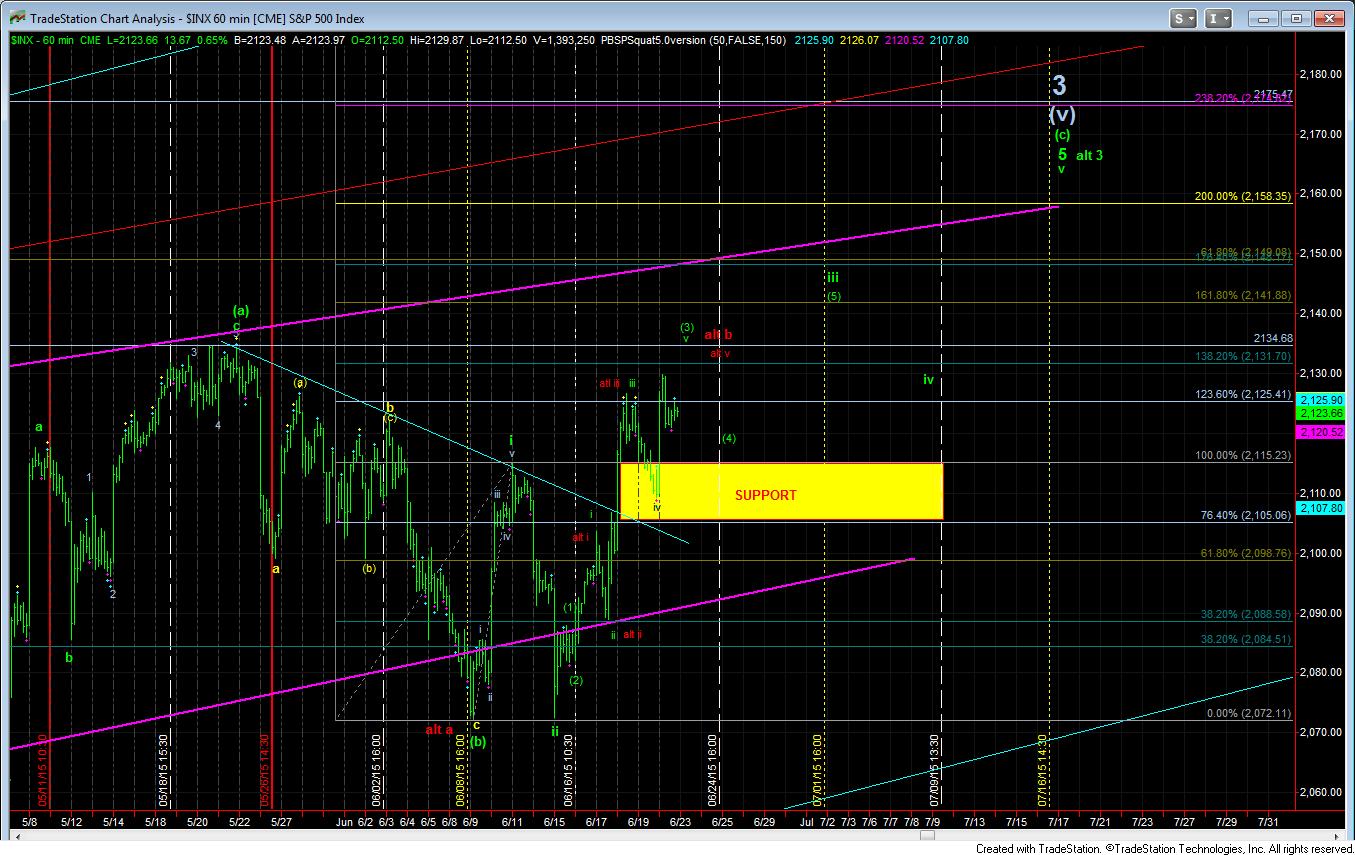
In the SPX, as you can see from the attached chart, we were looking for a run up to the 2131-2135 region for our next local topping target, which should then provide us just a corrective pullback. And, in order to maintain our bullish stance in the SPX, we should not see a break down below the 2109 level. But, as I noted over the weekend, it still takes a break of the 2103SPX to invalidate the bullish Elliott Wave count we have on the chart taking us to 2150-2175.
And, remember, a break down below 2103SPX opens the door to the larger degree correction we have been noting, which can take the SPX back down towards the 1800 region. But, as long as support is being held, I am still looking higher to our next target region.