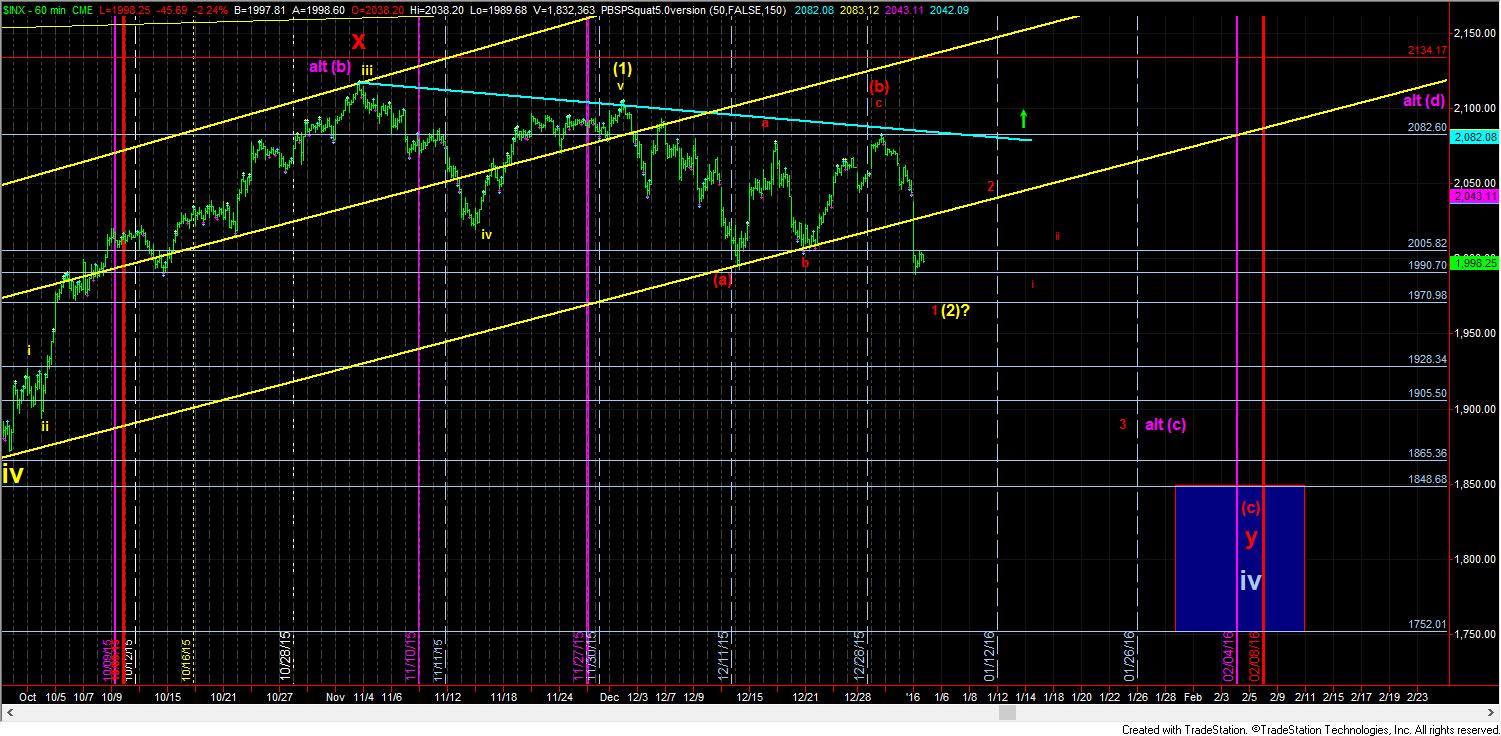
Chart on S&P 500 (60-min)
The manner in which the market broke support today was a resounding statement by the bears. But, alas, for the last 3 months, we have seen bullish set ups violated, as well as bearish set ups violated.
For now, with support broken, I am going to have to focus on the bearish set up. In the most bearish case, the market has almost completed wave 1 down of the (c) wave in a y-wave of wave iv of primary wave 3. This set up would have us targeting 1847SPX – wherein (w)=(y) – in the larger degree correction. But, as we have seen for the last 3 months, this is clearly not a slam dunk.
In order for me to be able to trade this perspective confidently, I will need to see all of wave 1 down completed, followed by a “corrective” rally in wave 2, with a further i-ii set up to the downside, as outlined in the red count on the 60 minute chart.
But, take note that if we do get this set up, I will likely be exiting any additional shorts I pick up along the way once we reach levels just over the August high, due to my concern that this can turn into a big wave iv triangle, as presented in the purple count. So, that is the first possible wrinkle with this count.
The next perspective I want to present is one that I am not terribly confident of at all, and it is an alternative bullish count. Now, since the bulls have had a wonderful opportunity which they have recently squandered by allowing support to break, I have a hard time believing they will lose a strong set up to pick up a much weaker one.
So, the yellow count on the 60 minute chart is a much weaker bullish set up, at least in my humble opinion. For that reason, I cannot even consider it unless I see a further impulsive structure take us over the 2082SPX level. That would have us back on target for the 2400 region for wave v of primary wave 3, which is still 10% over the break out level. But, again, I think this is a very premature, and the only reason I am even presenting it is because I still view this overall market as a continuing bullish one, but one that is simply in the midst of a correction. As I have noted time and again, I believe that much higher levels will be struck, so I have to at least be mindful of any immediate bullish potential represented within the market. But, for now, it will have to prove it to me.
At this point in time, with support broken, I have to be focusing my attention on much lower levels, at least in the potential triangle count, represented in purple. So, as long as we remain below 2082SPX on all bounces, and those bounces are not impulsive, I will be looking for opportunities to short the market down to the 1900 region.