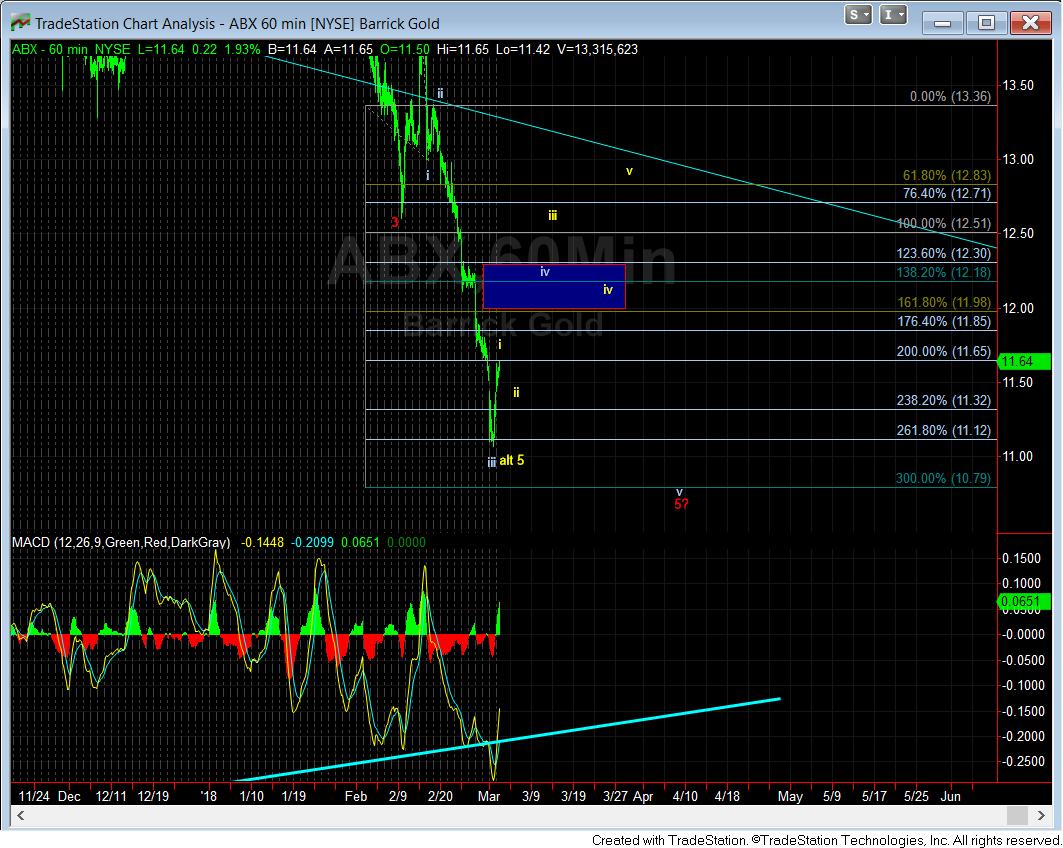
Chart on ABX - Market Analysis for Mar 2nd, 2018
We have a very interesting development today in the ABX chart. Off the lows, we have what can be viewed as a micro 5 wave structure off that low. Should we see a corrective wave ii pullback, in yellow, and the market can then rally through the resistance box, we may have our first significant 5 wave move off the target low pointing up towards the 13 region, as presented in the yellow count.
So, for now, I am going to be a bit more patient to see if we even get the i-ii set up.


