A Tale of Two Charts.
It was the best of times it was the worst of times...
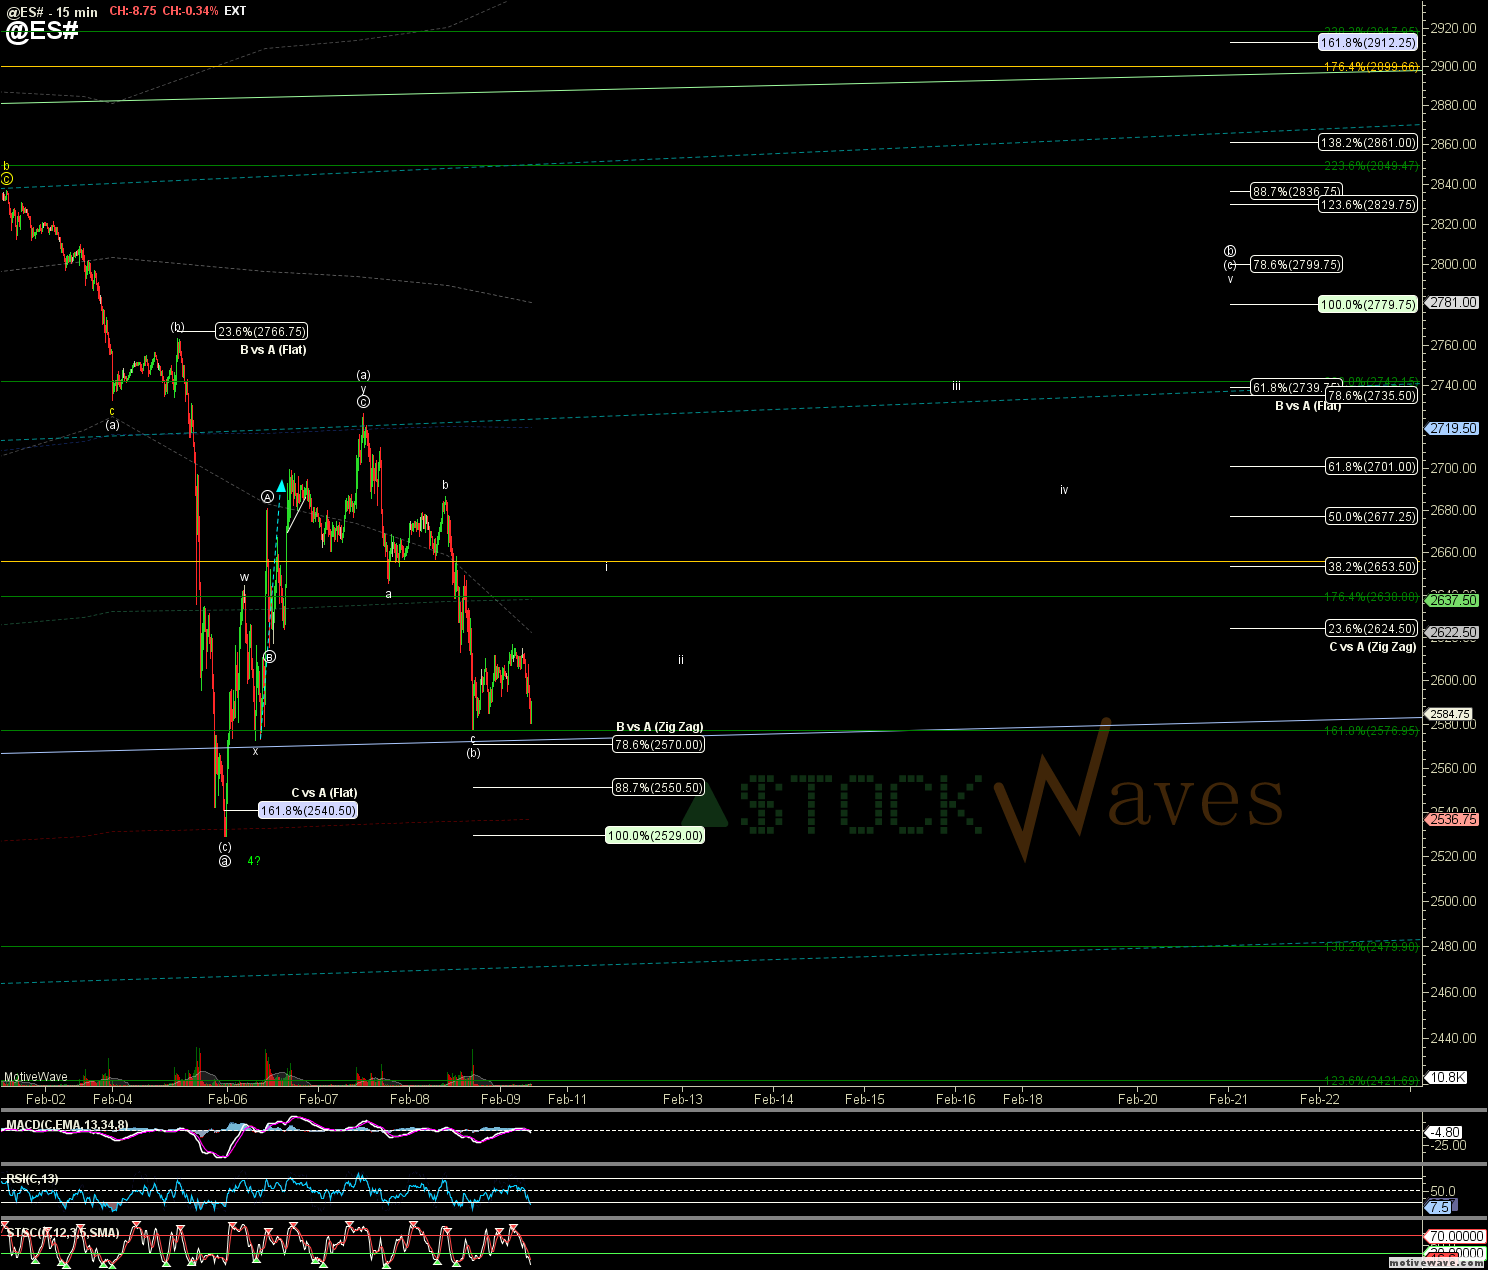
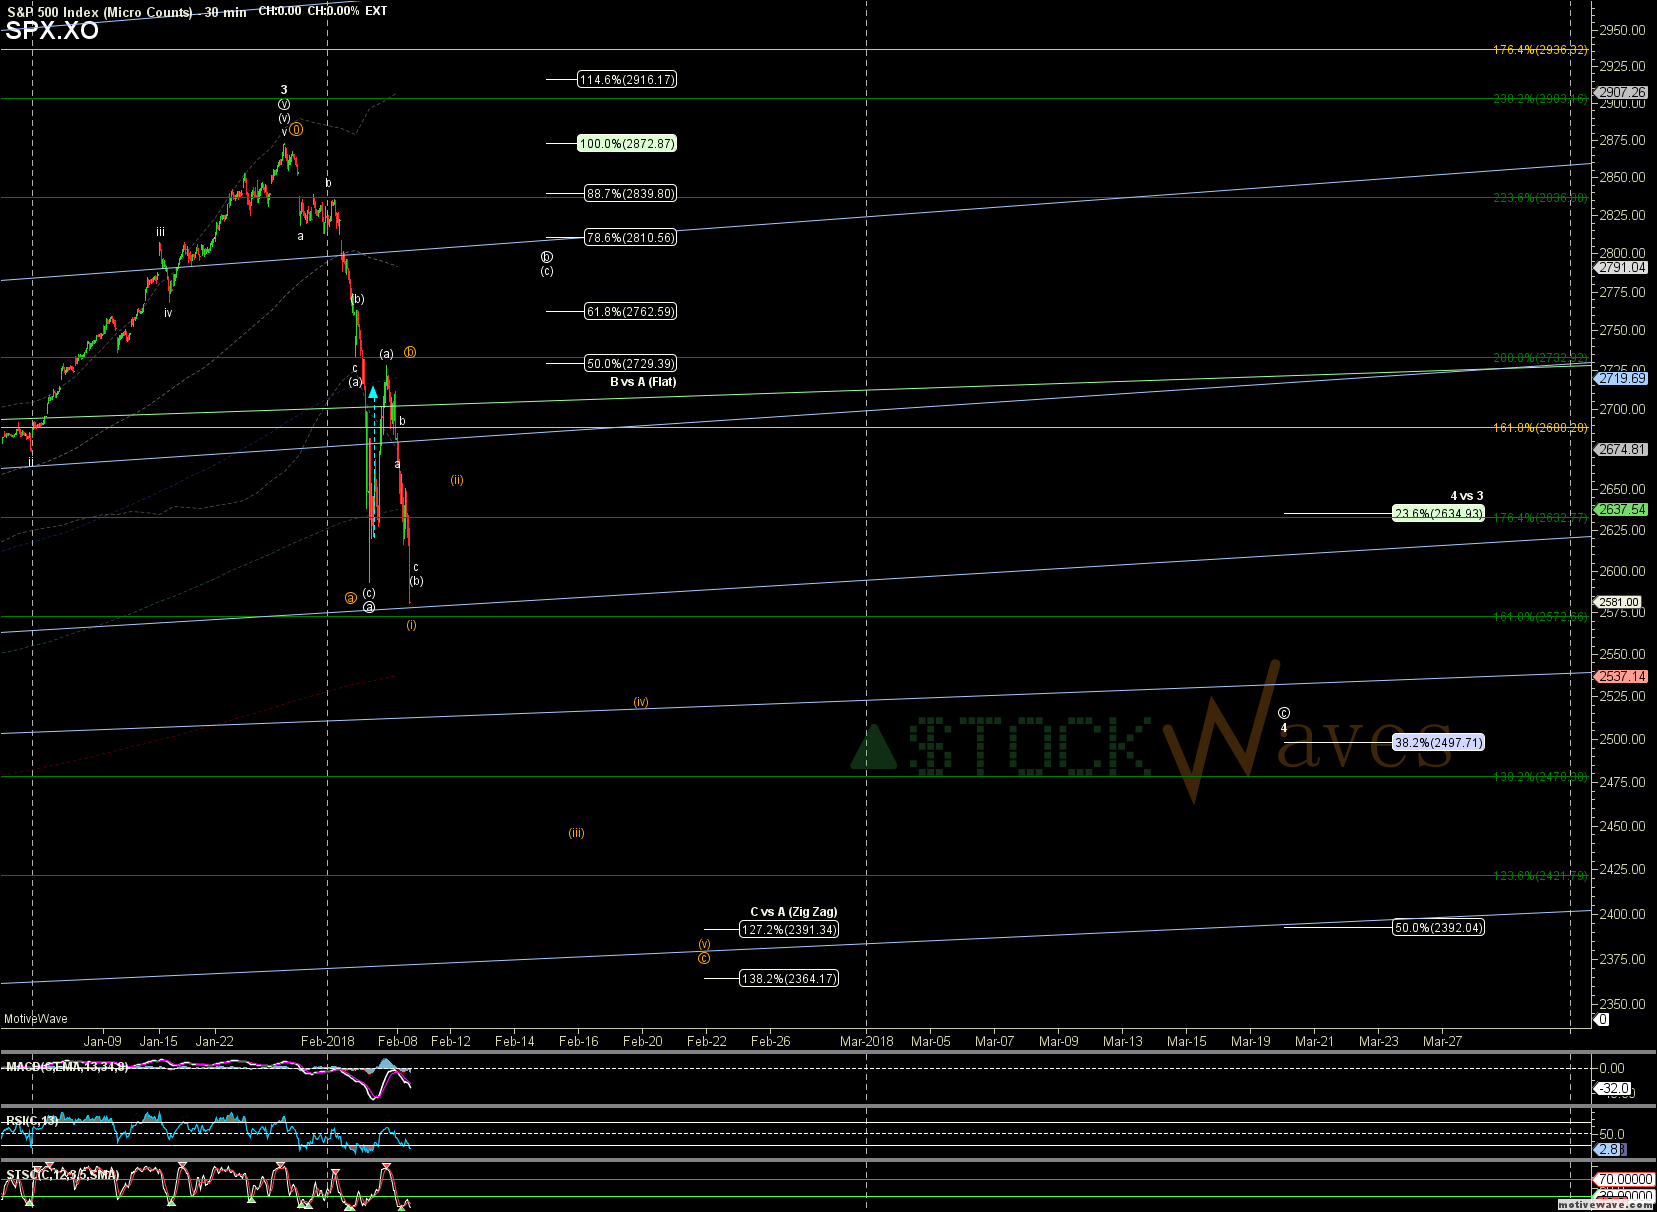
I expected the "(b)" to be much more "severe" in SPX than ES, but since the "b" of (b) in ES completed at 8:45AM yesterday it is "missing" from the cash... leaving SPX "LOOKING" like 5down.
I am afraid many market participants, who do not know that they don't know, may subconsciously see this as the wave (i) start of sharper c of 4 "early" dropping us below the 200MA to just unner 2400...
ES still clinging to the hope of a (c) up to 2780 (which might have been "waiting" on a #Shutdown vote), but a lil lower here would make 5 down as an LD of (i) for or #FuturesFriend too.
*Ideally both would still bounce to 2640-60 for a wave (ii) before a stronger (iii) of c.
** (iii) of c is projected from ~2660 as -7.4%... it could make Monday's -4%, and yesterdays -4% look tame.
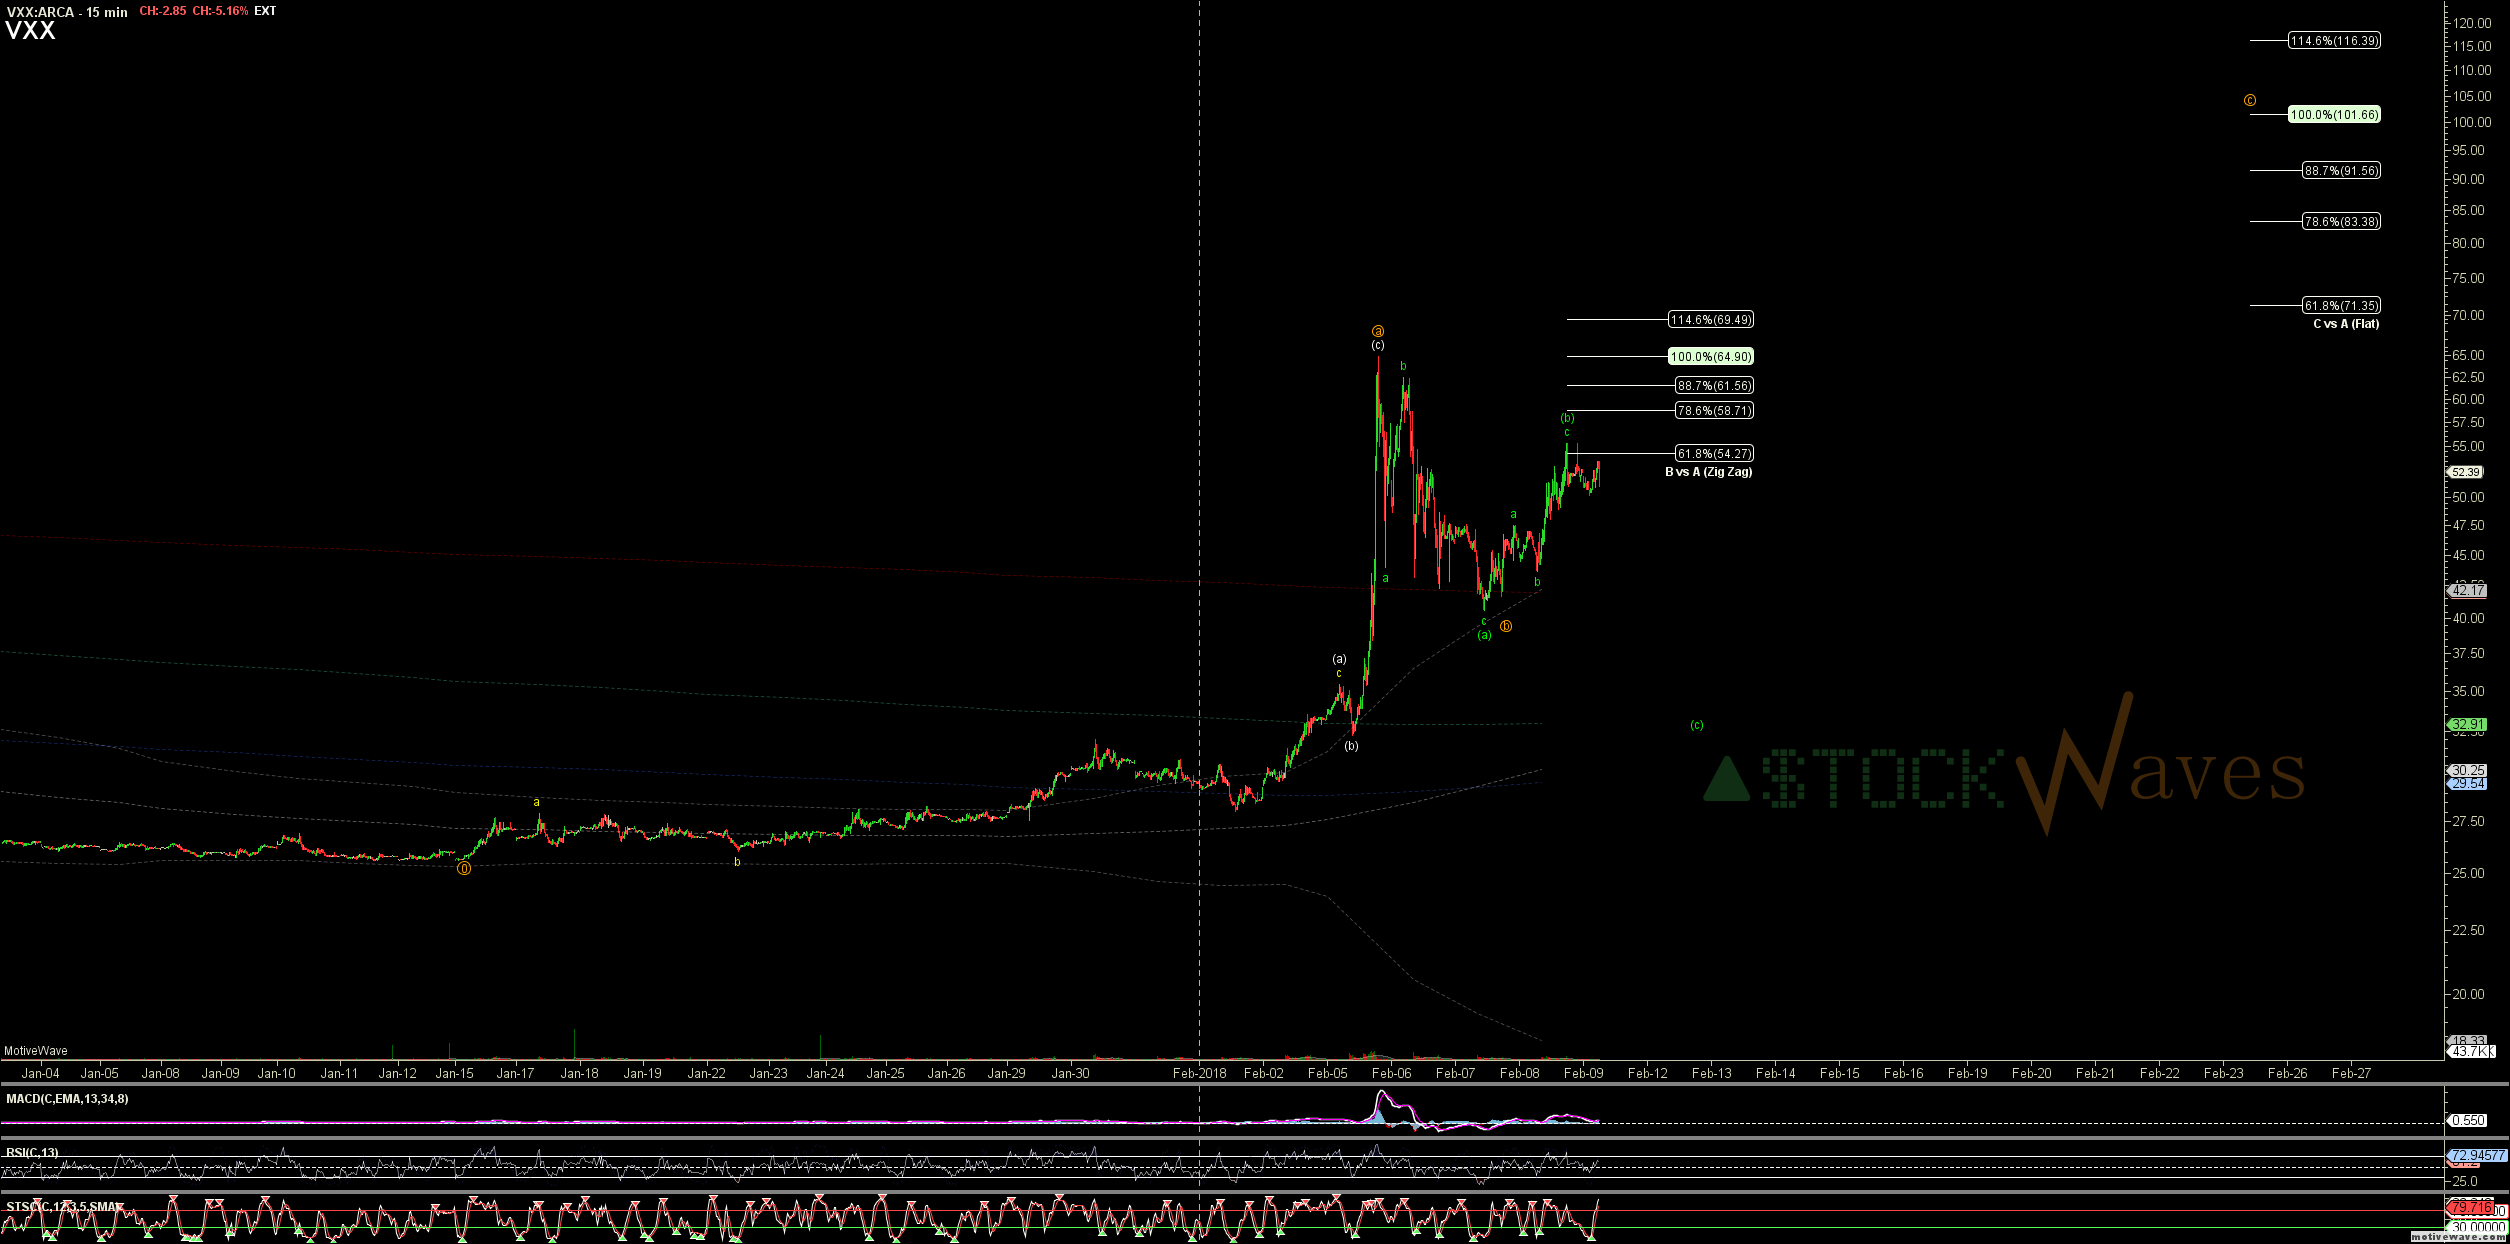
IF and that is a BIG IF... we are starting c already as shown in orange in SPX chart... VXX #PirateNinja orange c wave would project >100.... ![]()
That seems a little extreme.
A (c) of deeper circle b here back to 33-29 is much more reasonable and from there the circle c would project "calmly" up to "only 70s or 80s.
But even if orange c, VXX still looks like only 3up so far so would ideally need the vth of (i) and then a wave (ii) retrace.