XPEL: Underpriced Protection, Overlooked Potential
 By
Levi
By
Levi
Let’s pause for a moment to take a closer look at this one. First, we’ll establish the fundamental foundation, and then examine what crowd sentiment is telling us. It could just be that we uncover a hidden gem and a potentially bullish setup.
Lyn Alden provided members with this current FAST graph, which presents a constructive fundamental picture.
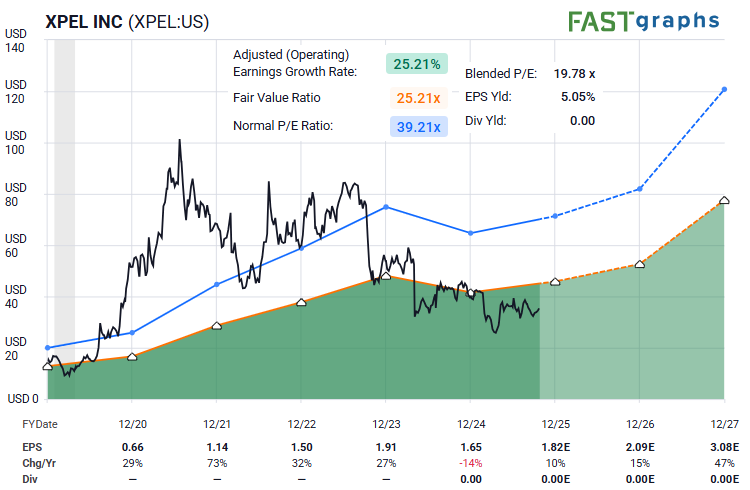
Keep in mind the following when it comes to interpreting the data.
F.A.S.T. Graphs 101:
- Black line: the current and historical stock price
- Blue line: what the stock price would be if were at its historically average price/earnings ratio
- Orange line: a conservative measure of valuation (a 15x price/earnings in this case)
- Yellow line: dividends paid that year (and the payout ratio is relative to the orange line)
- Dark/light green: the transition between historical earnings numbers and consensus analysts’ forecast earnings numbers
This snapshot looks supportive of a bullish setup, but confirmation is still needed. We can also define specific price levels that will either affirm our thesis or tell us when it needs refinement.
Sentiment Lights The Way Forward
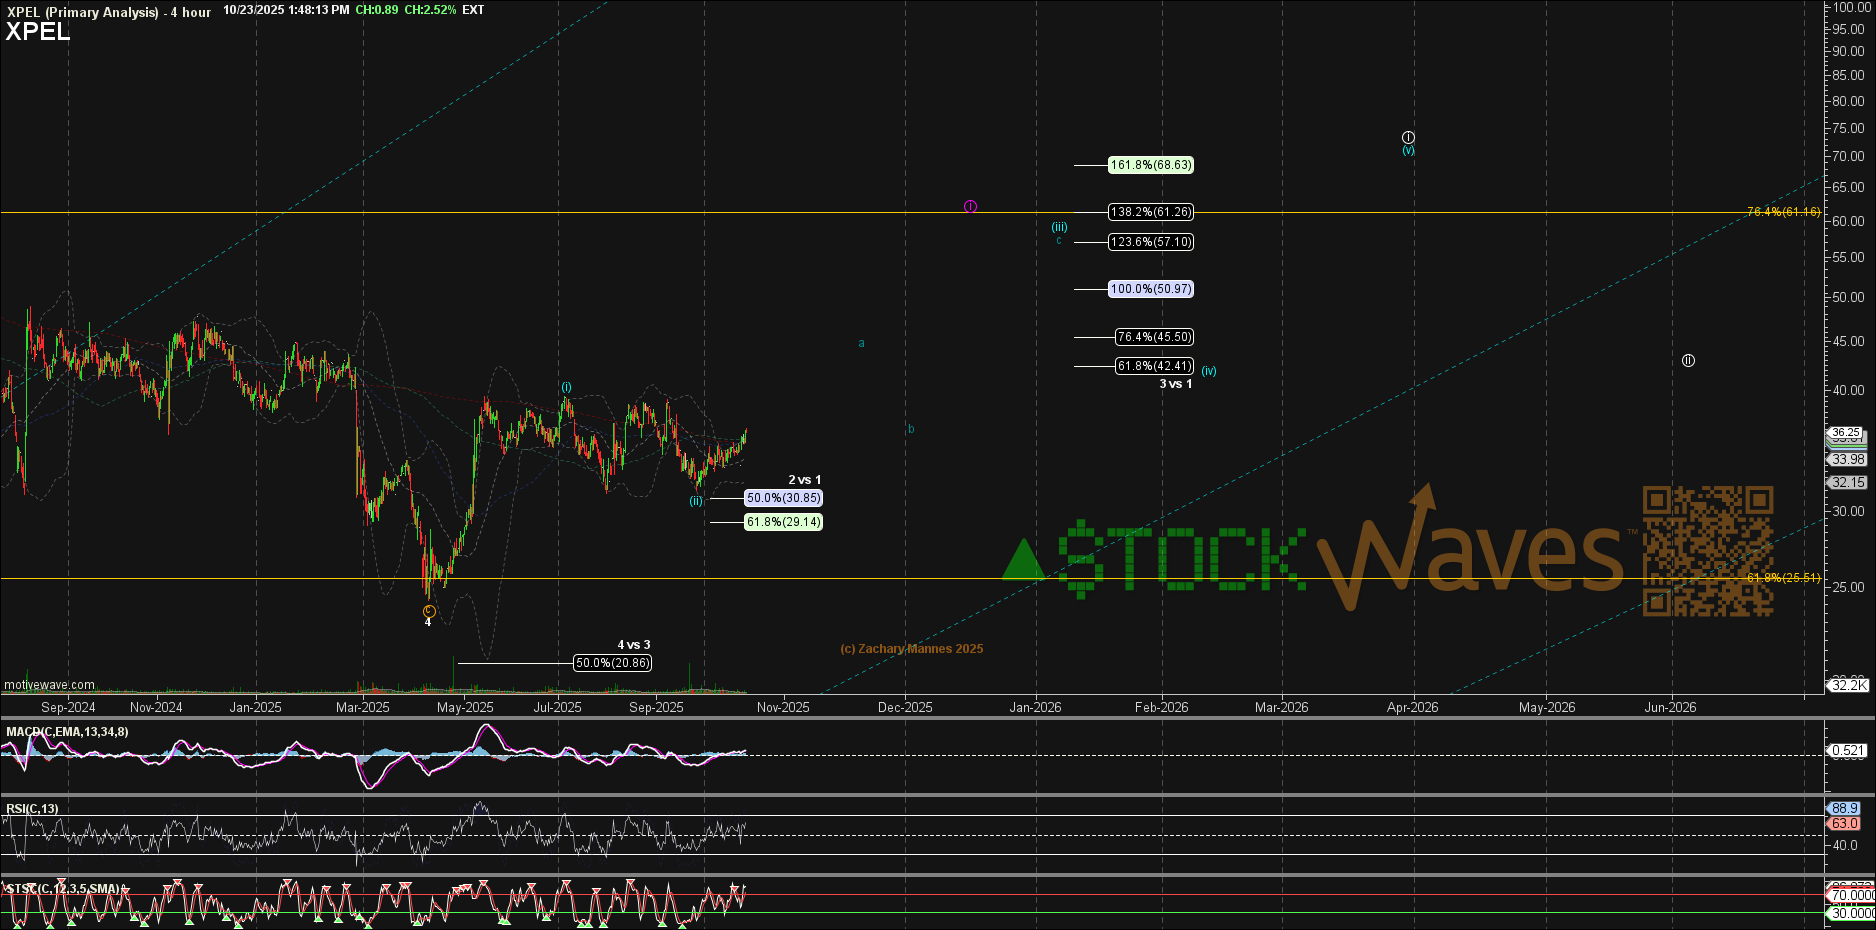
By way of brief review, XPEL took off on a torrid run after the Covid Crash in the spring of 2020. The stock sprinted from the $7 area to as high as $104 in the summer of 2021. That kind of exuberance often demands a lengthy consolidation — a market “cool-down” period.
Believe it or not, that rest period lasted nearly 4 years. It appears that just this past spring, we’ve seen a completed fourth-wave correction, with price bottoming near $24 in April. What does this mean for us?
One of the great simplicities of Elliott Wave theory is that you never have to count higher than 5 — a quip, yes, but also a guidepost. The next wave anticipated after a fourth is, of course, a fifth. Can that exceed the prior high of $104? That’s the presumptive path — but we’ll need a more concrete setup first.
So, here is what we can anticipate. Refer again to the chart above. If that April 2025 low near $24 was indeed wave 4, we now expect a smaller-degree i-ii rally to form the foundation of the next advance. That appears to be underway.
Remember that markets display variable self-similarity at all degrees of their structure. As well, the fractal nature of these structures also shows up in the subwaves from larger to smaller. With that in mind, it appears price has formed waves (i)–(ii) of circle wave ‘i’ within the larger wave 5.
Put more simply, the initial rally up from wave 4 may just be beginning. Price should be in (iii) of wave circle ‘i’ and may reach the 1.236 - 1.382 extension zone overhead. This current setup, as illustrated, would invalidate the near-term bullish expectation if price moves below the wave (ii) low.
Elliott Wave helps us identify favorable risk-versus-reward structures — and equally important, it tells us when probabilities shift or invalidate. XPEL appears to be presenting one of those favorable scenarios at the moment — a technically sound setup with underappreciated potential.
