Will The True Metals Bulls Step Forward?
In my weekend analysis, I tried to convey a sense of risk. In fact, that sense of risk I was trying to convey was one of which you did not have to take just yet.
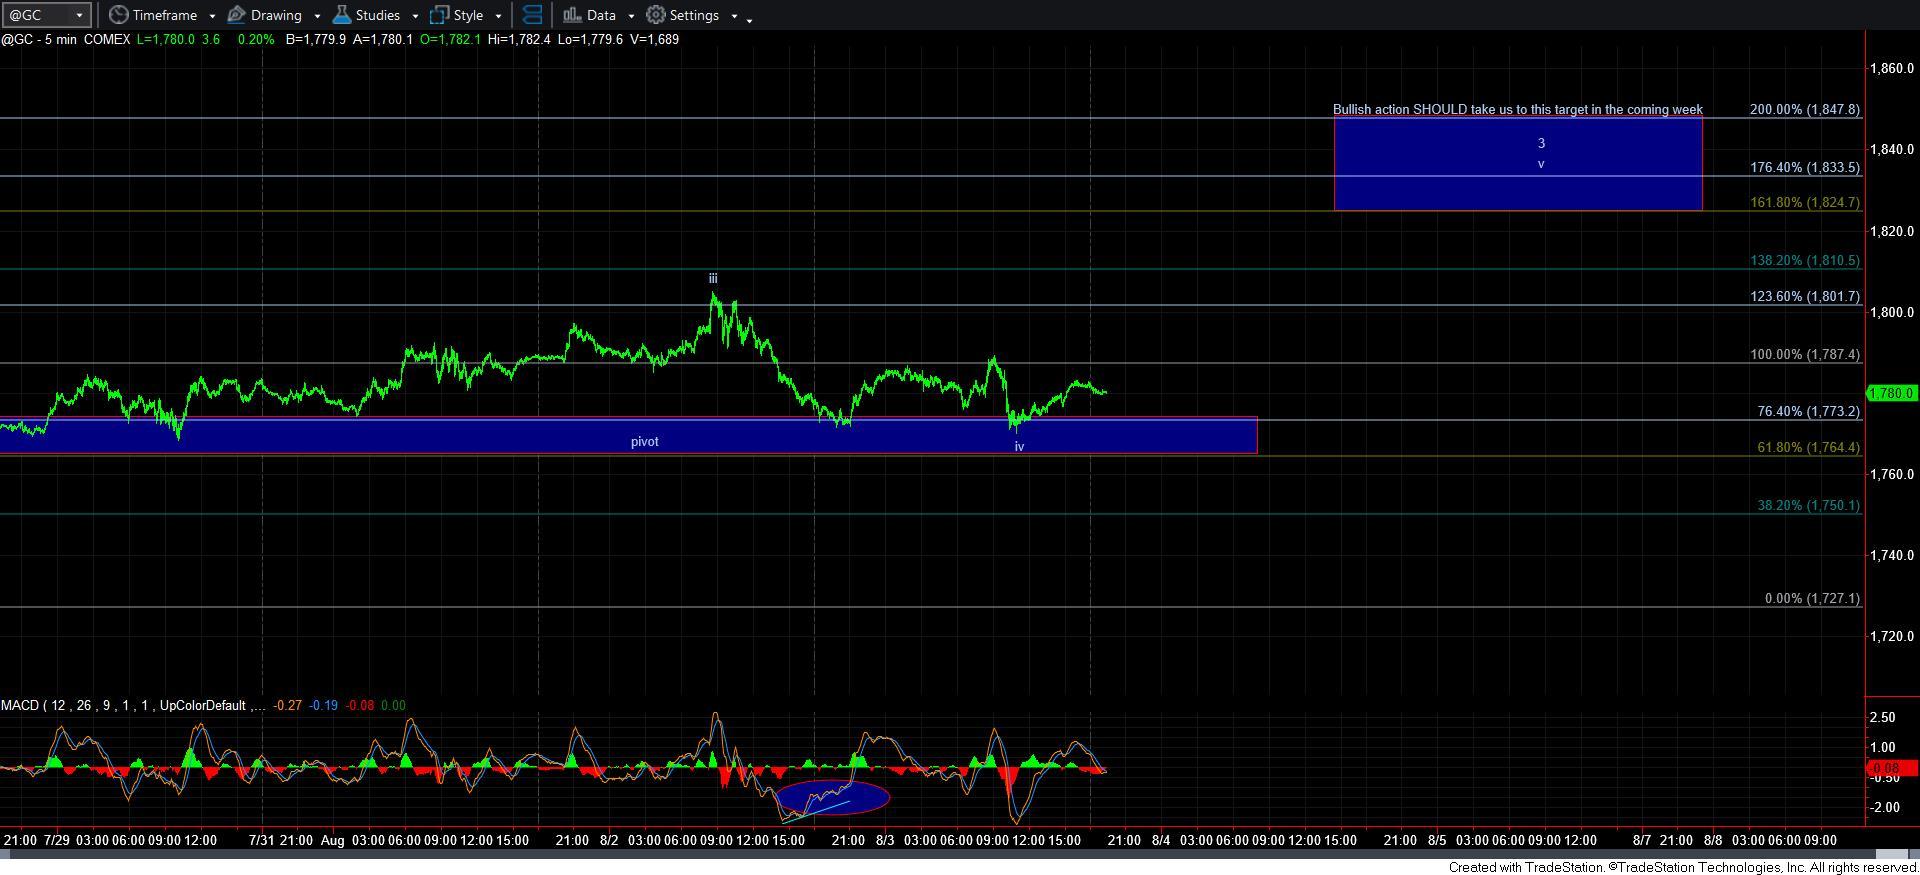
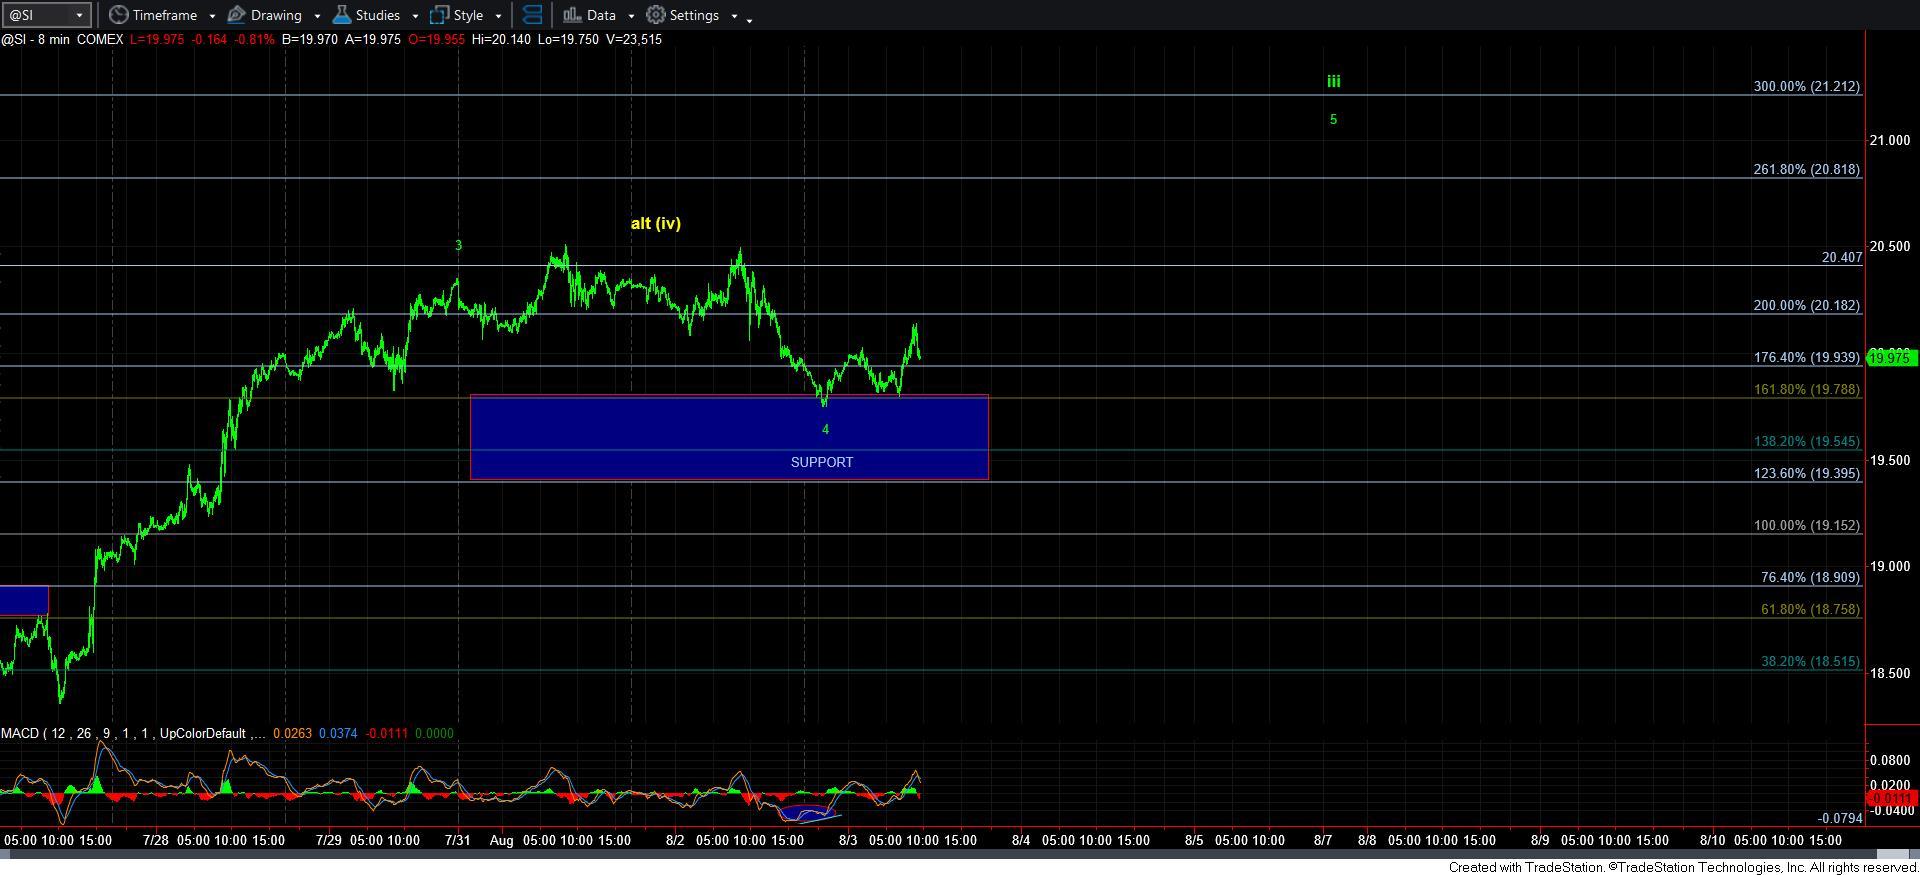
And, now the both silver and gold have pulled back to their respective supports. And, I cannot say that the micro moves off those supports are standard 5-wave structures. But, as long as these supports hold, I can still reasonably “look” higher, but it does not necessarily mean I would trade it to the long-side aggressively just yet. The market must prove a trend change with a completed 5-waves up for me to move towards the aggressive long-side.
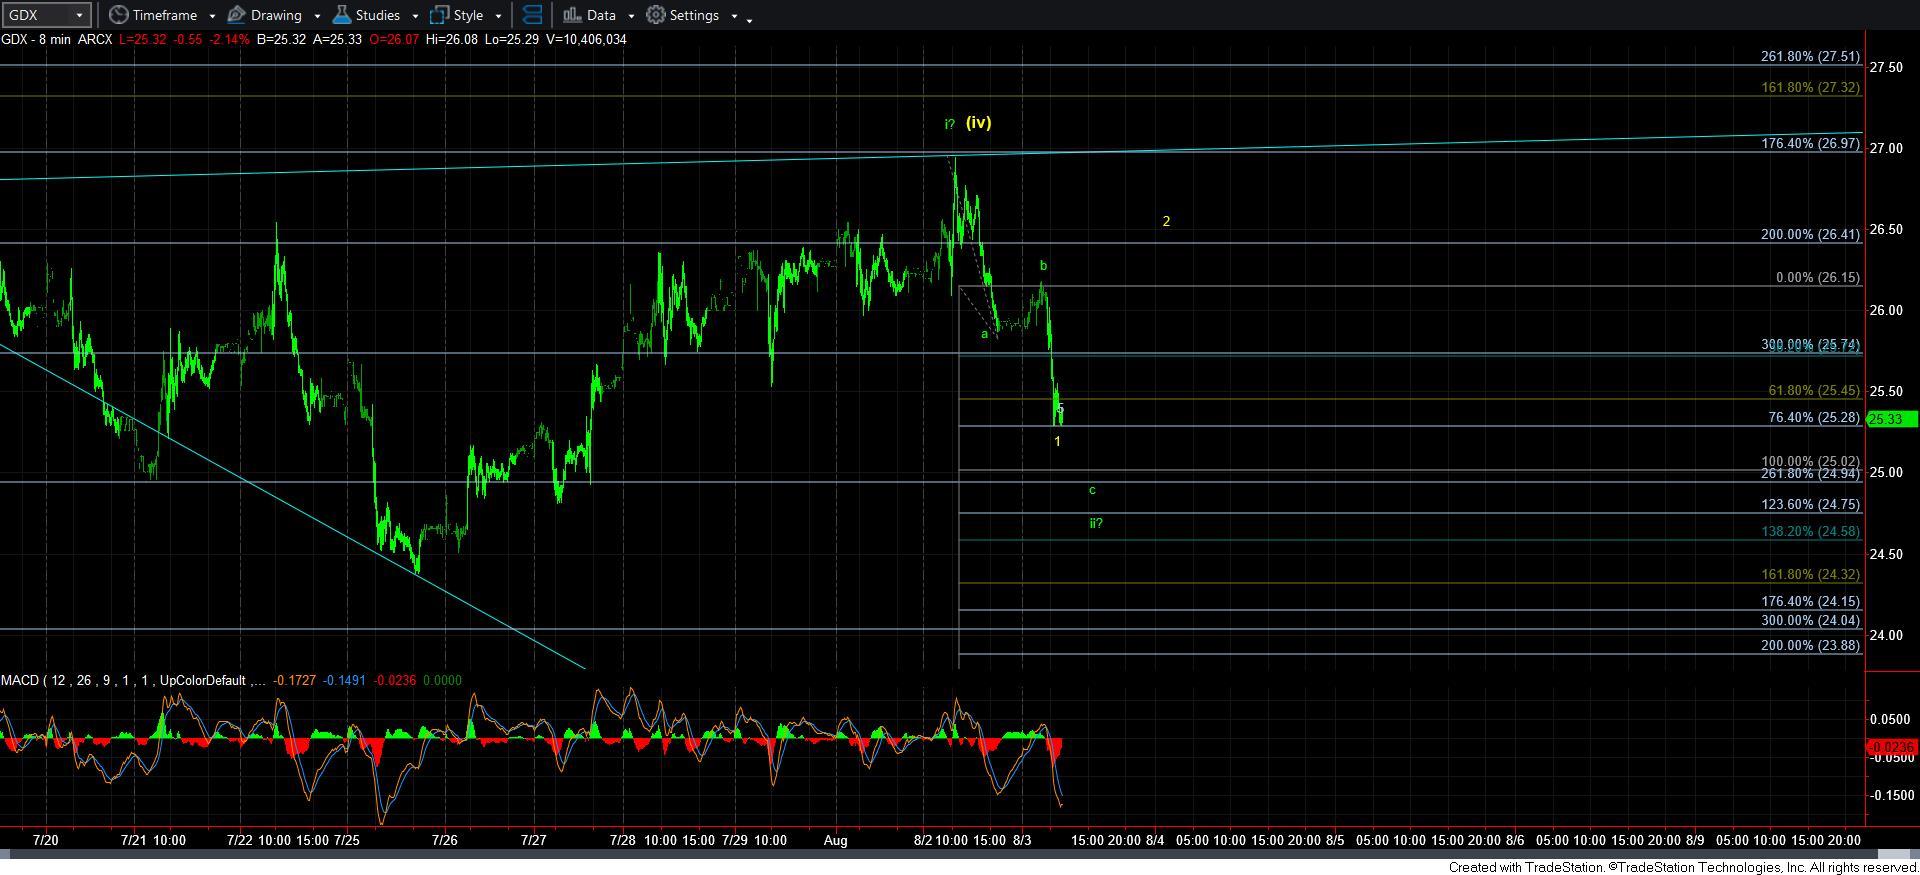
Now, moving over to GDX, we have a very interesting posture the market has taken. As I have said before, I still have no indication that the bottom has indeed been struck. But, I am keeping an open mind as to the potential. And, I have outlined that potential on the attached 8-minute GDX chart.
As you can see, I have a very uncertain wave i high, especially since that rally does not count clearly as a 5-wave structure. But, there is potential for this decline today to count as a 3-wave structure, so I have to at least be open to a possible i-ii structure.
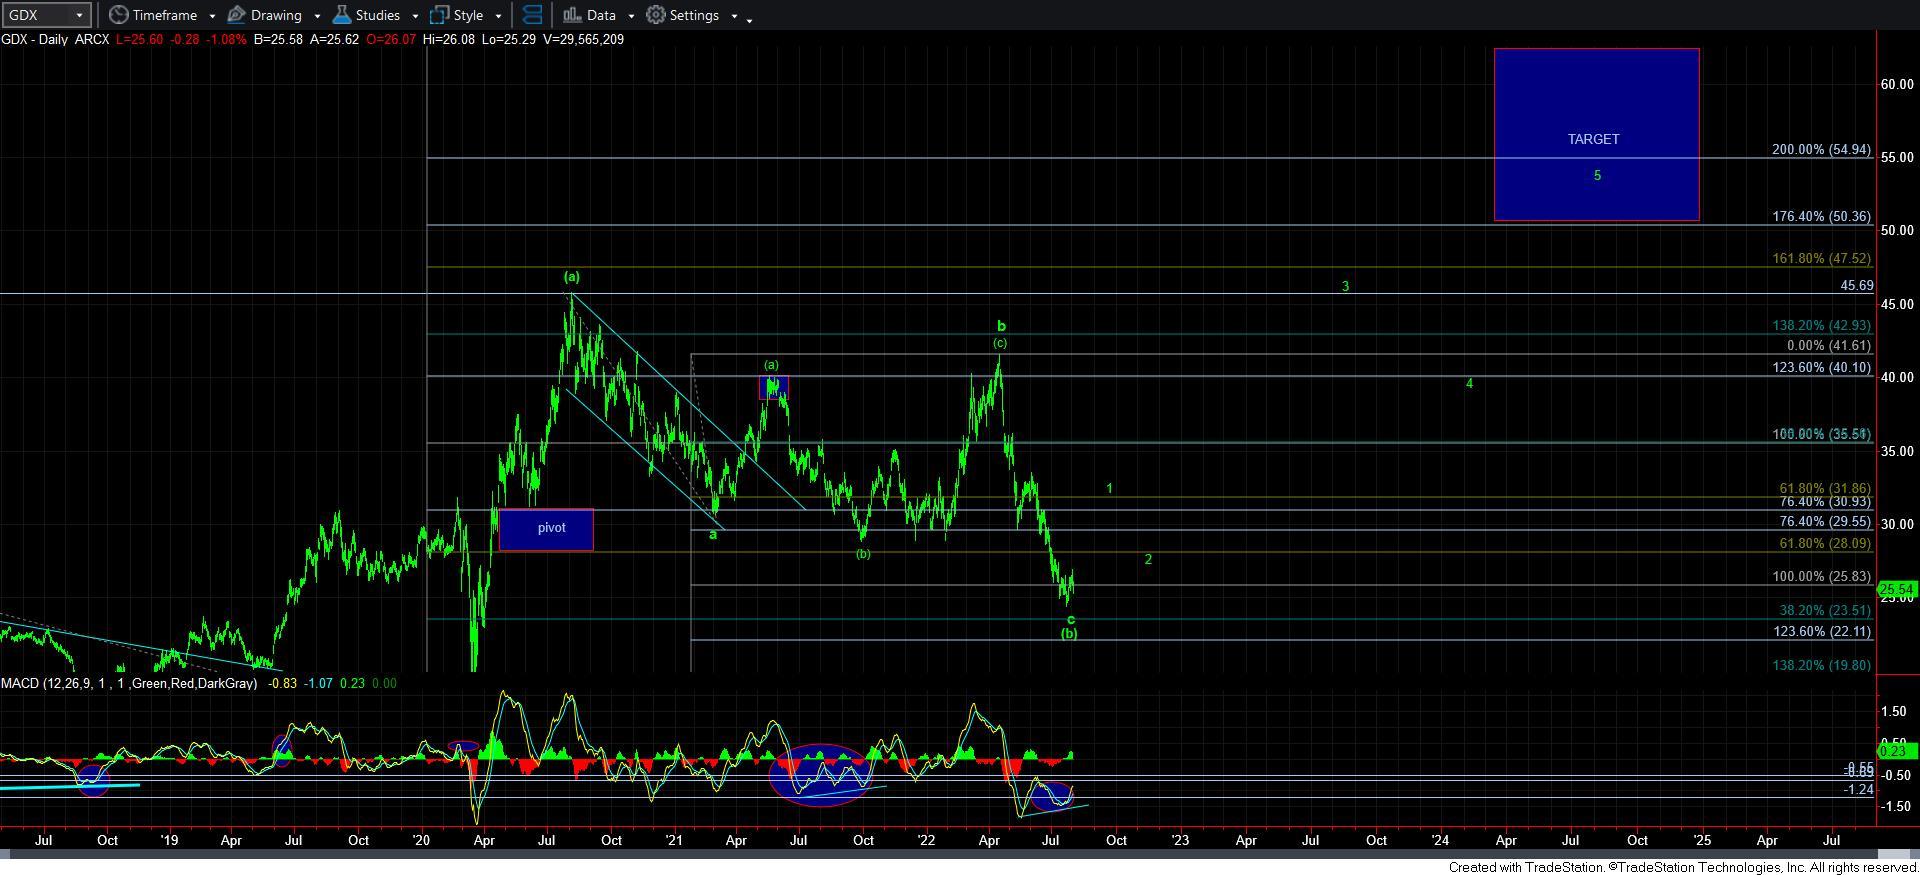
So, let me take a moment and explain how I use Fib Pinball to distinguish between structures. First, there is potential that the decline off yesterday’s high can count as 5-waves down. Normally, the 5th wave within a 5-wave structure does not exceed .618 the size of waves 1-3, sometimes we do see a very extended 5th wave that can reach the .764 ratio. And, that is what we may be seeing in GDX right now. So, if we hold the low struck today, and see a corrective rally in the coming day or two, then I would have to side with this being a 1-2 downside structure in the final 5th wave of the decline in the GDX, which would complete this larger degree c-wave of the [b] wave on the daily chart. And, such a decline would likely target the 23 region.
However, if we see a bit more of a drop tomorrow into the 25 region, then we have exceed the .764 extension and the market more likely is tracking as an a-b-c corrective pullback, wherein the a=c in that pullback. That would give a bit more credence to the i-ii bullish structure, and would clearly confirm on the break out over the high of wave i.
Now, clearly the yellow count must remain below yesterday’s high, even though the market only dropped to the .764 extension. In a minority of times, an a-b-c structure can have a c-wave at the .764 extension of the a-b structure. So, we need to see a corrective rally tomorrow which remains below the high struck this week to maintain the downside potential in the yellow count.
In either case, holding over 25 and breaking back over the high struck this week would point us to the 30-31 region to complete wave 1 off the lows. And, it would likely mean that the GDX is moving into a “catch-up” mode to silver and gold, and would likely outperform on the break out over this week’s high.
So, overall, the market has still not proven that a final low has been struck in any of the charts we track. If it chooses to do so, it will likely provide us with a strong rally in the coming days, most specifically in the GDX, as that has been the lagging chart thus far. And, until we are able to take out the high struck this week in the GDX, I am still view the potential for a lower low as a higher probability than I would prefer at this point in time. And, should we break out over this week’s high, then we should be off to the races, and starting a major bull run that should last well into 2023.