When the Mood Actually Cools Down
 By
By
Caution: this might be a little too "out there" for some people. Please don't read this if you like the way you understand reality and don't want it stretched or challenged.
- - - -
For several weeks now, there has been data pointing to the end of last week and beginning of this week as a time to watch for major shifts in sentiment and events with a serious tone. A map posted last week from this data, instead of highlighting an isolated area that would have signaled a single specific event to watch for, showed a general region of focus.
Watching the daily data for more specific timing of this shift, there was a crisis alert for this weekend, with a general focus on the area highlighted by the map, and specifically, per the news cycle, the Memphis police force. Yet, a "serious event watch" more directly matching the weekly pattern, is also showing in the data for Monday and Tuesday (Jan. 30-31). In a post on Saturday morning, in the section "For the Extremely Curious" near the bottom of the report, it was noted for Jan. 30: "High Controlled, low Manic generates a "serious event watch;" with the addition of Expansive/Vulnerable together, a 'natural event watch.'" This was expanded to Jan. 30-31 in Sunday evening's post.
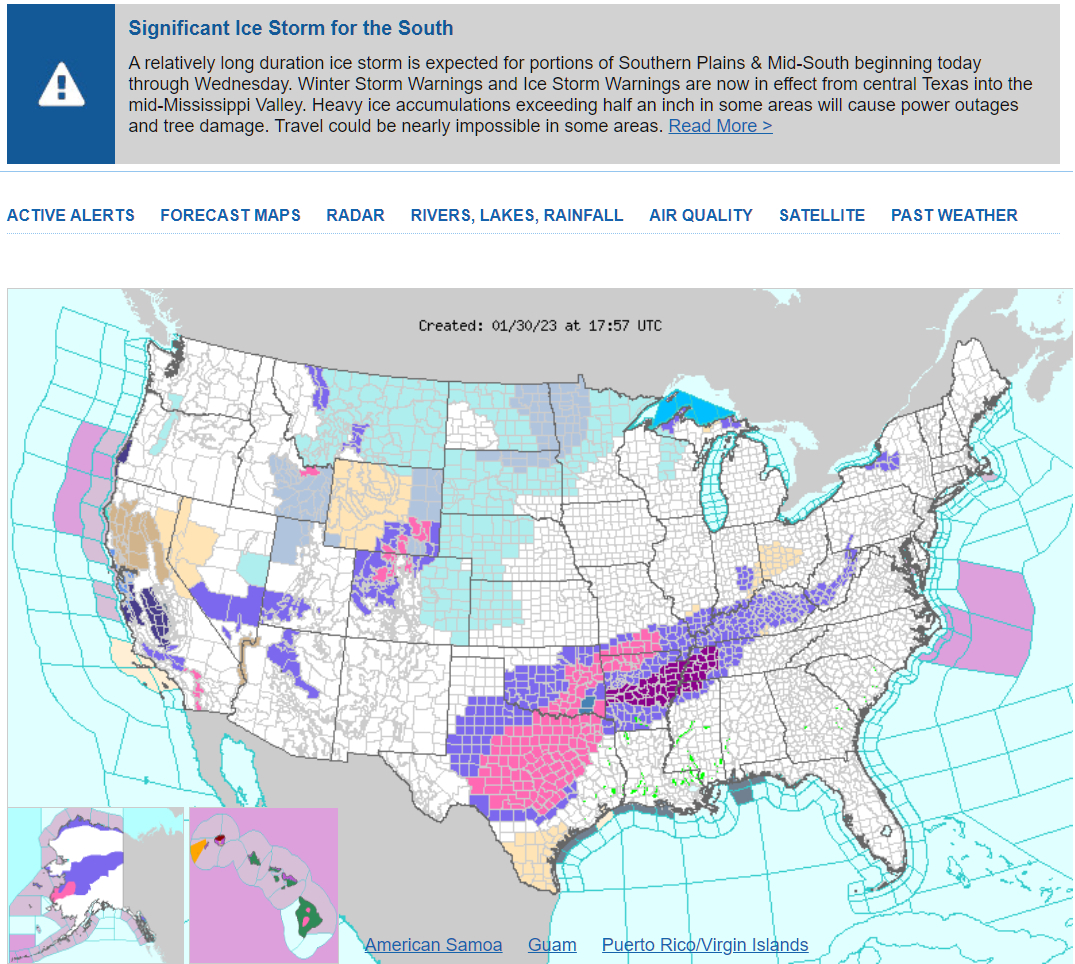
I just saw this news article on an ice storm sweeping the country through Wednesday. I checked the National Weather Service, and saw this map (below). Does it look familiar? The map posted last week is included below that for reference. Following that is a brief explanation of what's behind the data and the maps shown here.
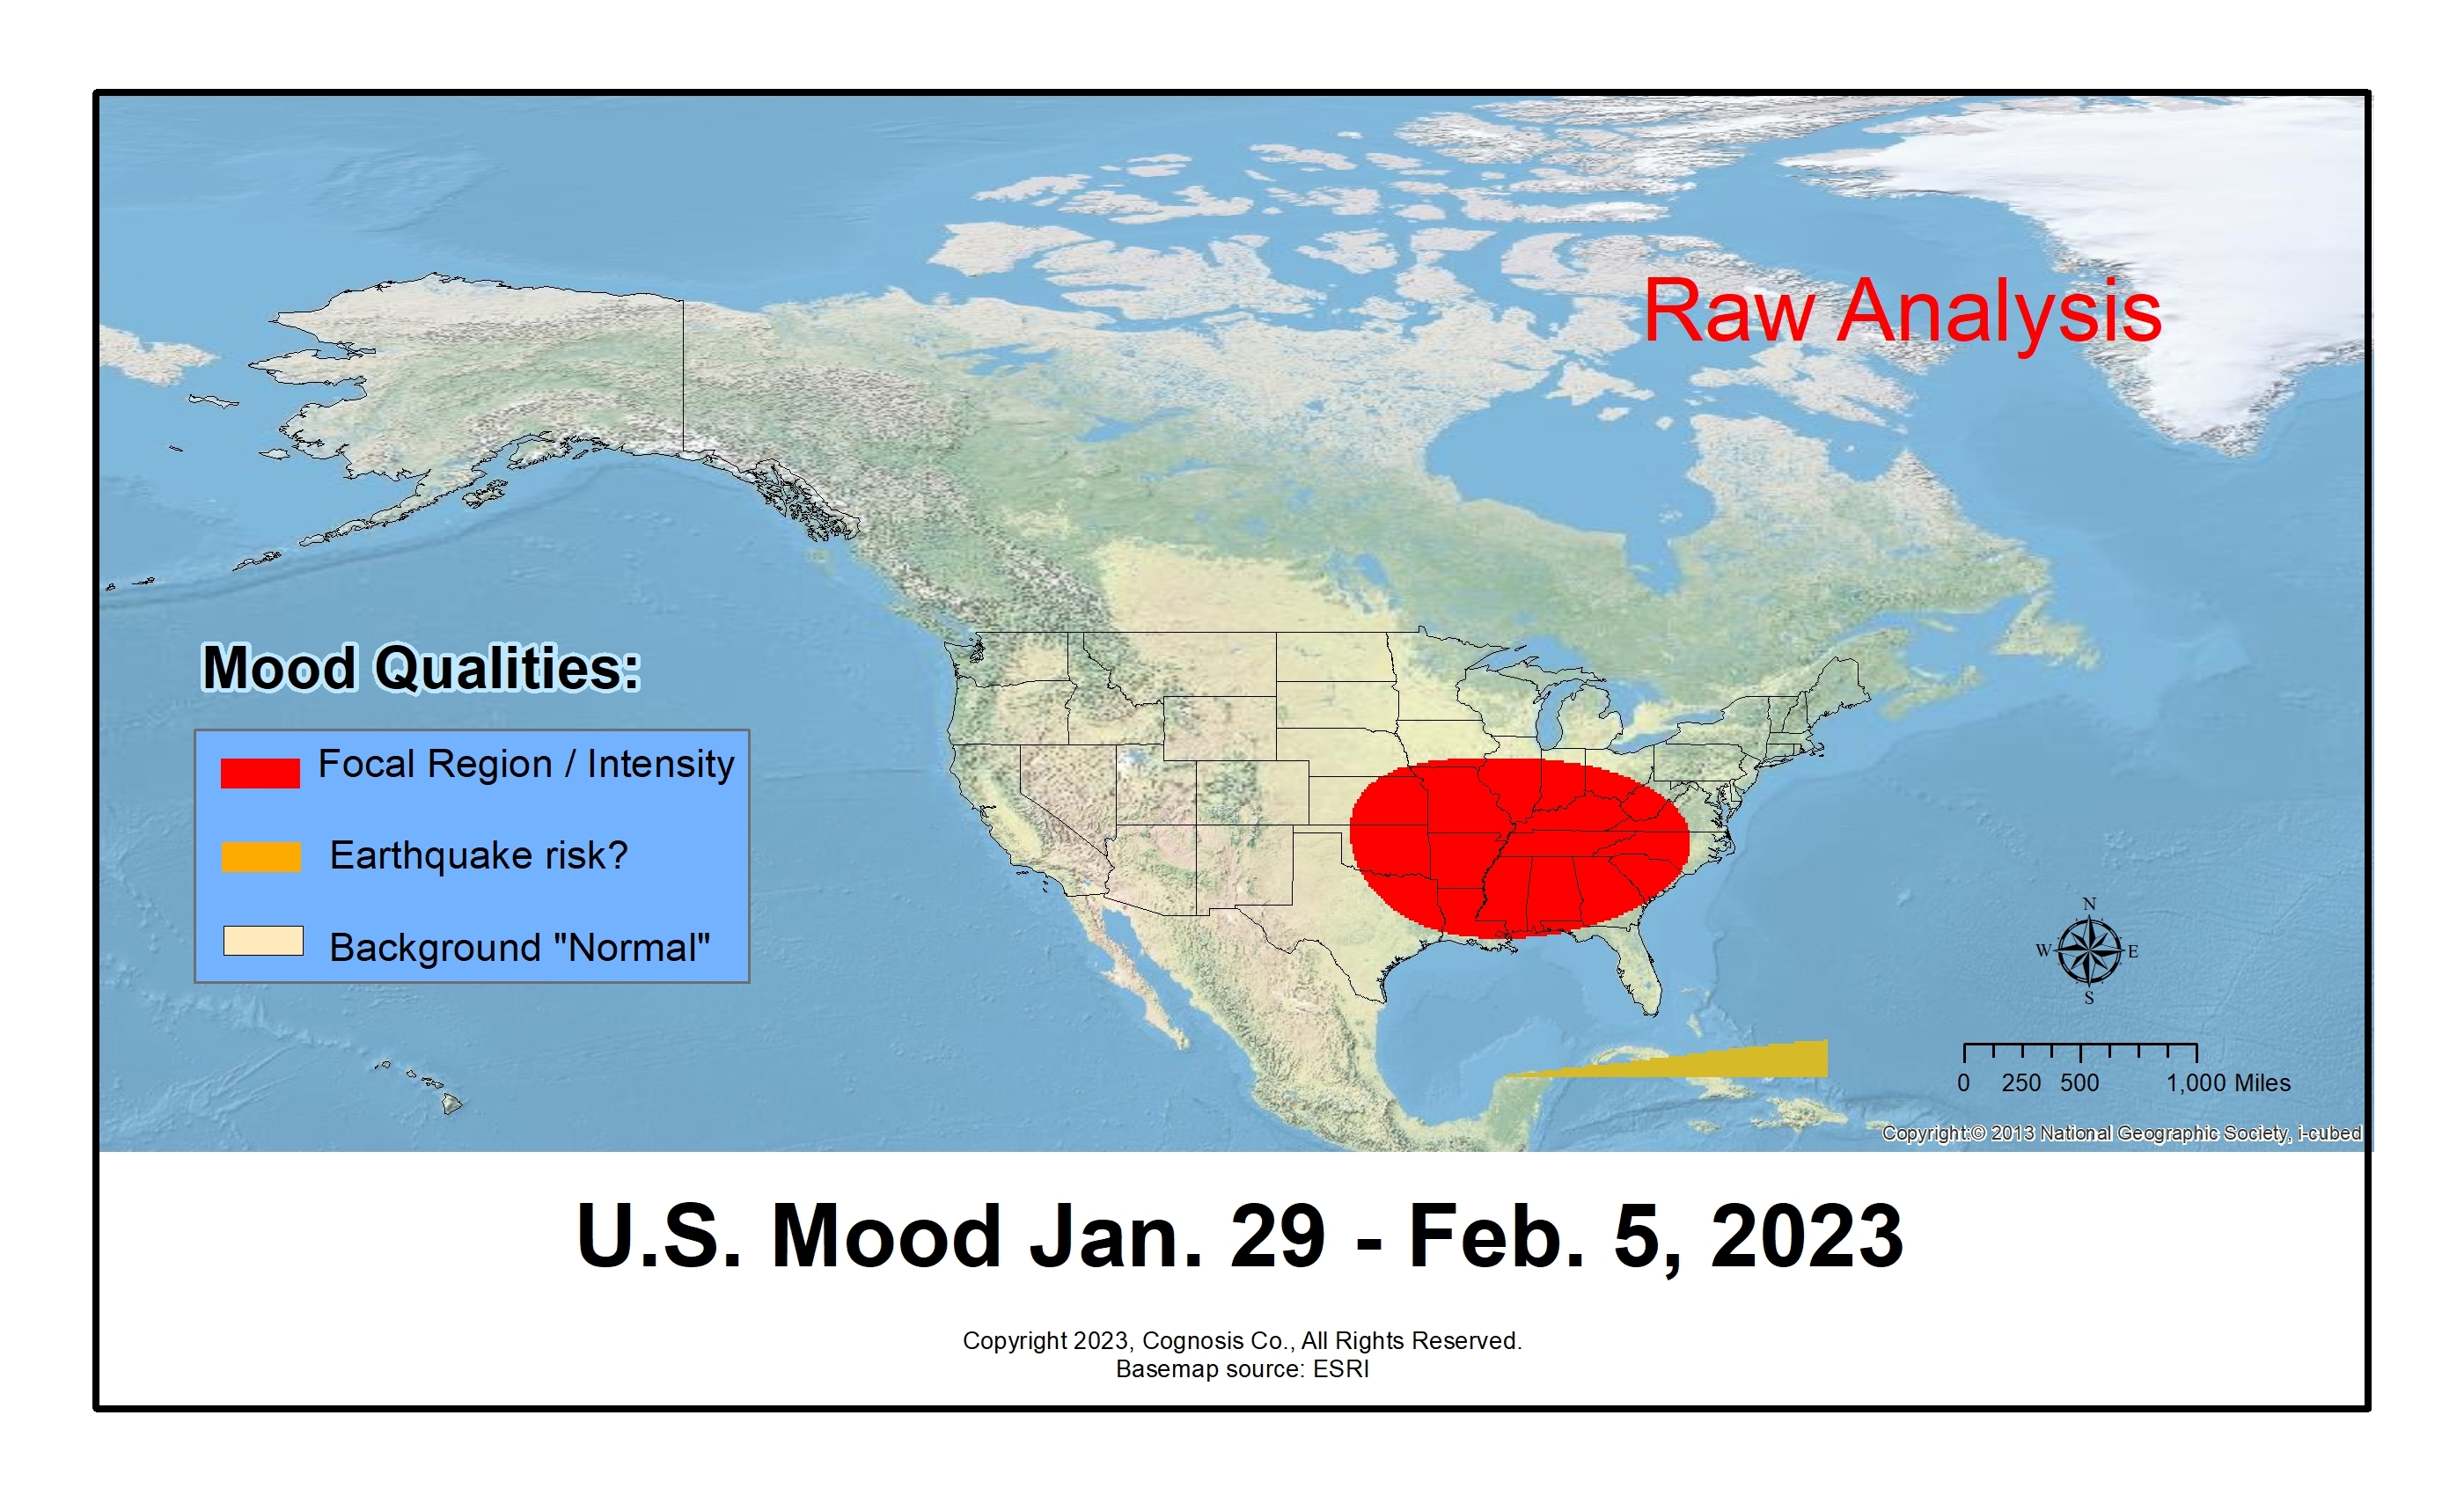
Where does the source data from this map come from? The source data comes from daily topmost internet search trends. For some reason, what we are collectively focused on precedes events in the news. This same data is used as input to our MarketMood algorithm because market movement also lags behind collective sentiment and can be calculated by coding the themes of what we are focused on and putting that into a formula.
How do you get a map from search trends? Search trend data is available by state and by country. Looking at data from a few states, we can generate a U.S. map using GIS (Geographic Information Processing) software.
How do you get a map of the future? It’s a map of the present themes people are focused on. However, by knowing that events will tend to show up in the world along the lines of these themes a certain number of days or weeks (or more) after this collective focus, we can put a future date on the map. It’s the date or time range of when certain themed events would be expected to show up.
Hope you enjoyed a mind expanding moment. If you are in this area of focus this week, stay safe and stay warm!
