What's Next For The U.S. Dollar After It Hits Its Target?
 By
By
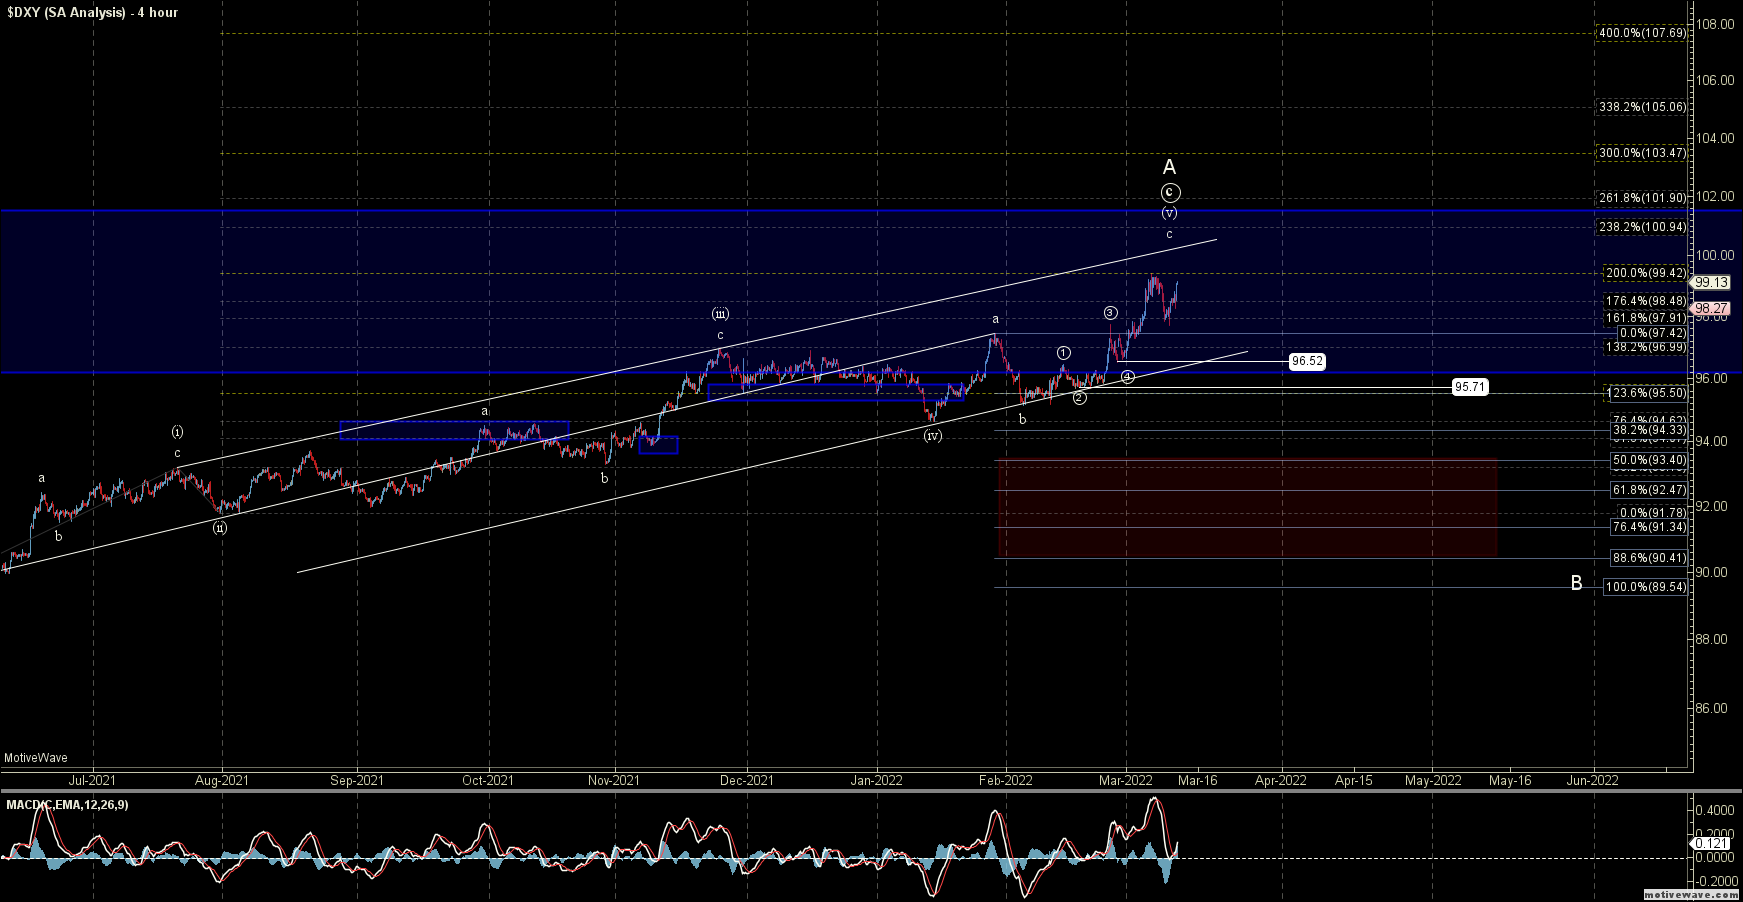
After pushing higher last week we saw the DXY move lower off of that high only to find a local bottom late in the week and push back up towards the high struck at the 99.42 level. The initial move down off of the 99.42 high, which I had noted last week as the next key overhead fib, can certainly count as a full five-wave move to the downside which could be an initial signal that we have put in a top in what I am counting a very larger ending diagonal up off of the 89.14 low. I will note however that with the push back higher we have broken through some key upside resistance as we re-approach that 99.42 high which is making the already top in place questionable. With that being said whether a top has already been struck or whether we still need another push higher I do think that this is likely close to a significant top which will likely see a very sharp reversal back lower towards that 89.14 level. So with that, I still think that caution is still warranted to the upside at these levels as the risks to the upside are still quite significant at these levels.
From here and to give us a signal that a top has indeed been struck we would need to see this break back down below the 97.71 level followed by a break under the 95.71 low. This reversal should be quite sharp on both the smaller and larger degree timeframes as again we an ending diagonal pattern formed both off of the Feb 2021 lows as well as the Feb of 2022 lows.
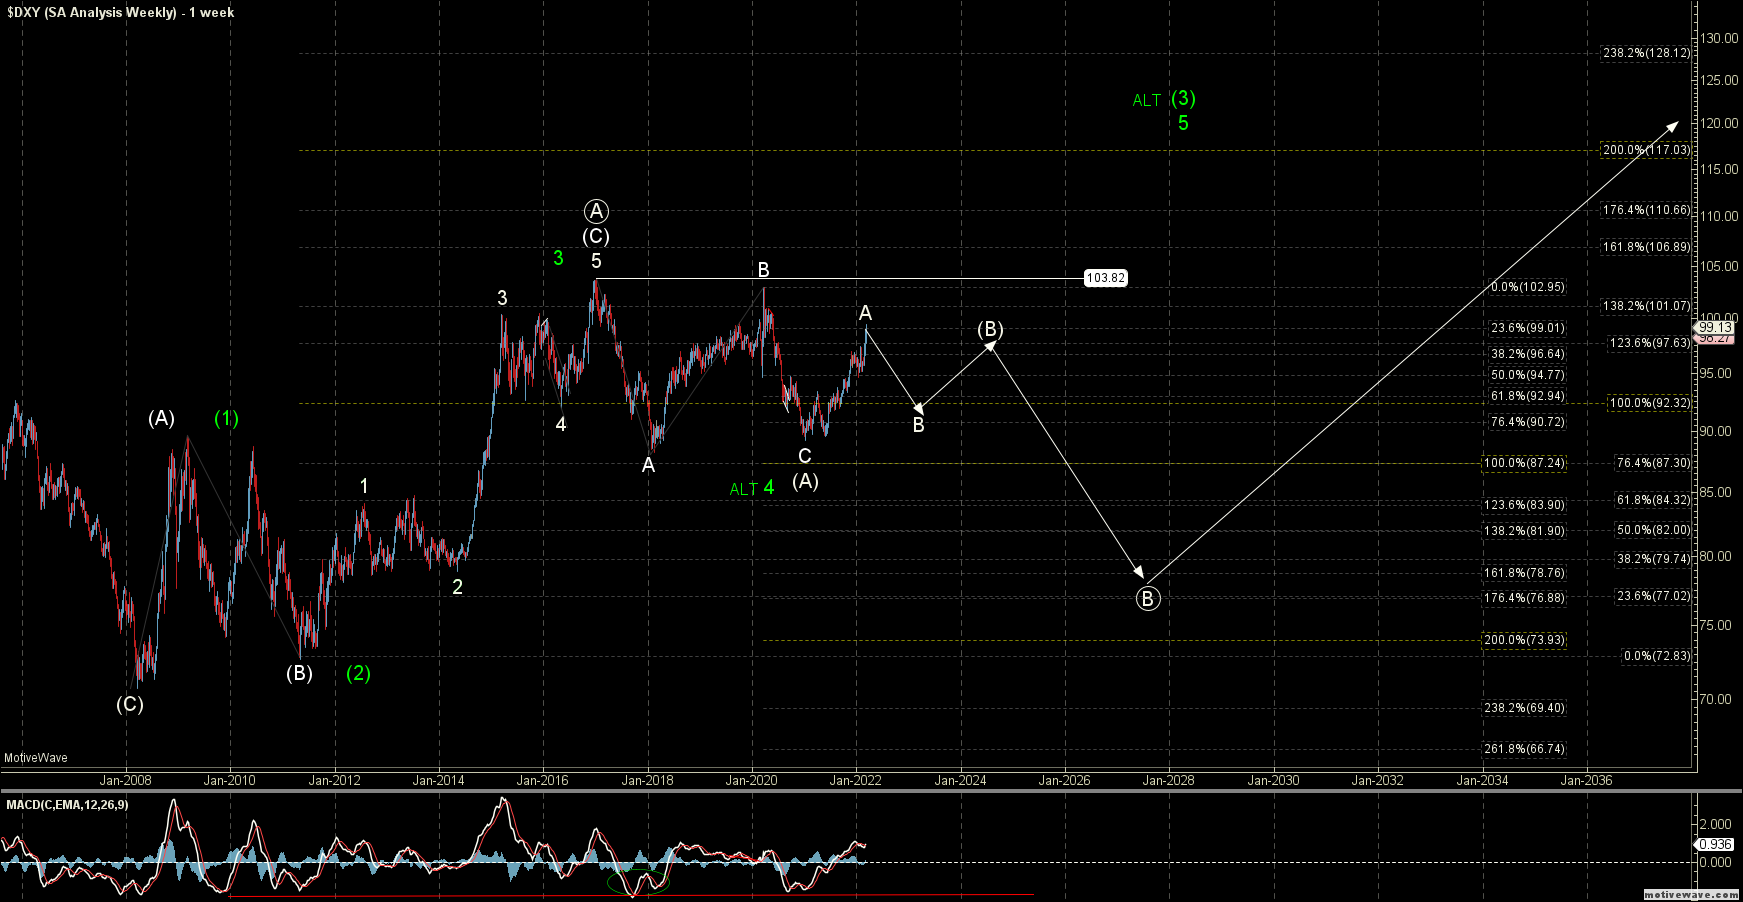
If we fail to see a sharp drop lower but rather a slower and more flat move lower then it would suggest that we have not put in a top in all of the wave A just yet and may still need to push a bit higher before forming the final top of the larger degree pattern. If we do continue to push higher over the 99.42 high that was struck this week then I would still count this as part of the larger degree wave (B) as shown on the weekly chart but I would have to start considering this starting to complete all of the wave (B) rather than just the wave A of that (B). I am going to take this one step at a time however and focus on the primary path which has this topping in the wave A of (B) and will be looking for a turn before that 99.42 level.
Bigger picture should we begin to see a larger breakout over the 103.82 high then I am still allowing for the green count as shown on the weekly chart which would have this bottoming in a larger degree wave 4 still needing another push higher for a wave 5 of larger wave (3). I have several issues with this count and only would consider it reasonably probable should we really being to breakout over that 103.82 level and unless that does occur I still think this should resolve lower as laid out per the white count on both the four hour and weekly charts.
Overall this has been following the larger degree path that we have laid out quite well over the past several years and we are not getting to the point in which we should begin to see a larger degree turn and in which I think caution is certainly warranted. While the next turn down is likely to be sharp if we are indeed following the larger degree pattern as laid out in white on the charts we should actually be stuck in this larger degree sideways range for another couple of years. This is a fairly wide range so there will be opportunities to trade within that range but I do think that the larger degree breakout or breakdown is still a few years away.