What The Heck Is Up (or not up) With Silver?
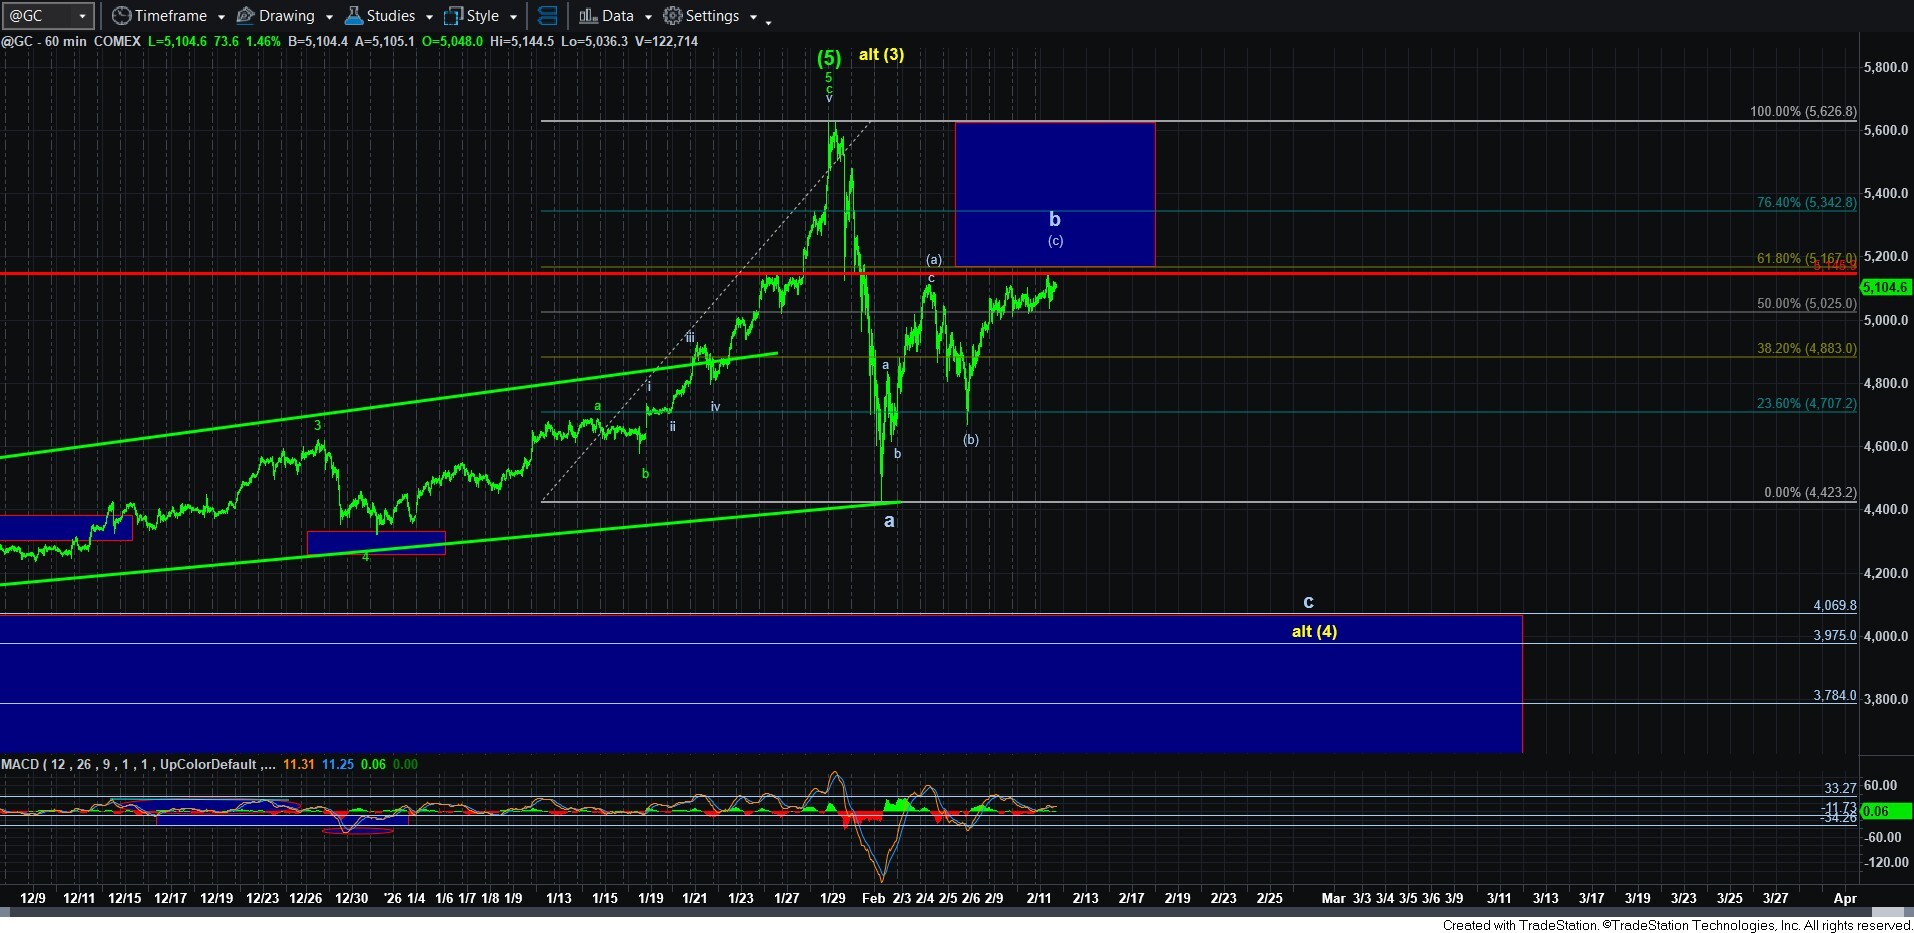
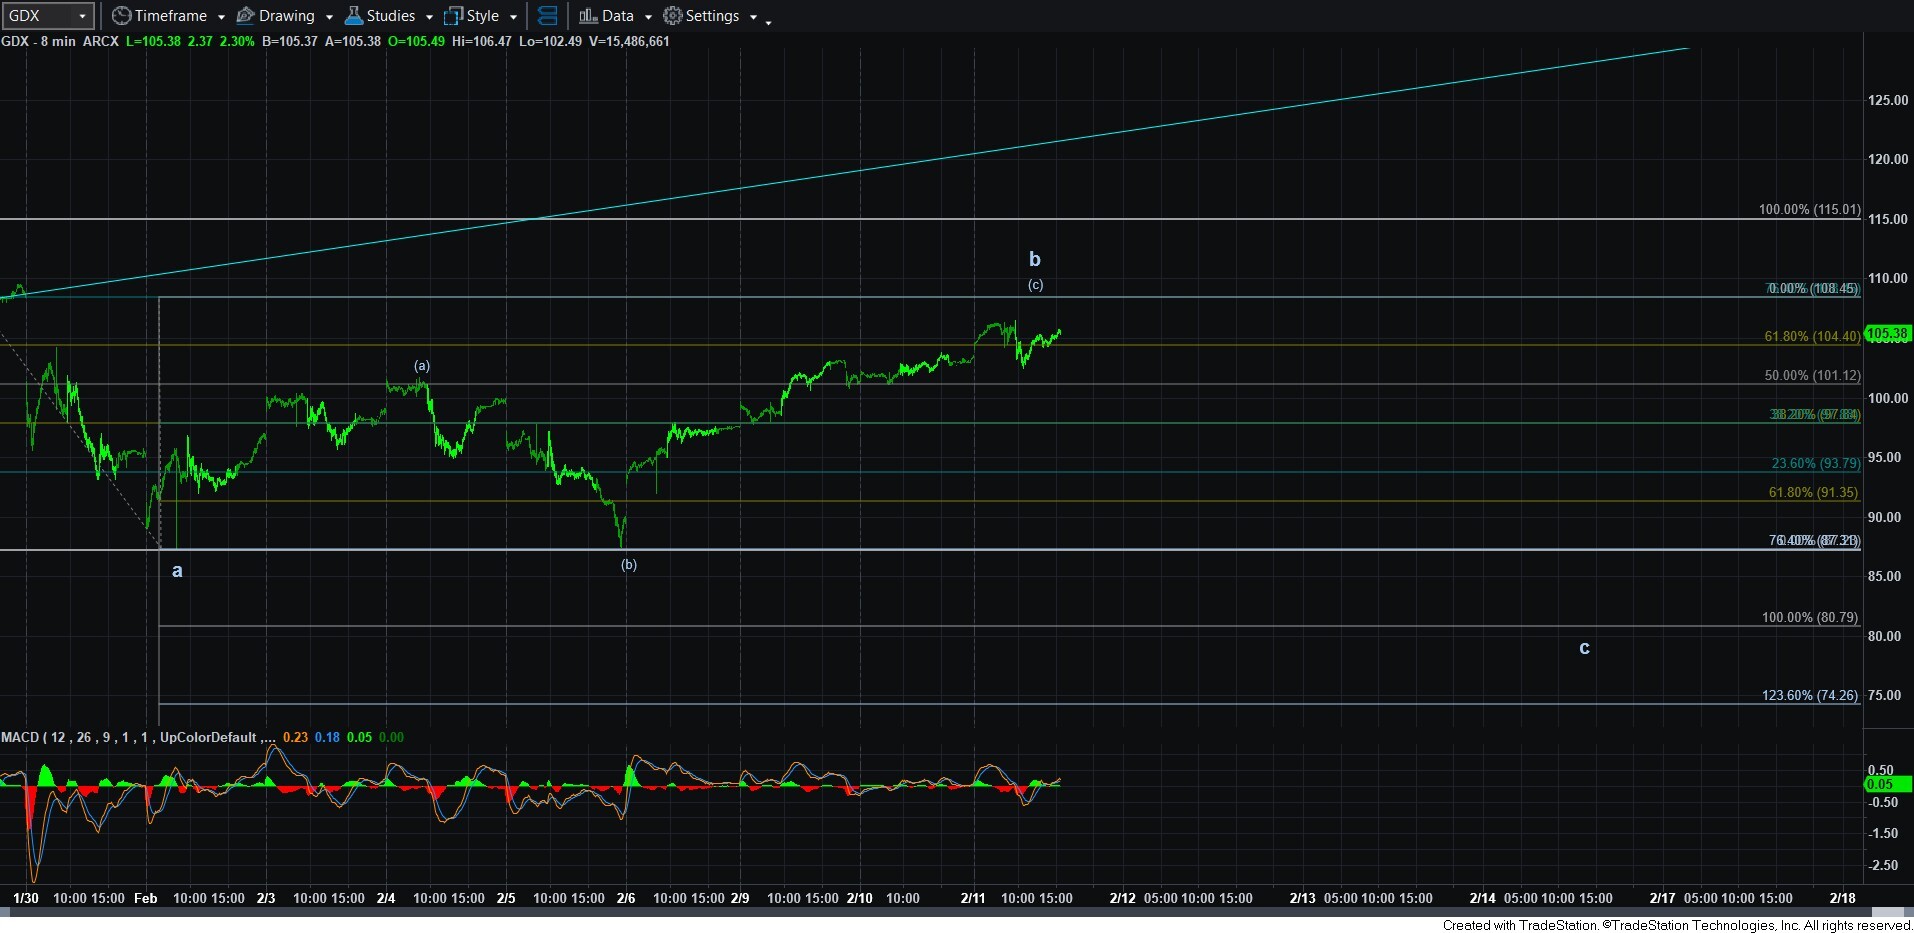
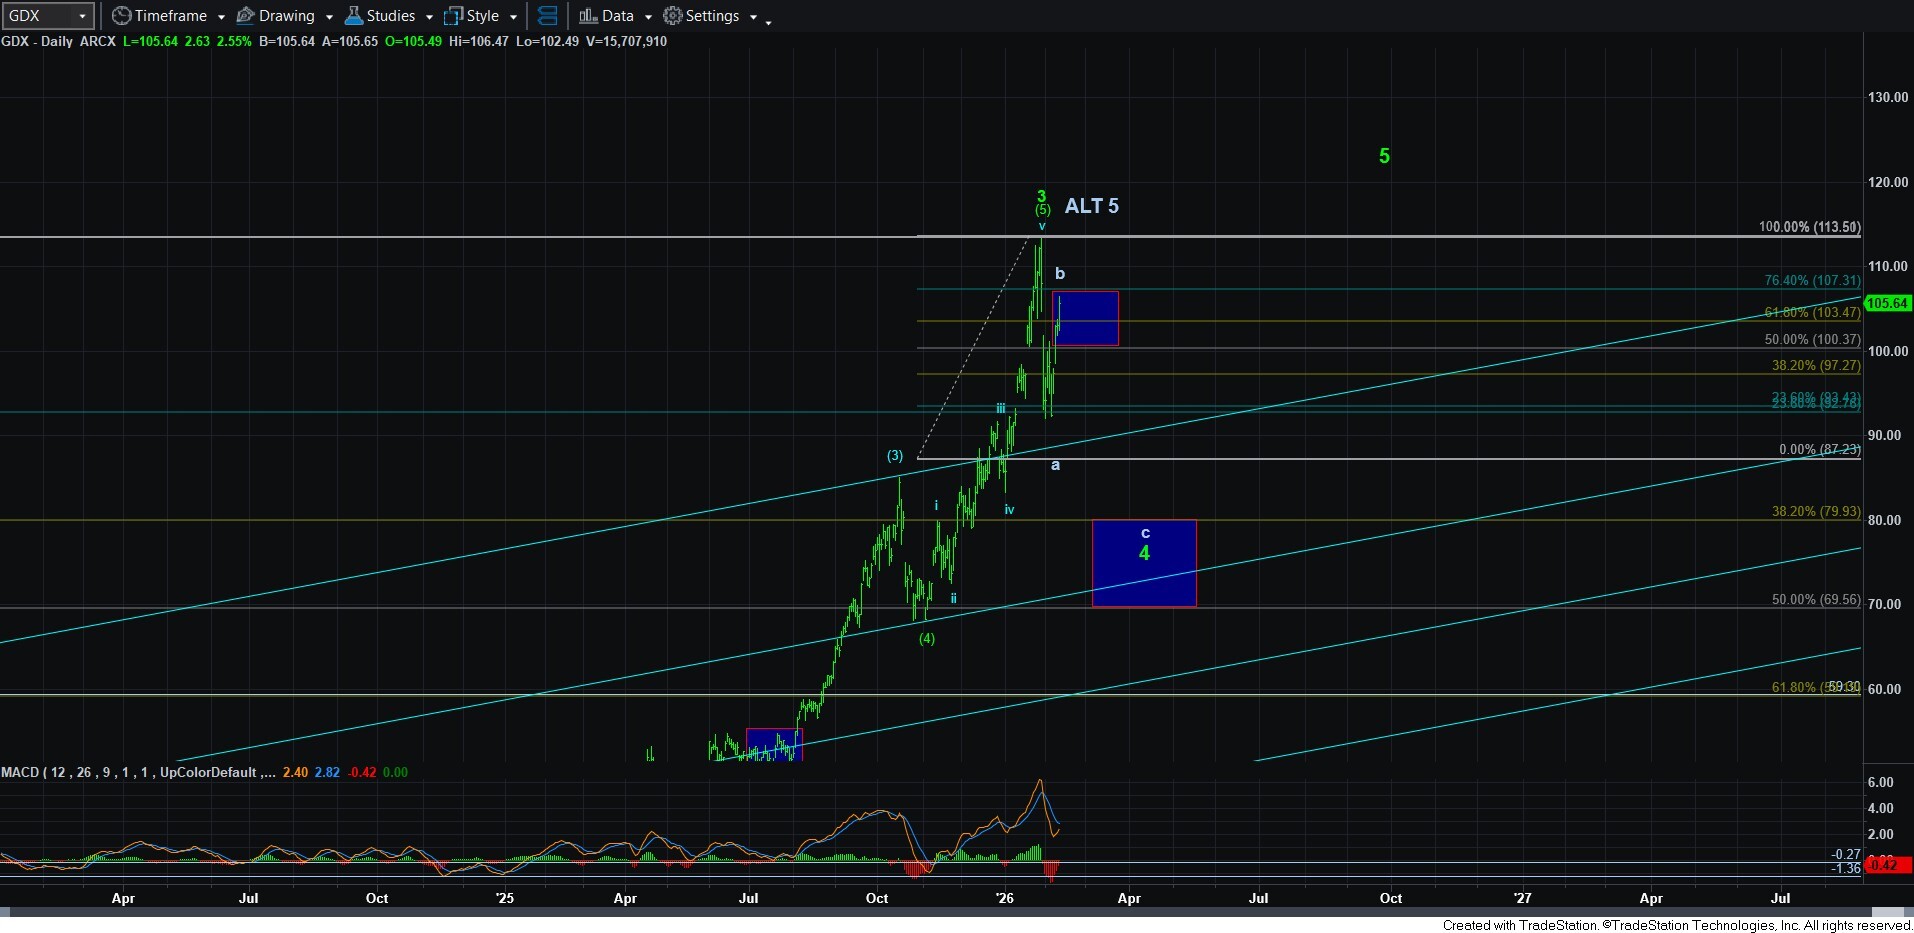
While both gold and GDX have seen very nice corrective bounces thus far, with GDX approaching the .764 retracement of its initial decline and gold approaching the .618 retracement of the same, silver has only mustered a move to the .382 retracement region.
The question on my and everyone else’s mind is how do we read this? If I were looking at gold and GDX in a vacuum, I would be shorting the crap out of those two charts. But, with silver seeing such a weak bounce, it makes me wonder whether silver’s weak bounce thus far just the start of a bigger bounce? IF we answer this question in the affirmative, then it would suggest this is just a larger (a) wave bounce in a bigger b-wave rally.
If I may remind you, in order for me to even retain a “reasonable” alternative count for silver as presented in yellow, we would need a much larger b-wave bounce to be able to support a c-wave that would not really break down below the a-wave low. A top here would almost definitely project us to sizably break down below the a-wave low, and it would make it a VERY high probability that silver has indeed topped.
So, with the potential that silver MAY still push higher and drag GDX and gold with it, this is why I am seeking a CLEAR 5-wave decline in both GDX and gold in order to consider shorting those charts aggressively for a c-wave decline. A 5-wave decline will make it much more likely that this b-wave rally is done, and a c-wave decline has begun.
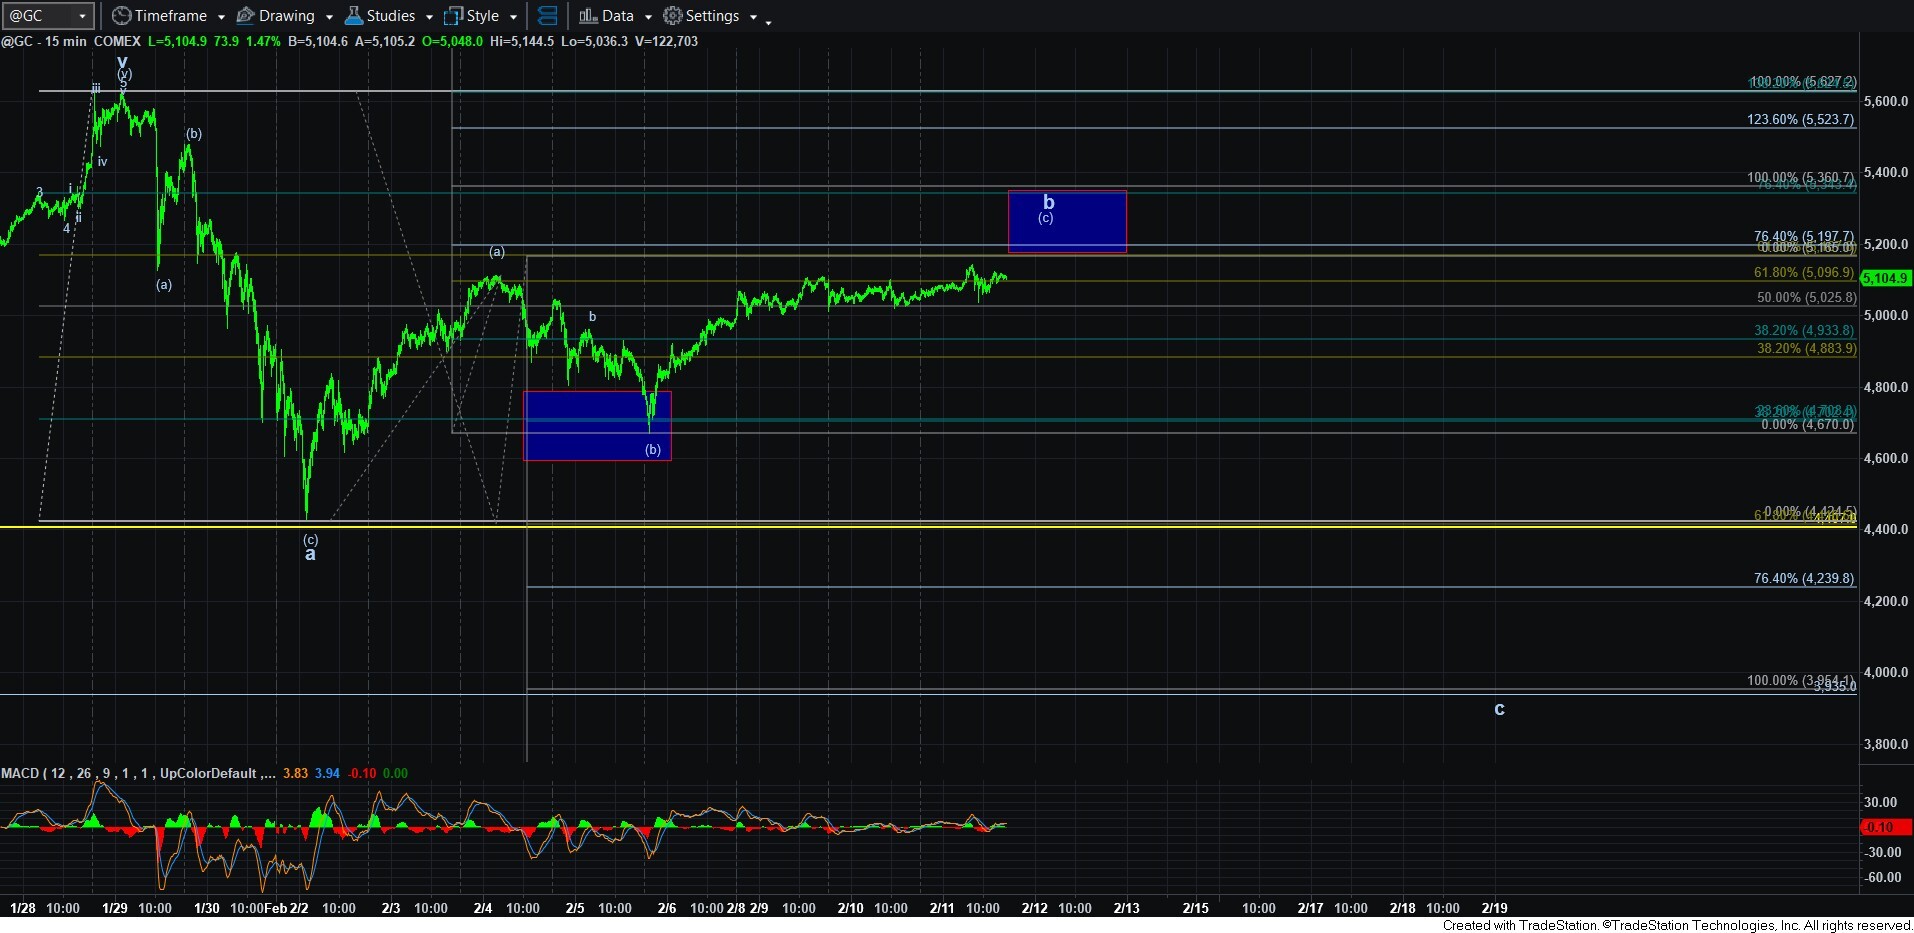
Despite this question, I would still like to make an interesting additional point of confluence in the gold chart. We are now approaching a major resistance region, as you can see noted by the box overhead on the 15-minute GC chart. Right overhead is the .618 retracement of the a-wave, which also provides us with a (c)=.764*(a) proportion, with the top of the box being the .764 retracement of the a-wave, wherein (a)=(c). Clearly, this is a strong resistance region for this gold bounce.
And, as I said earlier, silver is only at its .382 retracement. But, I cannot make out a clear 5-wave decline yet in the silver chart. And, GDX is approaching its .764 retracement and there is a POSSIBLE micro 5-waves down from today’s high. But, it is not reliable enough to make it a high probability that this rally has completed.
So, for now, the key is going to be a 5-wave decline in the various charts we track. Beyond that, there is not a lot more that I can add to the analysis I have been providing this week.