What Should Be The Final Decline In Metals
This is the one for which we have all been waiting - the lower low we have been seeking across the board.
Yet, I do not want to make it seem like this decline is yet complete. Rather, I think we have at least one more lower low within this 5th wave, but potentially two more lower lows.
Allow me to explain.
In my analysis, I have often tended towards the chart that has the clearest wave structure for clarity. Recently, I have been using silver and GDX, since they were providing us the clearest picture of those lower lows that I was expecting.
However, now, I am going to switch over to GC and GDX, as their downside structure seems to be the cleanest from the three I am tracking in the smaller degree.
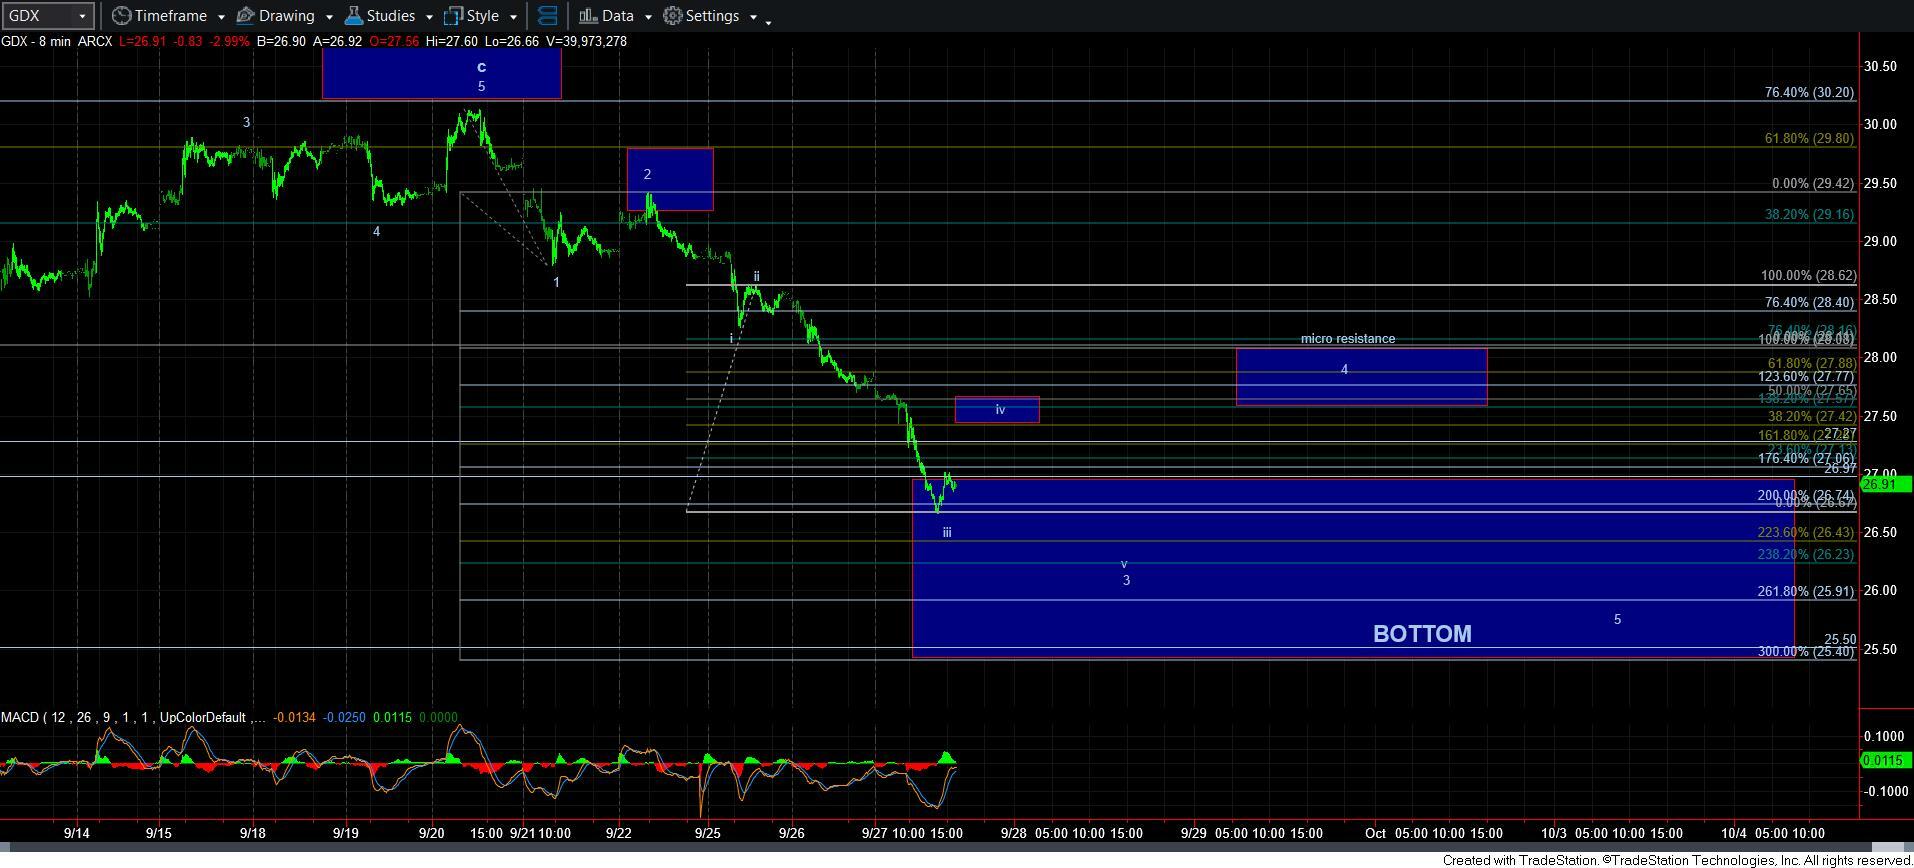
As you can see from the GDX chart, the boxes overhead were almost perfect in identifying the turning points that set up our expected downside follow through. And, based upon the downside structure, I have to assume we are in wave iii of 3 of the final 5th wave to the downside. I have added a resistance region for a potential wave iv of 3 bounce. But, please note that this is simply a resistance region, and not a certainty that we will rally up to that region.
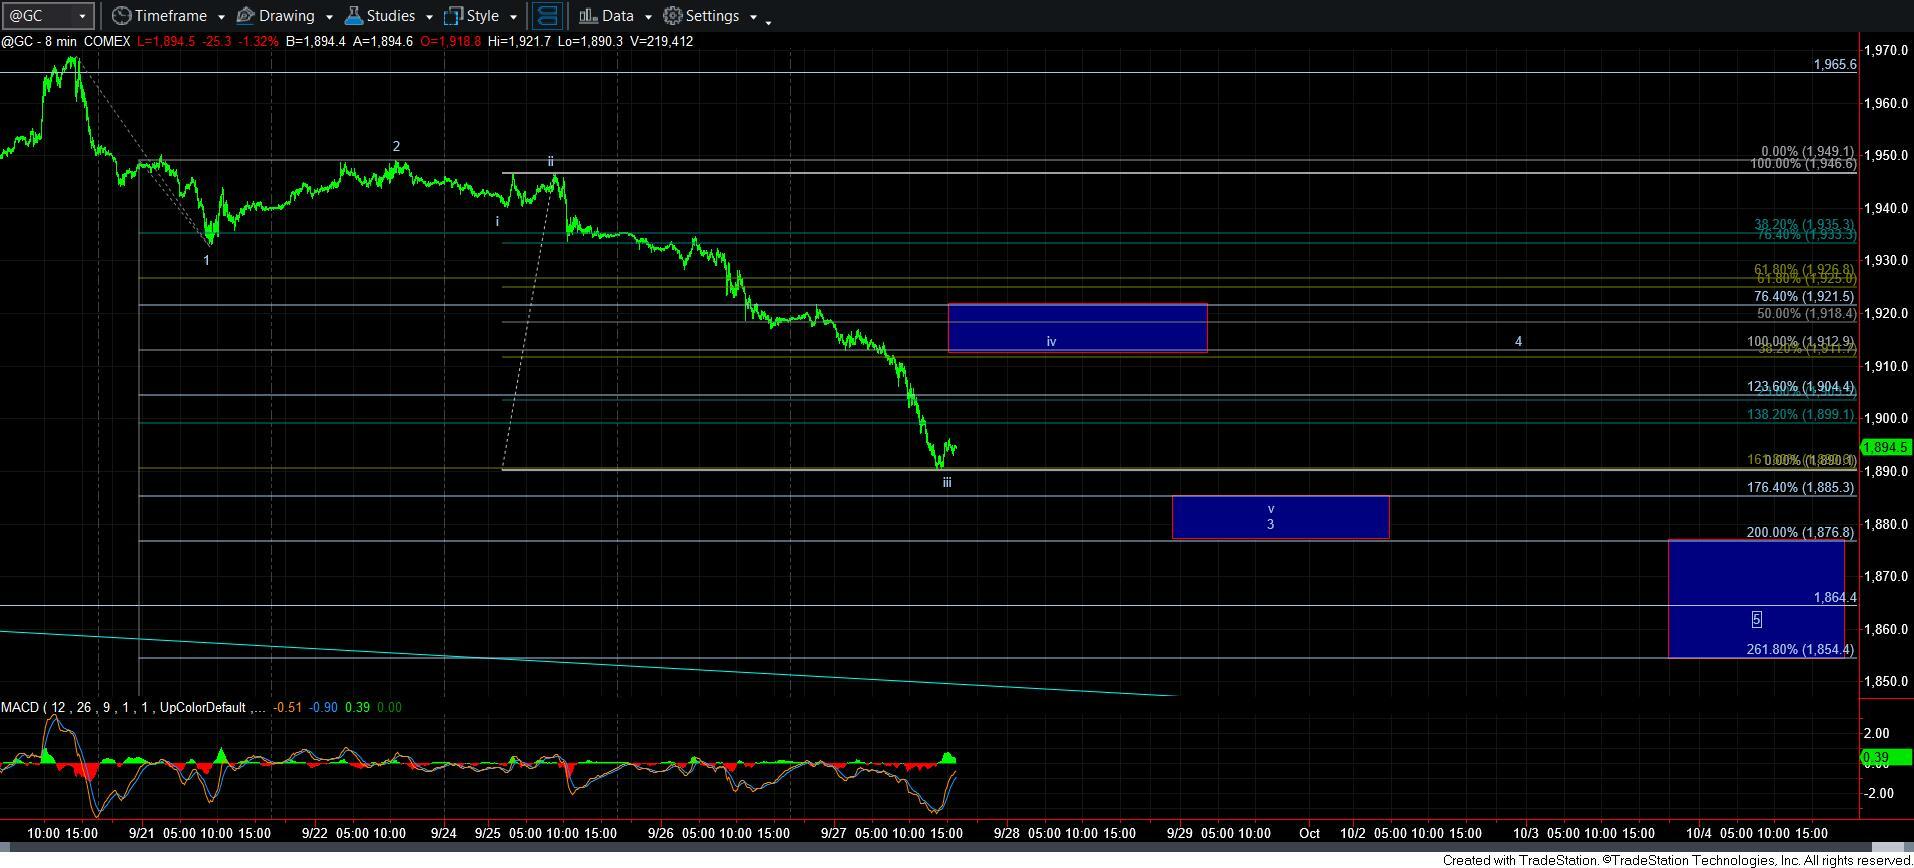
As you can see on the attached 8-minute GC chart, I had to make certain assumptions, since the downside structure is not the clearest of 5-wave structures. Yet, the Fib levels seem to work out rather well. This direct decline seems to have bottomed at the 1.618 extension of waves 1-2. Normally, that is the target for wave 3. However, metals often see extended wave structures. Therefore, I think it is reasonable to view this decline as wave iii of 3, similar to GDX. That then sets our resistance overhead for wave iv at the box overhead shown on the chart. While I cannot guarantee that we will rally that high, that is the general resistance region I would expect to hold on a wave iv bounce.
Again, these are micro counts, so I am not trying to trade the upside with these counts. Rather, they are to be used for those who are trying to short these various degrees, and using the resistances for risk management purposes.
The main perspective with which you should be approaching the analysis is that as long as we continue to remain below the respective resistances, I am expecting the market to be pushing lower to complete this 5th wave of the respective c-waves.
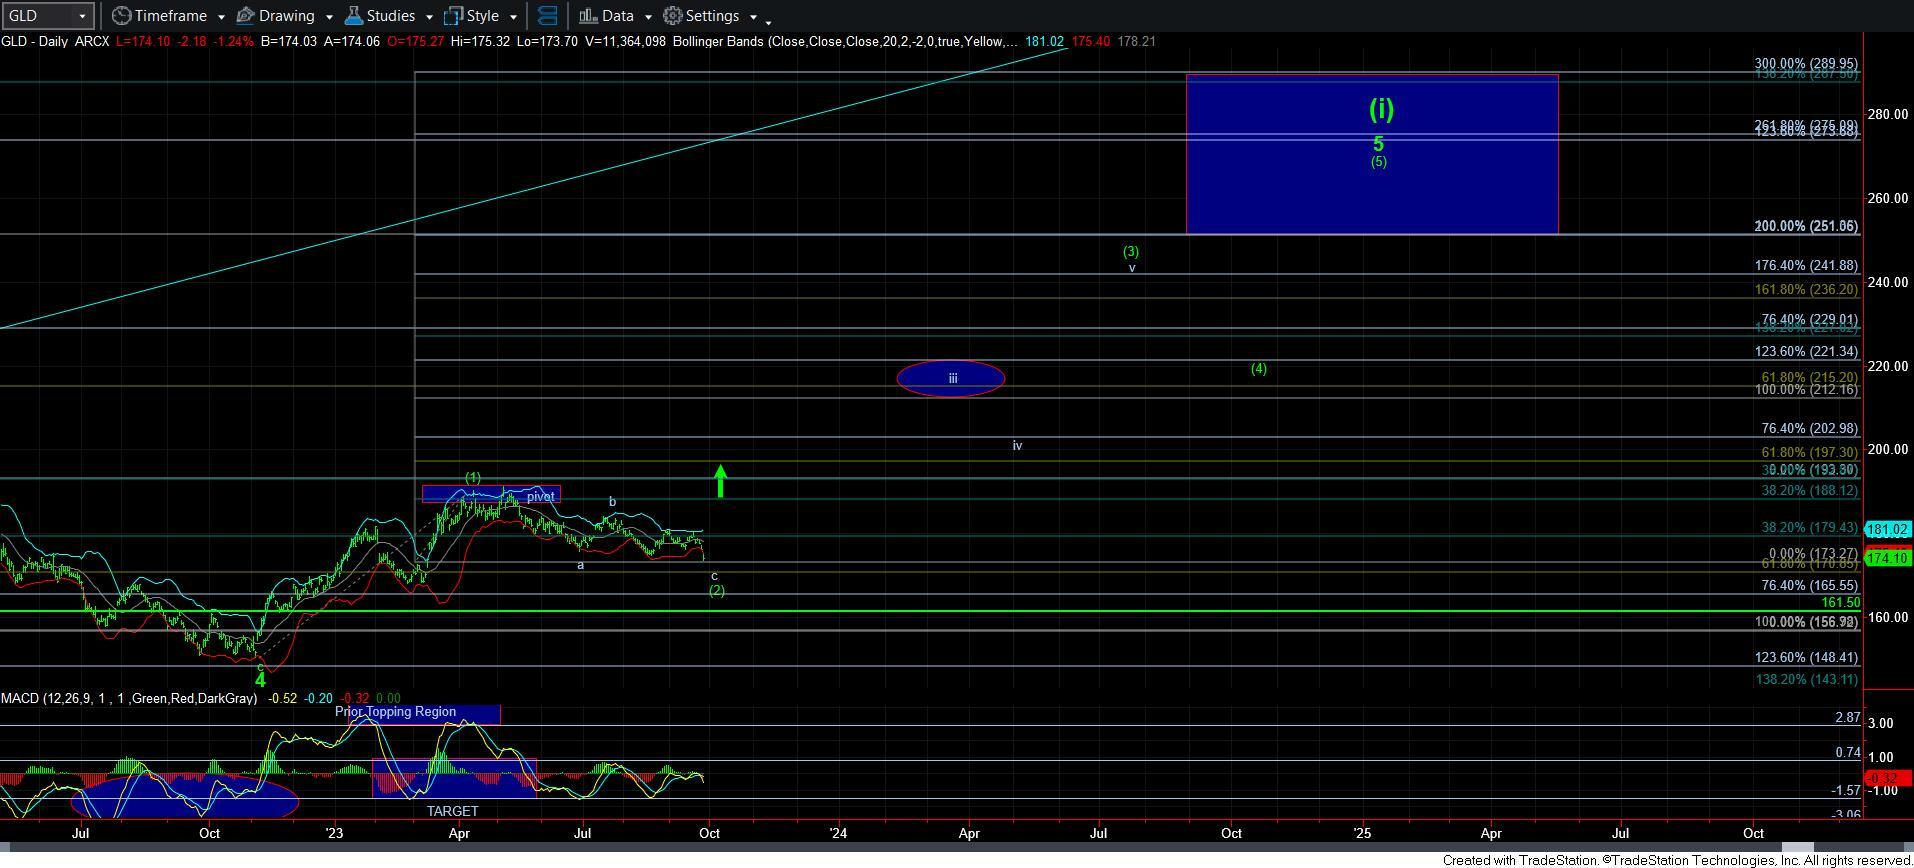
Note that I have not included a smaller degree chart in silver, as the micro structure to the downside is not terribly clear. But, I am assuming we should be able to reach our ideal target box, especially if the rest of the charts are able to complete their respective wave counts to the downside.
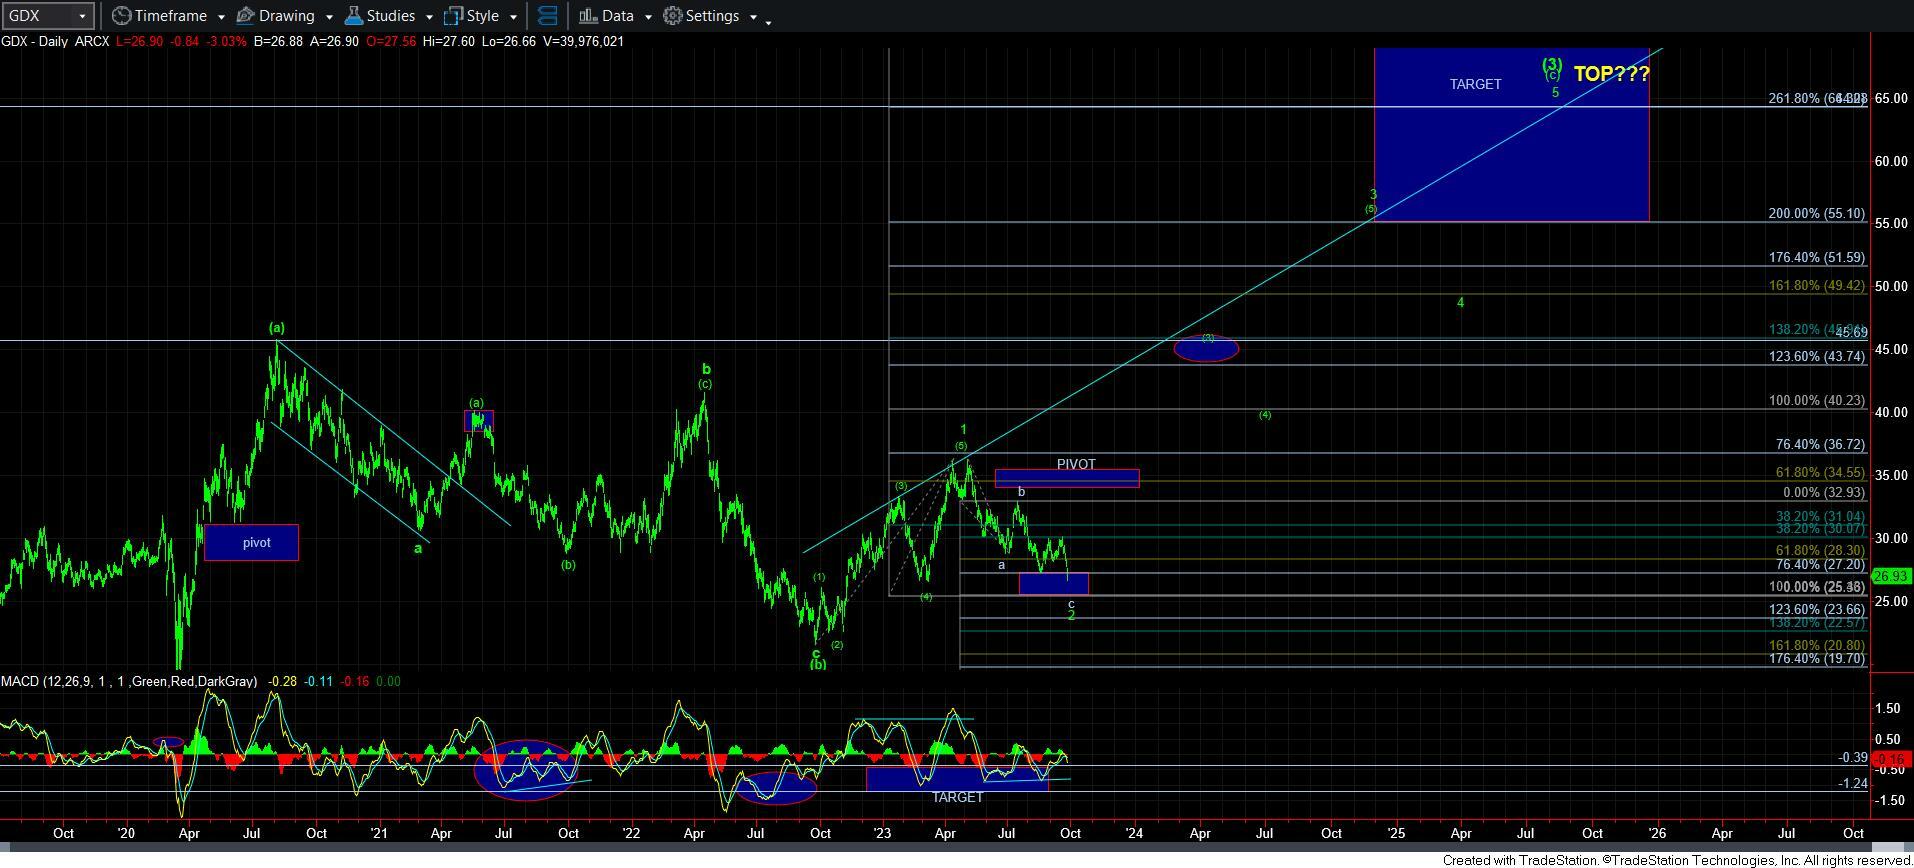
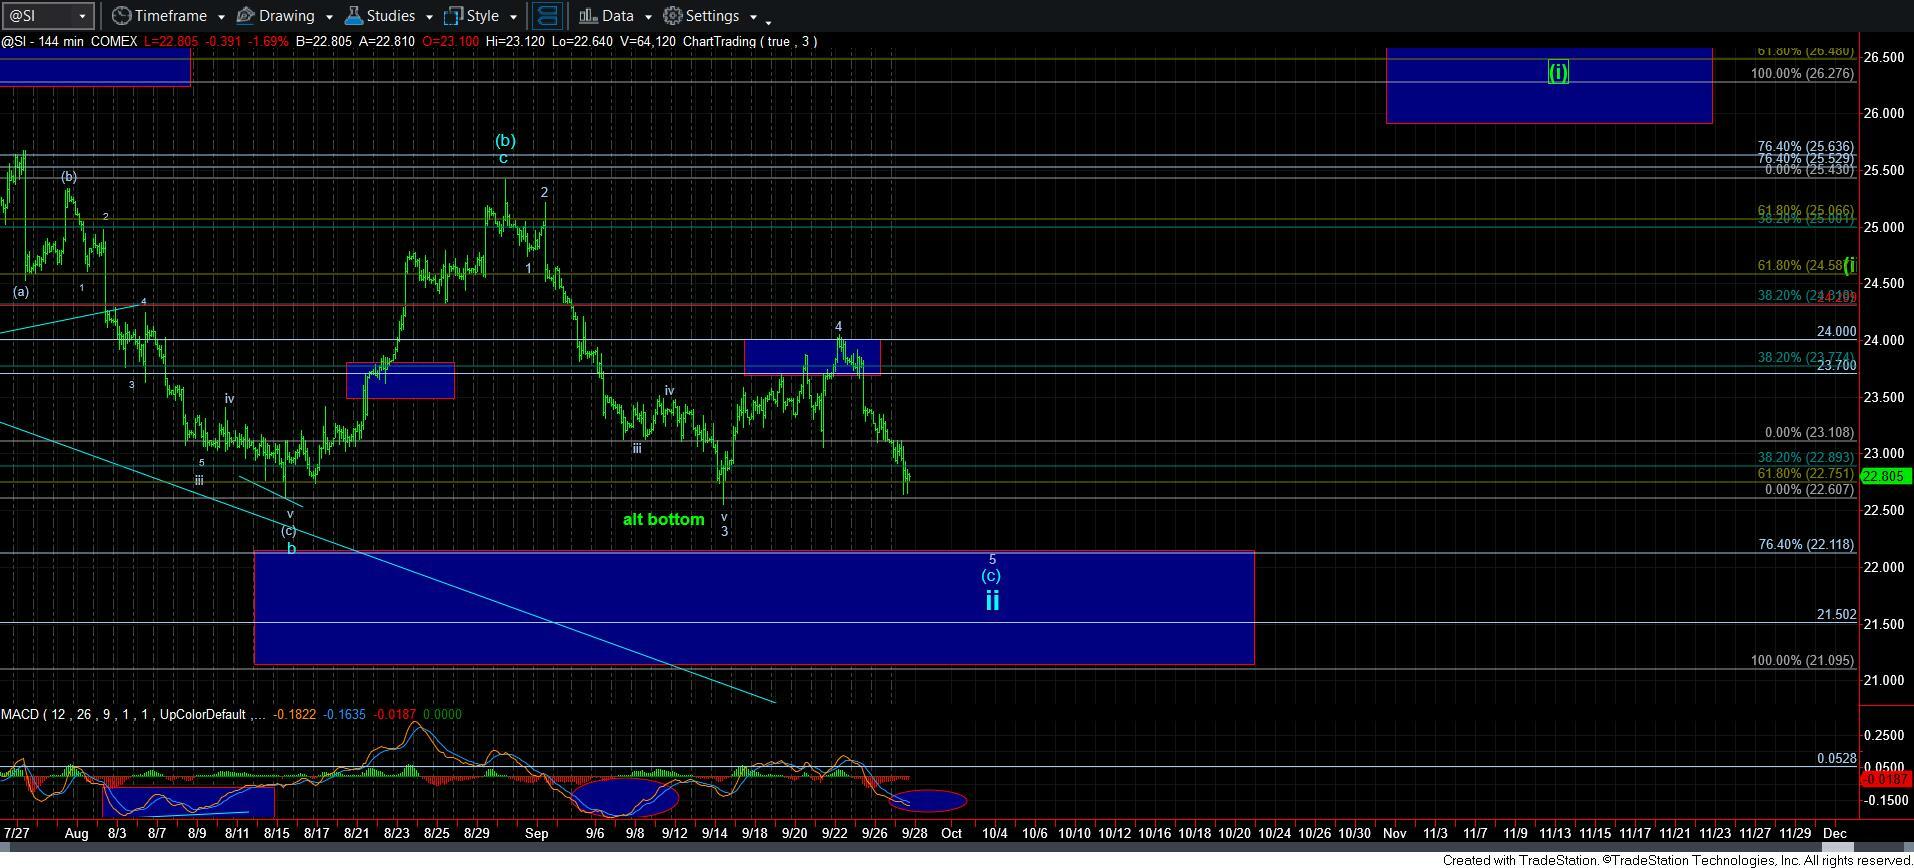
In the bigger picture, divergences on higher time frame charts are all holding, and are setting us up for what will likely be a final low developing. I am now looking for the MACD to be turning upon the 144-minute silver chart to provide more assurance that a bottoming structure is taking shape.
For those that are looking for another buying opportunity, you may want to wait until at least all of the wave 3 to the downside has completed. But, the best buying opportunity will likely come when all 5 waves are completed to the downside.
In summary, we have our resistances in place, and as long as those resistances are respected, I am expecting further subdivisions lower to complete the various 5th wave structures in this c-wave of a much larger degree 2nd wave.