What Looked Like the Ground Floor Was Just the Mezzanine
 By
Levi
By
Levi
In June 2025, lead analyst Zac Mannes mapped a precise bearish path for Asana with a specific price target. Nine months and a 57 percent decline later, that target remains unchanged — and the structure suggests the final chapter has not yet unfolded.
There is a moment familiar to many investors — the purchase that feels like a floor and turns out to be something else entirely.
The stock has already fallen substantially. The chart looks washed out. The price feels cheap relative to where it was. And so the purchase is made — not on enthusiasm, but on the assumption that the worst is behind it.
Asana (ASAN) has been that stock for many investors over the past several years. It has not been the ground floor. It has been the mezzanine — and the building has more levels below.
What Asana Does
Asana develops cloud-based work management and project collaboration software, competing in a crowded field that includes Monday.com, Notion, and Microsoft's suite of productivity tools. Founded by Facebook co-founder Dustin Moskovitz, the company went public in 2020 and quickly became a beneficiary of the pandemic-era enthusiasm for SaaS and remote work infrastructure.
At its peak in late 2021, ASAN traded above $140. The business was growing rapidly. The narrative was compelling. The masses were fully invested in the story.
That peak marked the beginning of a long and grinding sentiment reset — one that, according to the structure of price, is not yet complete.
The Setup in June 2025
By early June 2025, ASAN had already declined dramatically from its highs. Trading near $14, the stock appeared to many observers to have found a range. The worst, it seemed, was behind it.
Zac read the structure differently.
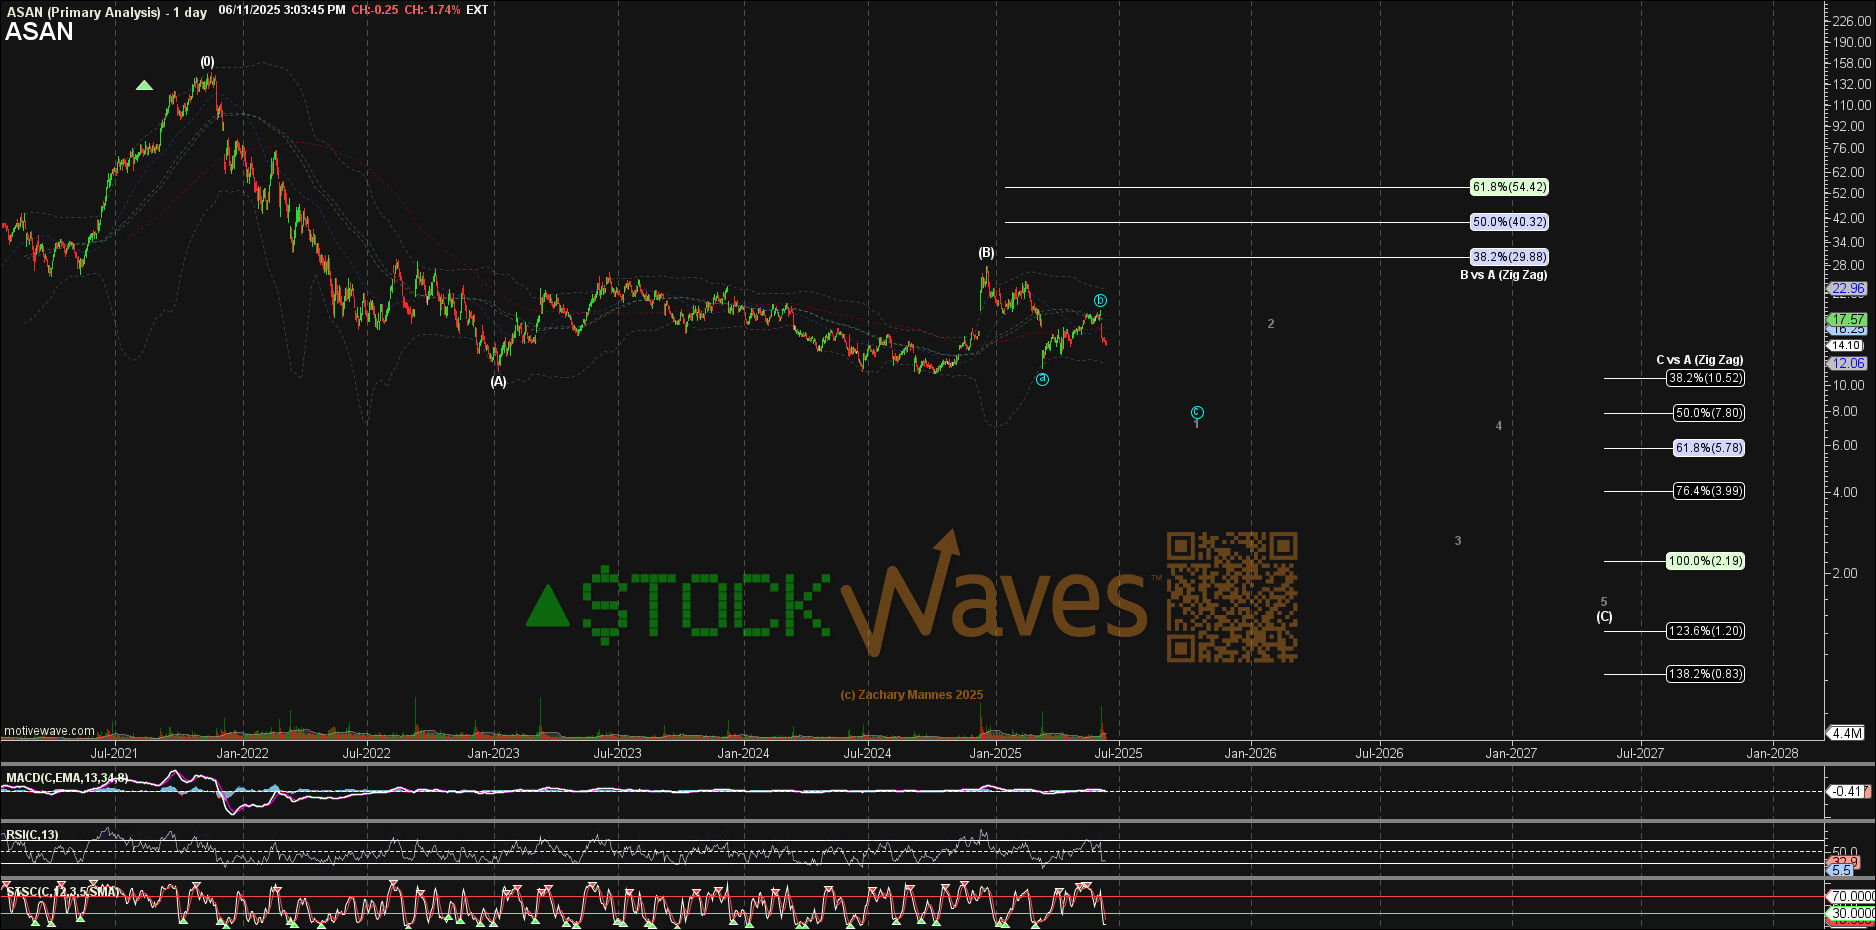
On June 11, 2025, Zac posted a formal Wave Setup for ASAN — a short position with precisely defined parameters. Support at $16.88. Invalidation at $19.37. Target: $3.99.
That target was not a guess. It was the product of a Fibonacci analysis of the larger corrective structure — specifically, the 76.4% retracement level of the C wave relative to the A wave, visible on the chart as a natural endpoint for the developing bearish sequence.
The structure Zac identified was likely a (C) wave. Its presence suggested not that the decline was ending, but that it was entering its most committed phase.
What looked like consolidation to most investors was, in the language of crowd behavior, distribution. The crowd was not accumulating shares at a discount. It was methodically withdrawing from a position that sentiment had already left behind.
Nine Months Later
The March 2026 update tells the next part of the story.
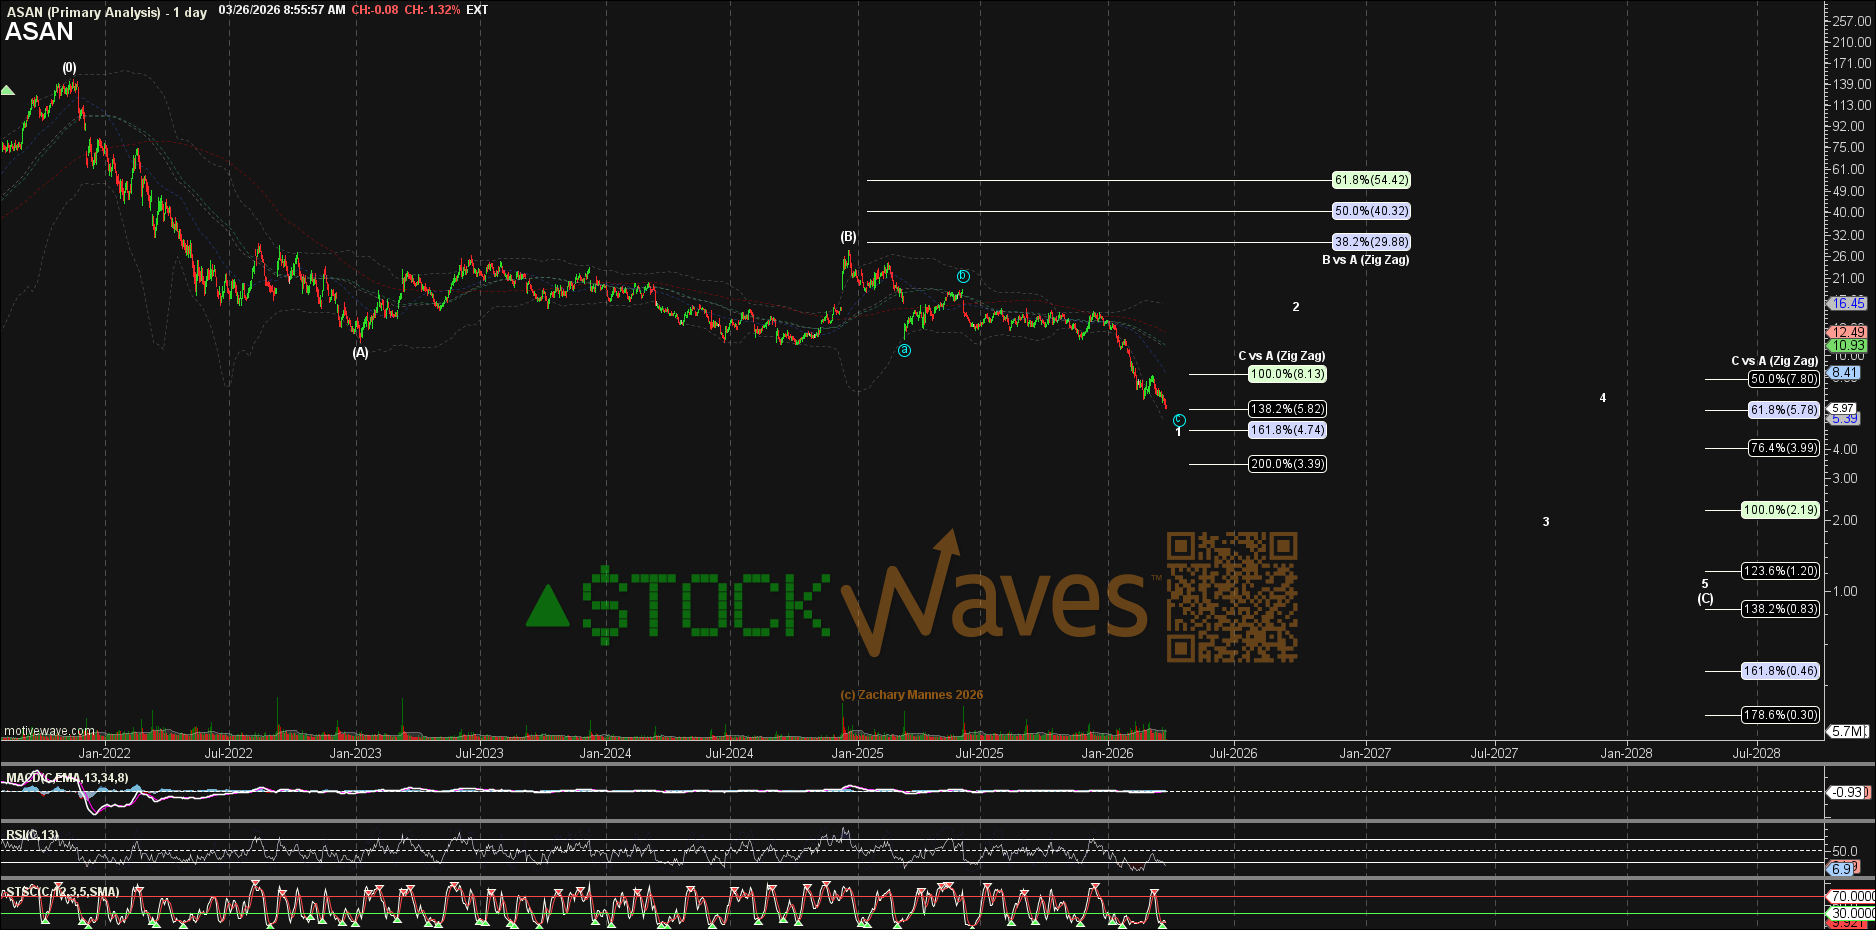
The setup established the bearish stance near $14. It recently traded just under $6. That is a decline of more than 57 percent from the setup entry — in a stock that many investors had already considered beaten down.
Zac recently updated the Wave Setup parameters to reflect the current structure: support tightened to $6.87, invalidation lowered to $7.95, resistance now at $4.74. The target remains $3.99. (keep in mind that in a bearish setup, these terms are reversed — the main takeaway being the $7.95 level overhead is key).
That the target has not changed in nine months is itself a statement about the methodology. The structure identified in June 2025 has continued to perform as mapped. The parameters have been refined as price provided new information. The destination has not moved.
The current structure anticipates one more bounce — likely a wave 4 recovery — followed by a final decline into the target zone. That sequence, if it completes as drawn, would represent the conclusion of a corrective pattern that began when ASAN peaked above $140 in late 2021.
What the Mezzanine Teaches
The lesson embedded in ASAN's chart reaches beyond this company. It extends to any stock where investors confuse a long decline with an approaching floor.
Sentiment does not reset because a stock has fallen far enough. It resets when the crowd's collective psychology has fully cycled — when the optimism that drove the original advance has been completely absorbed by the corrective process that followed it.
That process has a structure. It unfolds in recognizable patterns. And it does not end simply because the price feels cheap.
At some point the weight of the chart stops being analysis and simply becomes fact.
For Asana, that conclusion became visible in the structure of price in June 2025. The crowd that bought the consolidation as the ground floor is still waiting for a return that the chart, from the outset, suggested was unlikely to arrive on schedule.
The mezzanine had more floors below it. The structure said so. Price has been confirming it ever since.
