What Kind Of Drop Will We Now See In Metals?
For those that have followed me through the years in metals, you would know we called the top in gold in 2011 within $6 of the high, we called the bottom in gold as it was happening a little over 4 years later, and we have been through both a major bear market and now a major bull market together. And, during that time, you have likely seen me lean towards the bearish counts when we were in the bear market, and then the bullish counts when we are in the bull market. So, now, we have another potential pullback about to happen, and the question is whether it will be shallow or deep?
So, my primary counts all present the more shallow pullbacks, as we are in a bull market move, while my alternative counts are presented as the deeper drops. For if the market only provides a shallow drop, and then takes off without you being prepared for it, it is rare that there is another stop that will allow you to board that train until a lot of real estate has been traveled.
At this time, we now have another 5-wave rally completing in the complex as we speak. So, what does that 5-wave rally represent?
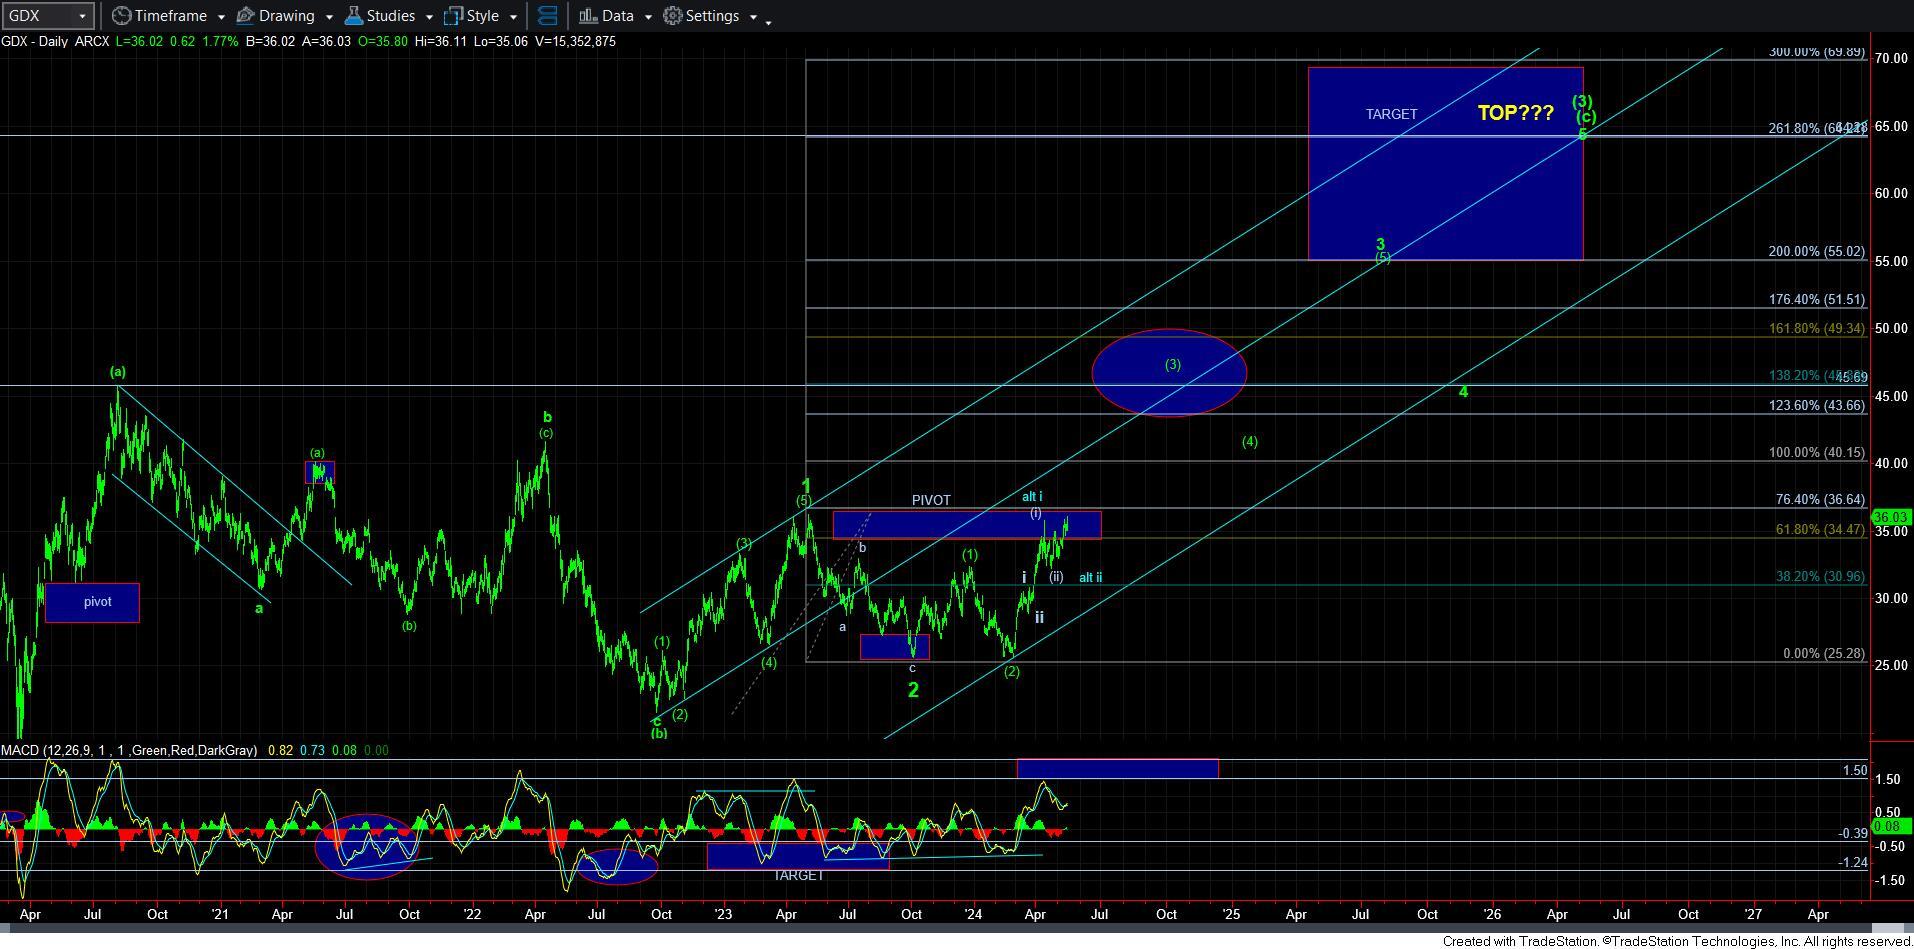
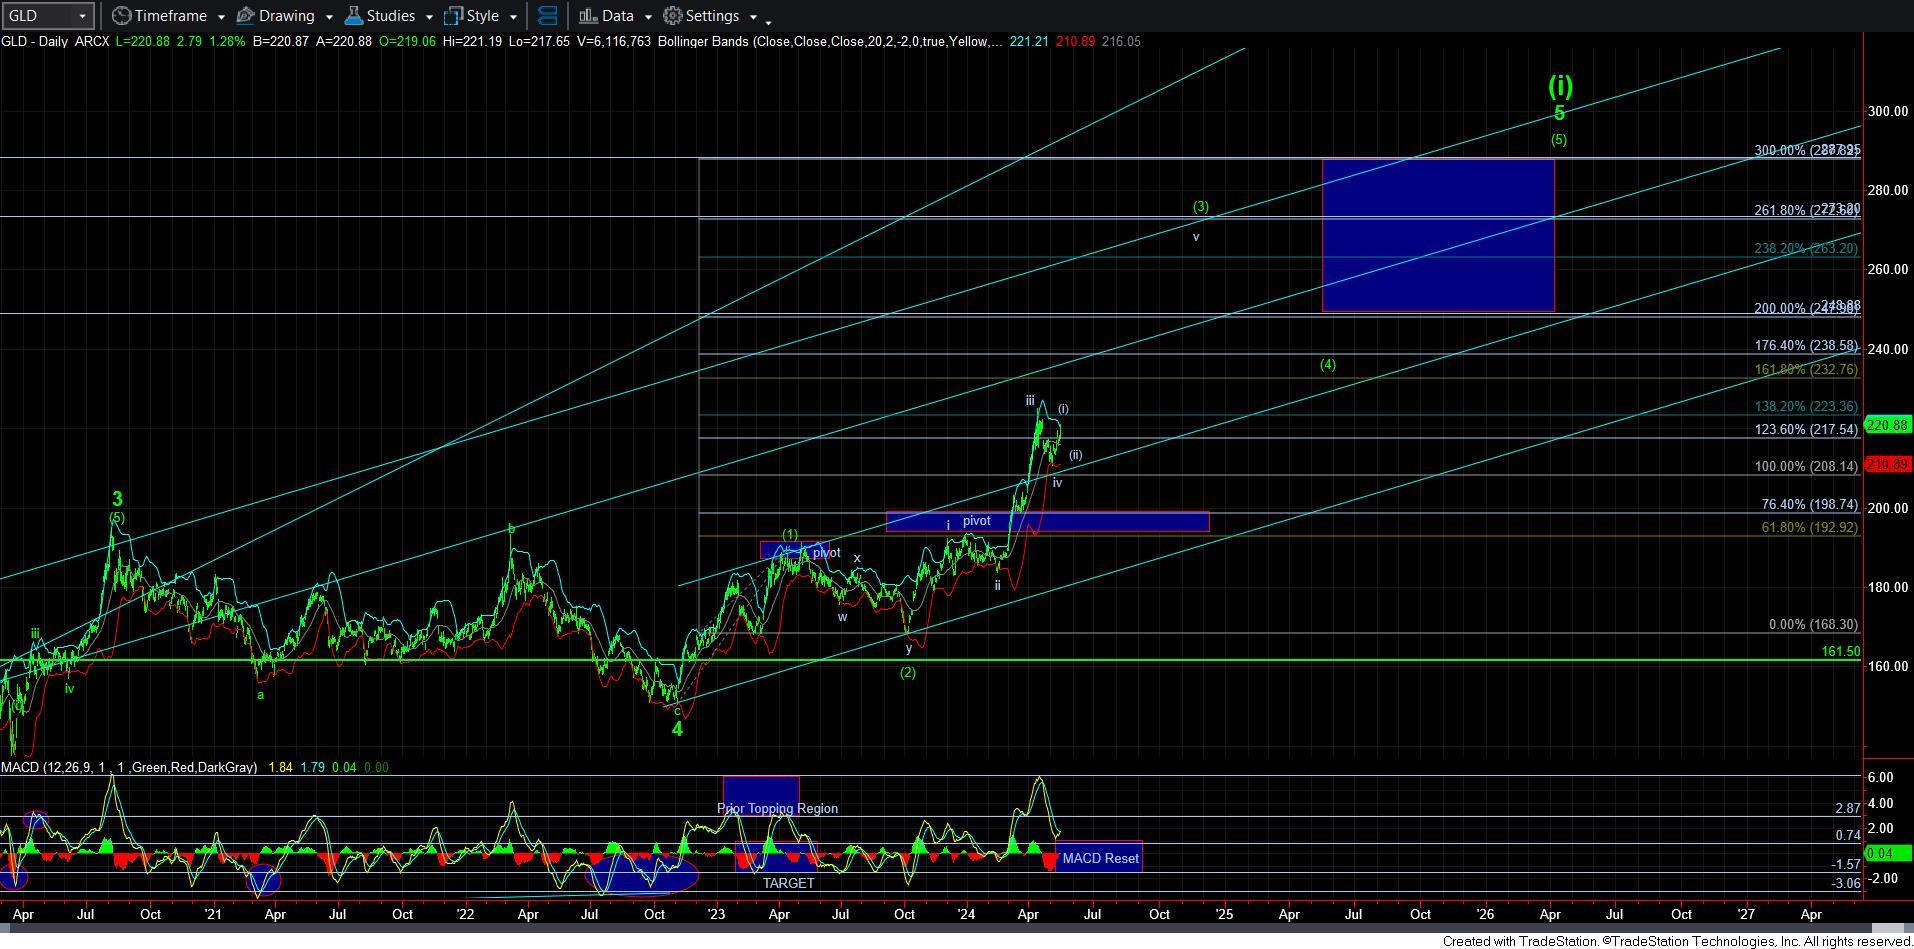
As I have been highlighting over the last week or so, gold is going to be a big tell for me. As we were bottoming out recently, I had pointing to the MACD having re-set on the daily chart, and getting ready to turn back up. Moreover, I wanted to see a 5-wave rally take us back up towards the recent highs to set up a [i][ii] break out structure for wave v of [3].
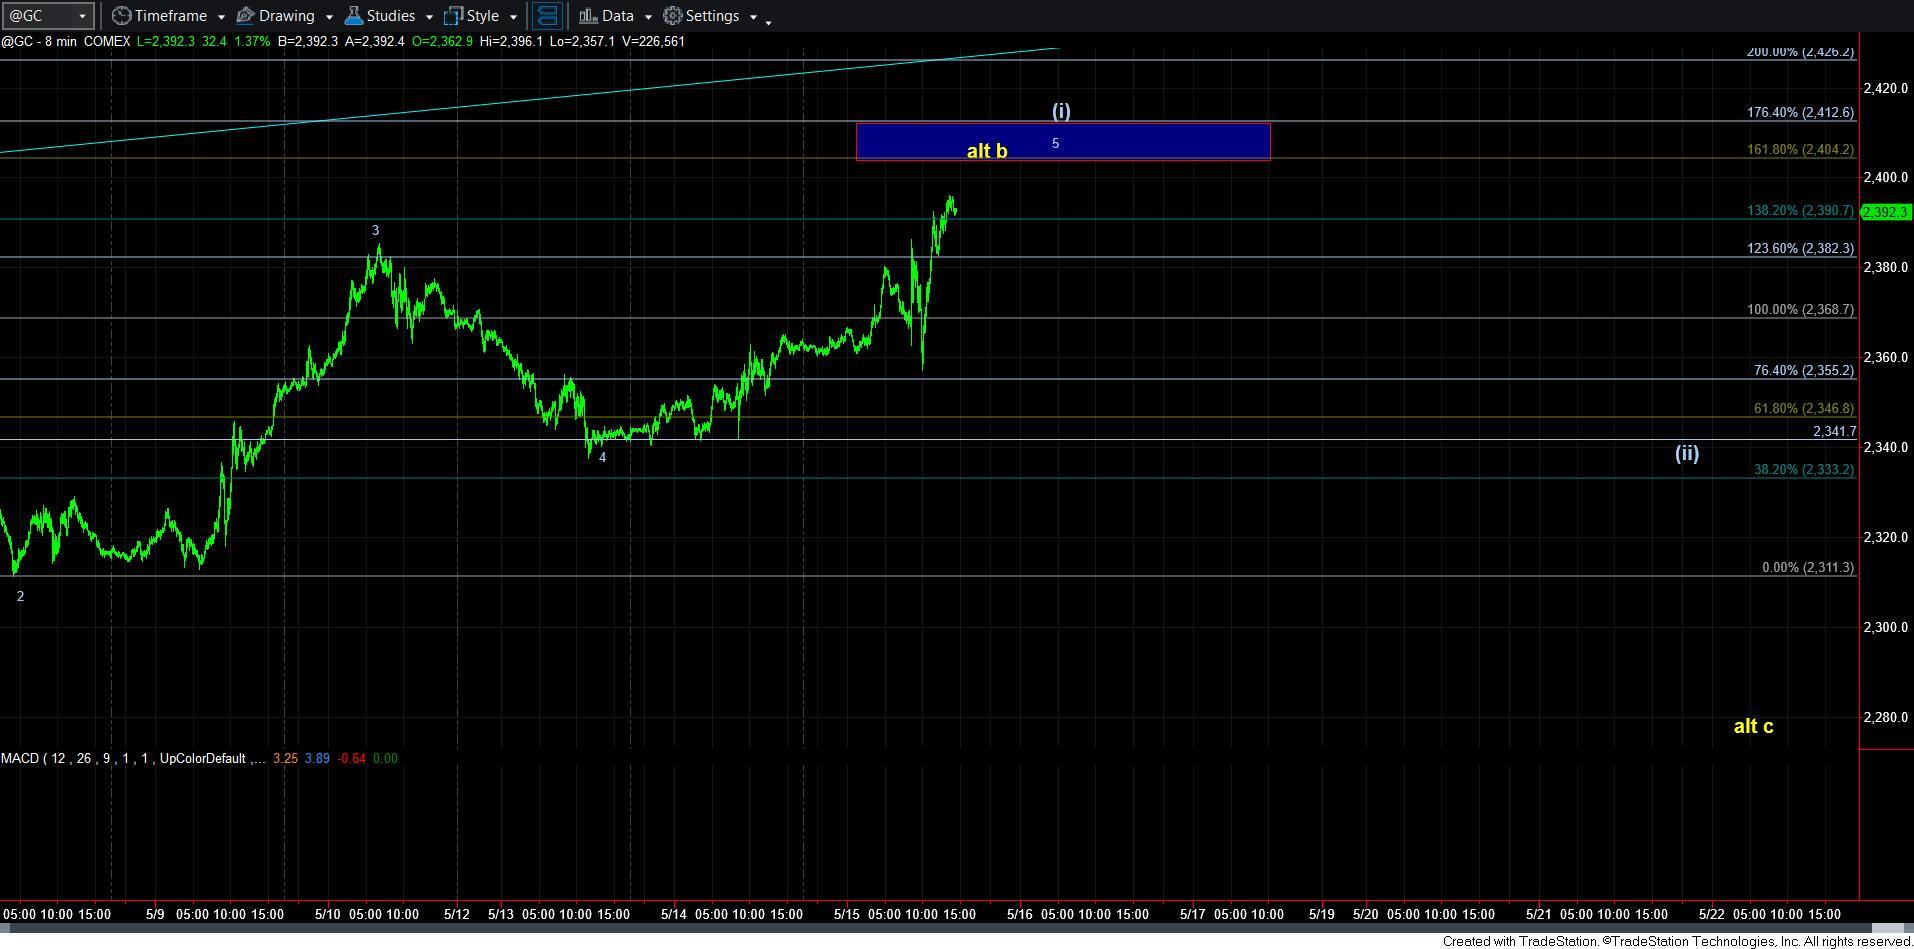
While I can now count the bare minimum number of waves in place to consider a 5-wave rally is completing, I have to note that it is taking shape as a leading diagonal. As many of you know, I am not a big fan of leading diagonals for trading cues, since they far too closely resemble corrective rallies. And, this one is no different.
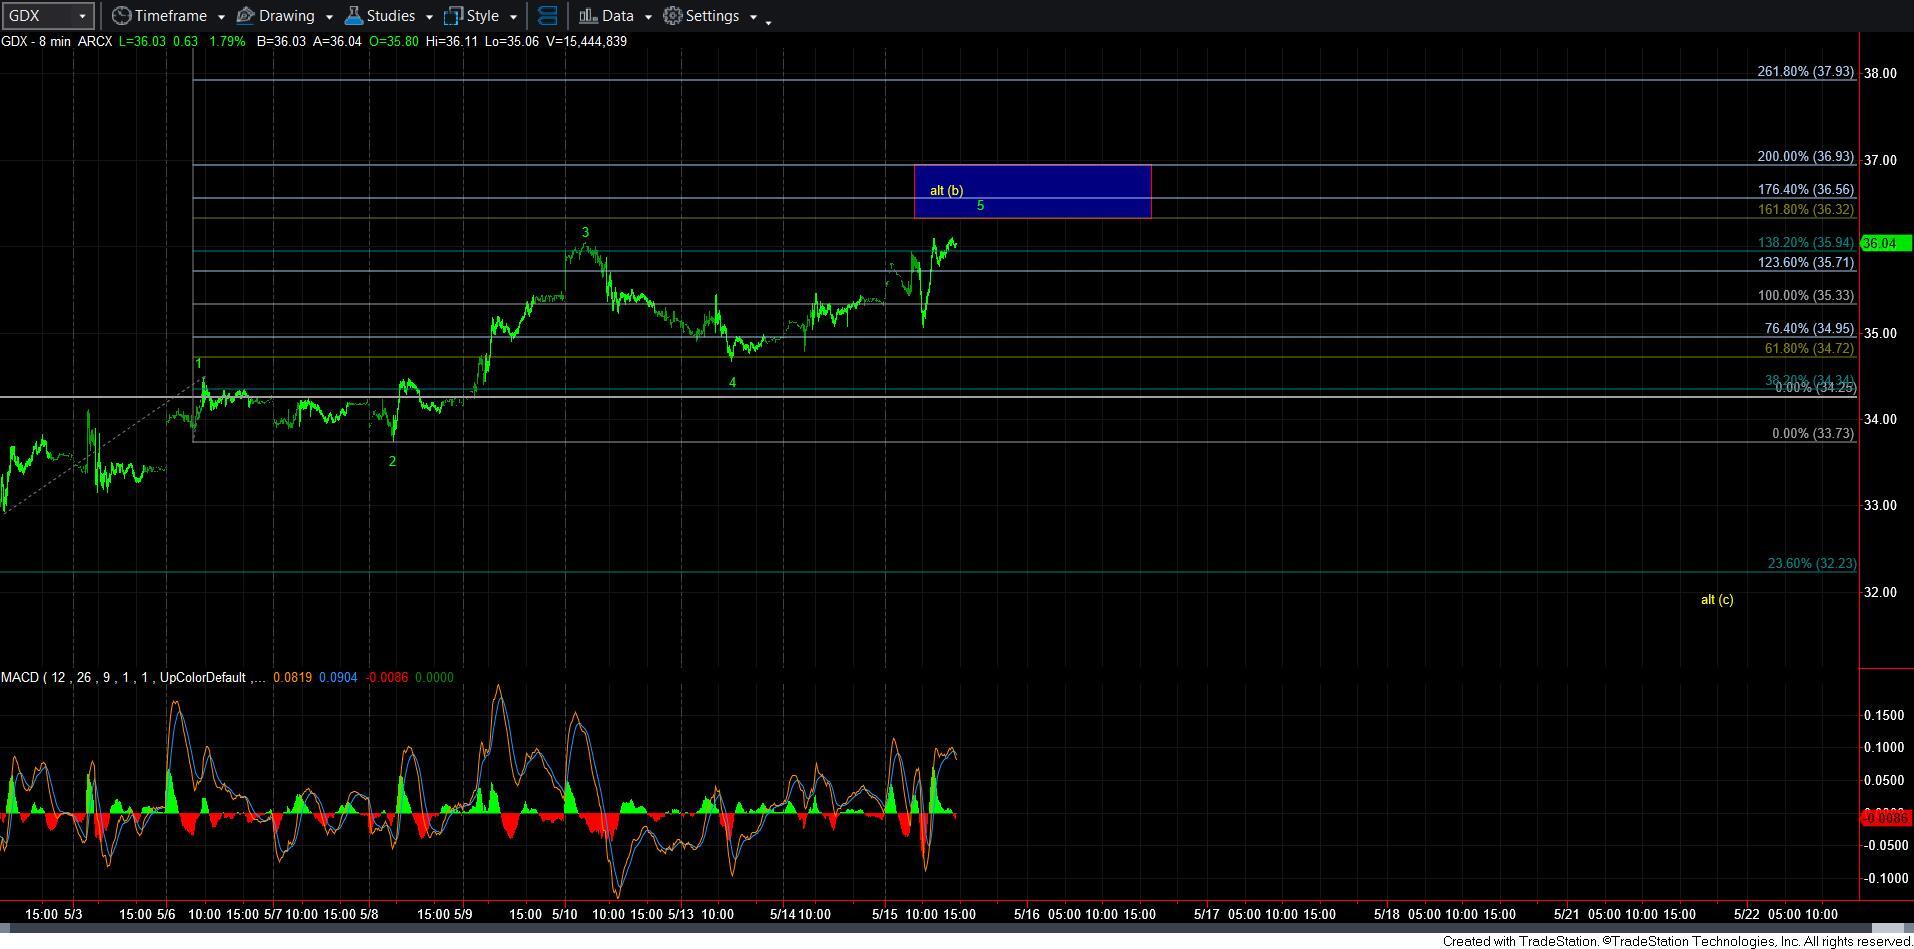
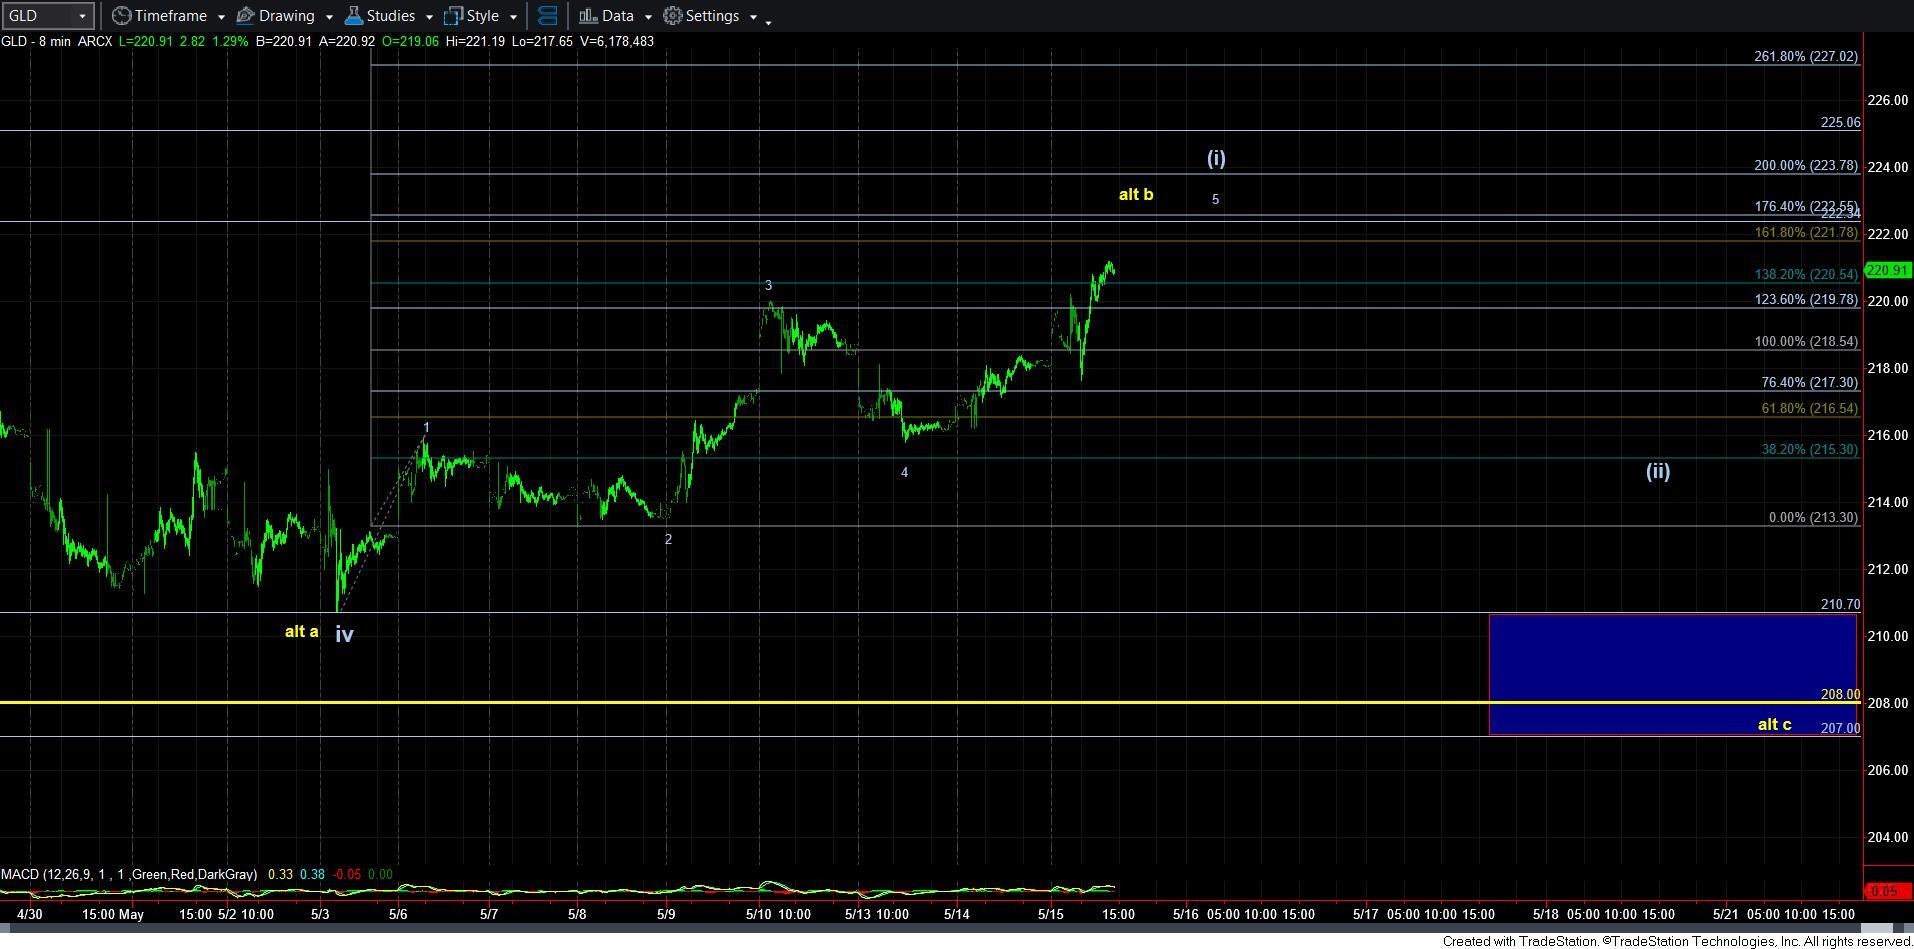
So, my primary count is presented as us topping in wave [i] in both GC and GLD, with an expectation for a wave [ii] pullback to be seen in the more immediate bullish count. But, due to the nature of this overlapping rally, I have to consider that this rally is a b-wave in the alternative perspective, with a c-wave taking us back down towards the 208 support region in GLD.
The difference will likely turn upon how the market begins its next decline. If that decline is clearly impulsive, then I have to start giving a bit more weight to the yellow count and the c-wave decline. If that decline is clearly corrective, then I will keep the more bullish primary count well in place, and begin to prepare for the next bullish phase in the market.
Now, while I am maintaining the same potential perspective in GDX, I have to note that the immediate bullish structure is a bit more troublesome in this product. First, I would have to rely upon a running wave [ii] flat as being complete, which is relatively rare on its own. And, then I have to rely upon a leading diagonal built upon that, which at the point in time of my writing this update, has not even reached the 1.618 extension of waves 1-2 in that diagonal structure. So, if there is any chart that I am more cautious about at this time, and has the potential for the [c] wave down in yellow, I would probably be leaning on the GDX. For this reason, if one chooses to hedge their positions for the potential downside, this may be the product to choose to do so.
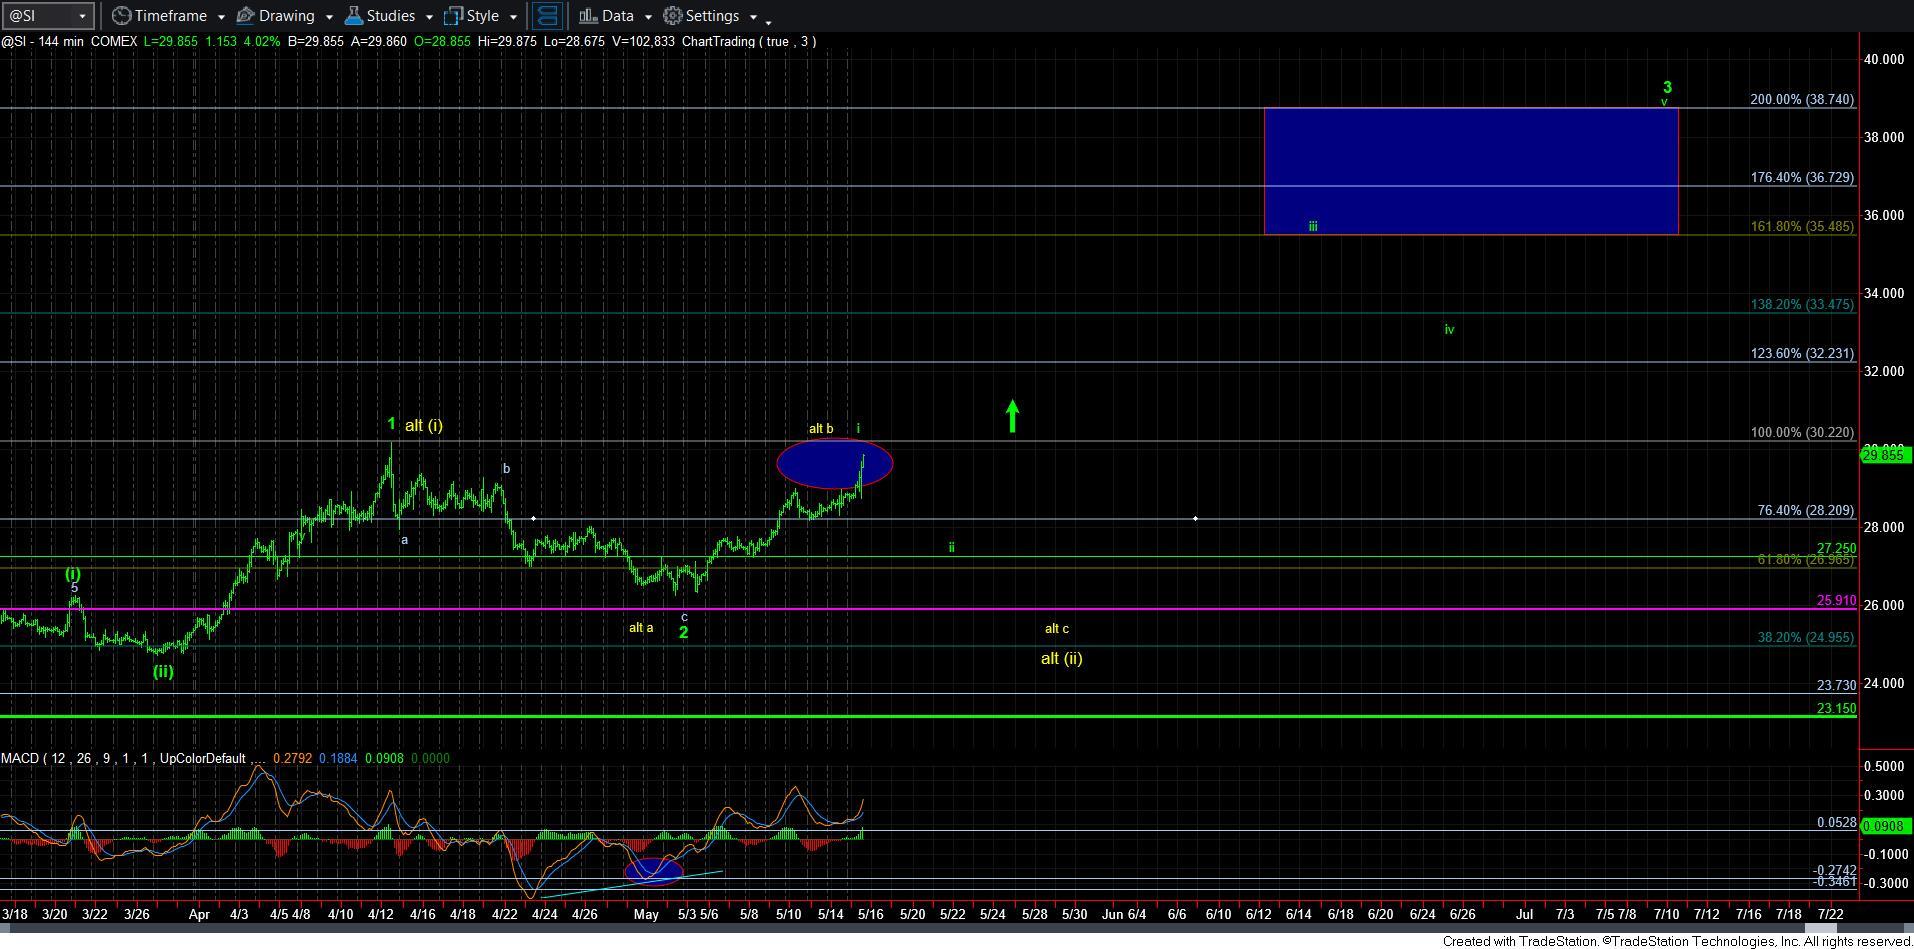
As far as silver is concerned, I am simply going to view the current rally as completing 5 waves up for wave i of 3 in the primary count. However, as I outlined in the live video this morning, I have added an alternative count which presents the rally from the February low as a bigger 5-wave structure, with a very extended 5th wave, which then completed alt [i]. This would suggest this rally is really a b-wave, with a c-wave decline to follow to complete a larger degree wave [ii]. Again, this is presented in yellow as the alternative count for now.
Should I see a clearly impulsive decline begin, then I will look to adopt this potential. Moreover, I would assume we would not break below the 26 region on that [c] wave decline, as this looks to be taking shape as a flat. But, do take note that this is even a more bullish set up and projects us even higher. It also suggest that we would still need to see wave 1-2 take shape before the major break out is seen, and would likely push out the time for the heart of a 3rd wave taking hold until maybe the summer.
So, as the market seems to be completing this current rally, I think it is reasonable to assume that a pullback is in the offing. The question will be how the structure of this potential decline begins to take shape, which should be able to give us some clue as to how deep we can expect the next pullback to take us.