What Is Your Goal With Elliott Wave Analysis?
 By
Avi Gilburt
By
Avi Gilburt
Every now and then, one has to step back and consider their goals and how they intend on attaining those goals. While the main goal of an investor is to increase their investment account, as well as protect what they currently have, no investor will do so consistently if they approach this task while taking high risk. While they can, for a time, feel as though they are attaining their goals in this manner, it is inevitable that they will blow up their account if following this path.
For this reason, intelligent investors approach the market with a strong eye towards risk. While the goal is to increase your investment account, the wise investor approaches the attainment of that goal with a strong risk management plan in place. Remember, investing is a marathon and not a sprint.
So, of course, we are here in our little place in the world utilizing Elliott Wave analysis as a strong tool towards meeting those investing goals. But, in order to do so, you must understand what Elliott Wave analysis is and what it is not.
Elliott Wave analysis does not provide you fortune or future telling. Rather, it is a methodology through which we assess the risk in the market and attempt to identify structures which would provide us with low-risk and high probability investing or trading opportunities. To this end, we utilize the standards that have been learned and gleaned through many decades in order to identify those opportunities.
I think one of the most famous hedge fund managers and users of Elliott Wave analysis – Paul Tudor Jones - said it best:
"I attribute a lot of my success to Elliot Wave Theory. It allows one to create incredibly favorable risk reward opportunities."
One of the mainstay standards we have used over these last decades is that an appropriate corrective retracement after a rally can provide us with a trading or investing opportunity. And, the standard expectations we maintain, again based upon many decades of experience, is that a 2nd wave will usually retrace .500-.618 of the prior wave 1 rally. In extreme instances, a 2nd wave may only provide a .382 retracement.
Yet, over the last several years, our stock market has been playing more so in the extreme territory. In fact, many of the corrective pullbacks we have seen have not even attained a .382 retracement, and some have barely even approached a .236 retracement. This has clearly provided us with a VERY challenging environment if your goal is to trade or invest in the overall market in a low-risk, high probability fashion. Such an environment requires you to take much larger risk if you intend to trade such a chart.
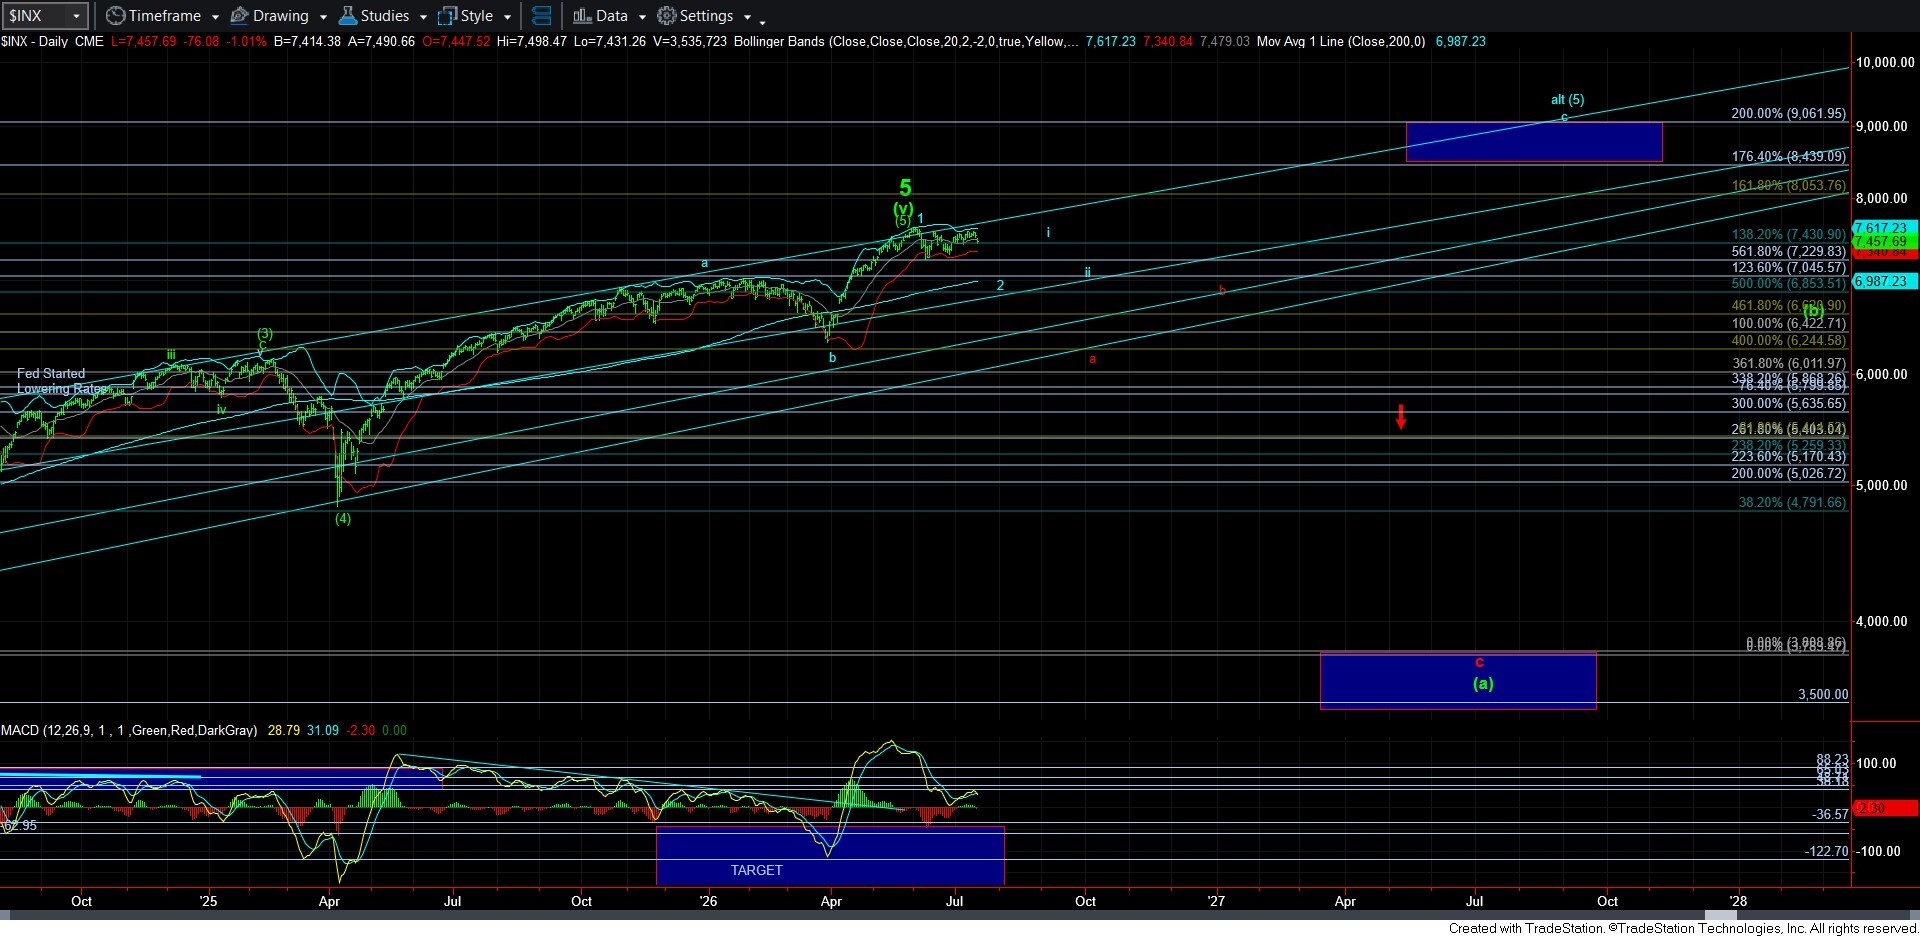
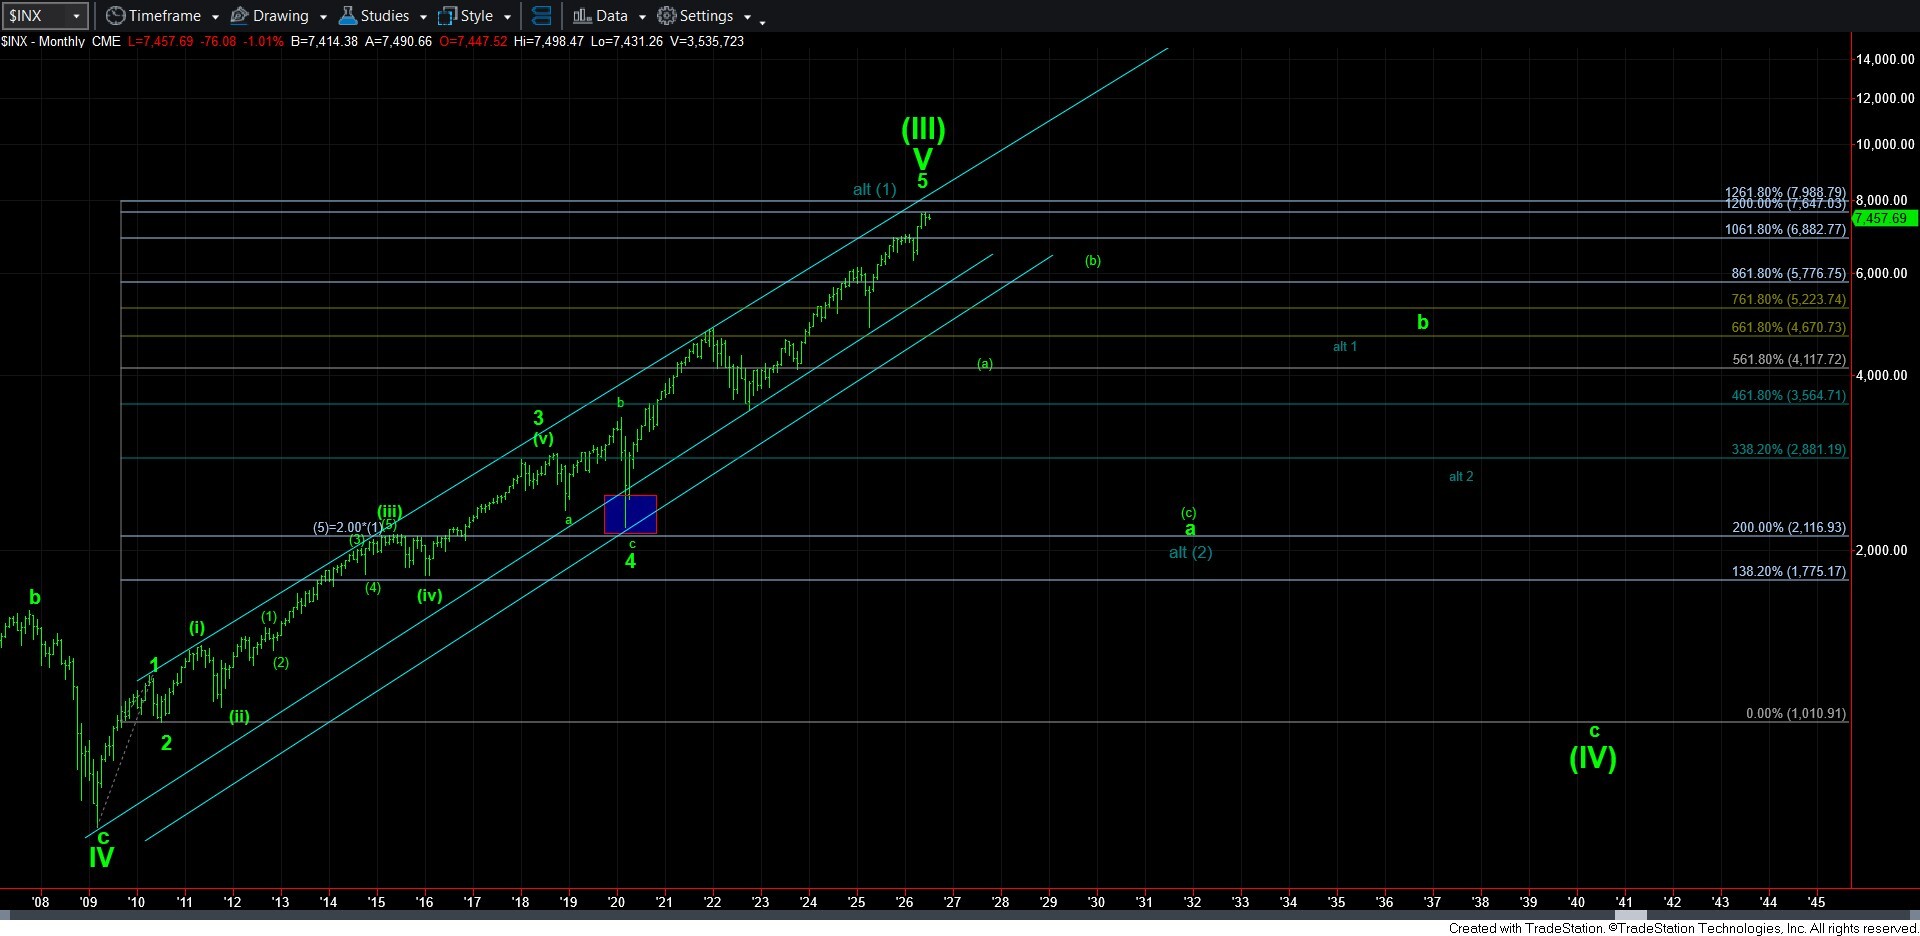
Within the last four months, we have been tracking a potential path that can point the market north of 9000SPX. Yet, as I have outlined many times before, the much bigger picture indicates we are likely in the final throes of a market rally which actually began in 1932, at which time we were completing a 2nd wave pullback set off by the 1929 stock market crash. As I have outlined before, we are approaching the completion of a multi-decade and almost 100-year bull market 3rd wave which was actually forecasted by Ralph Nelson Elliott himself. So, clearly, keeping this in mind adds to the risk inherent in the market at this time.
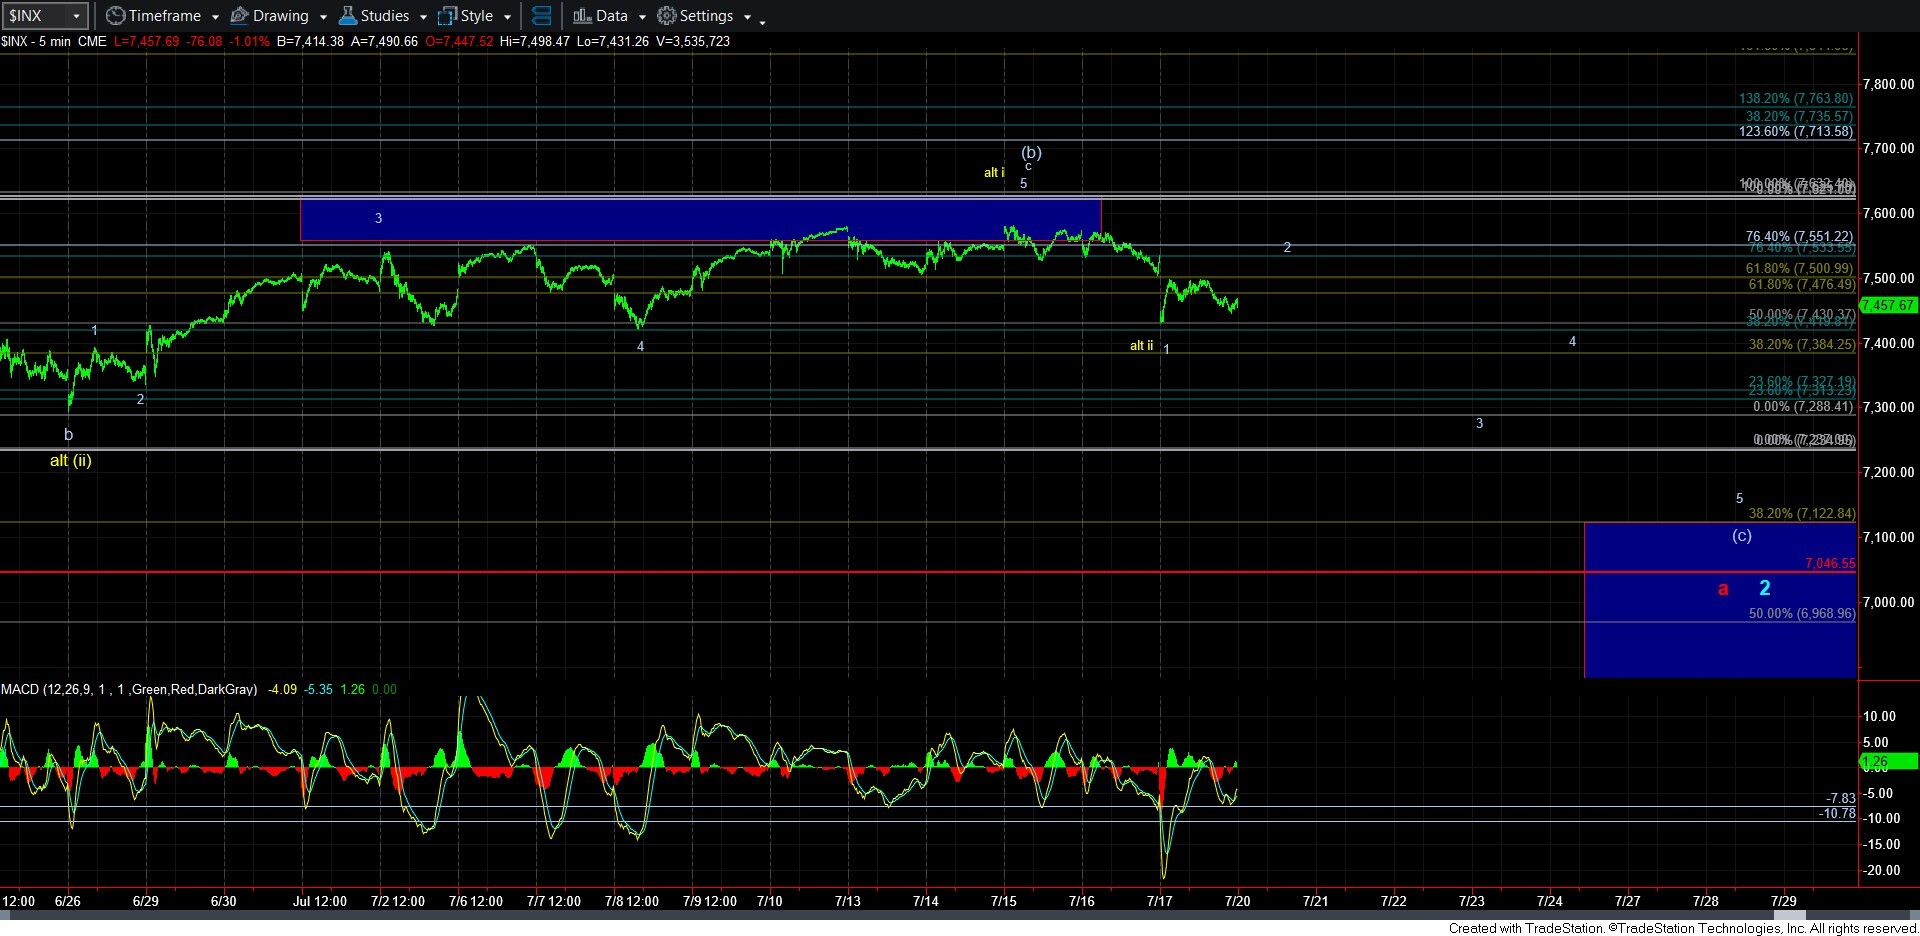
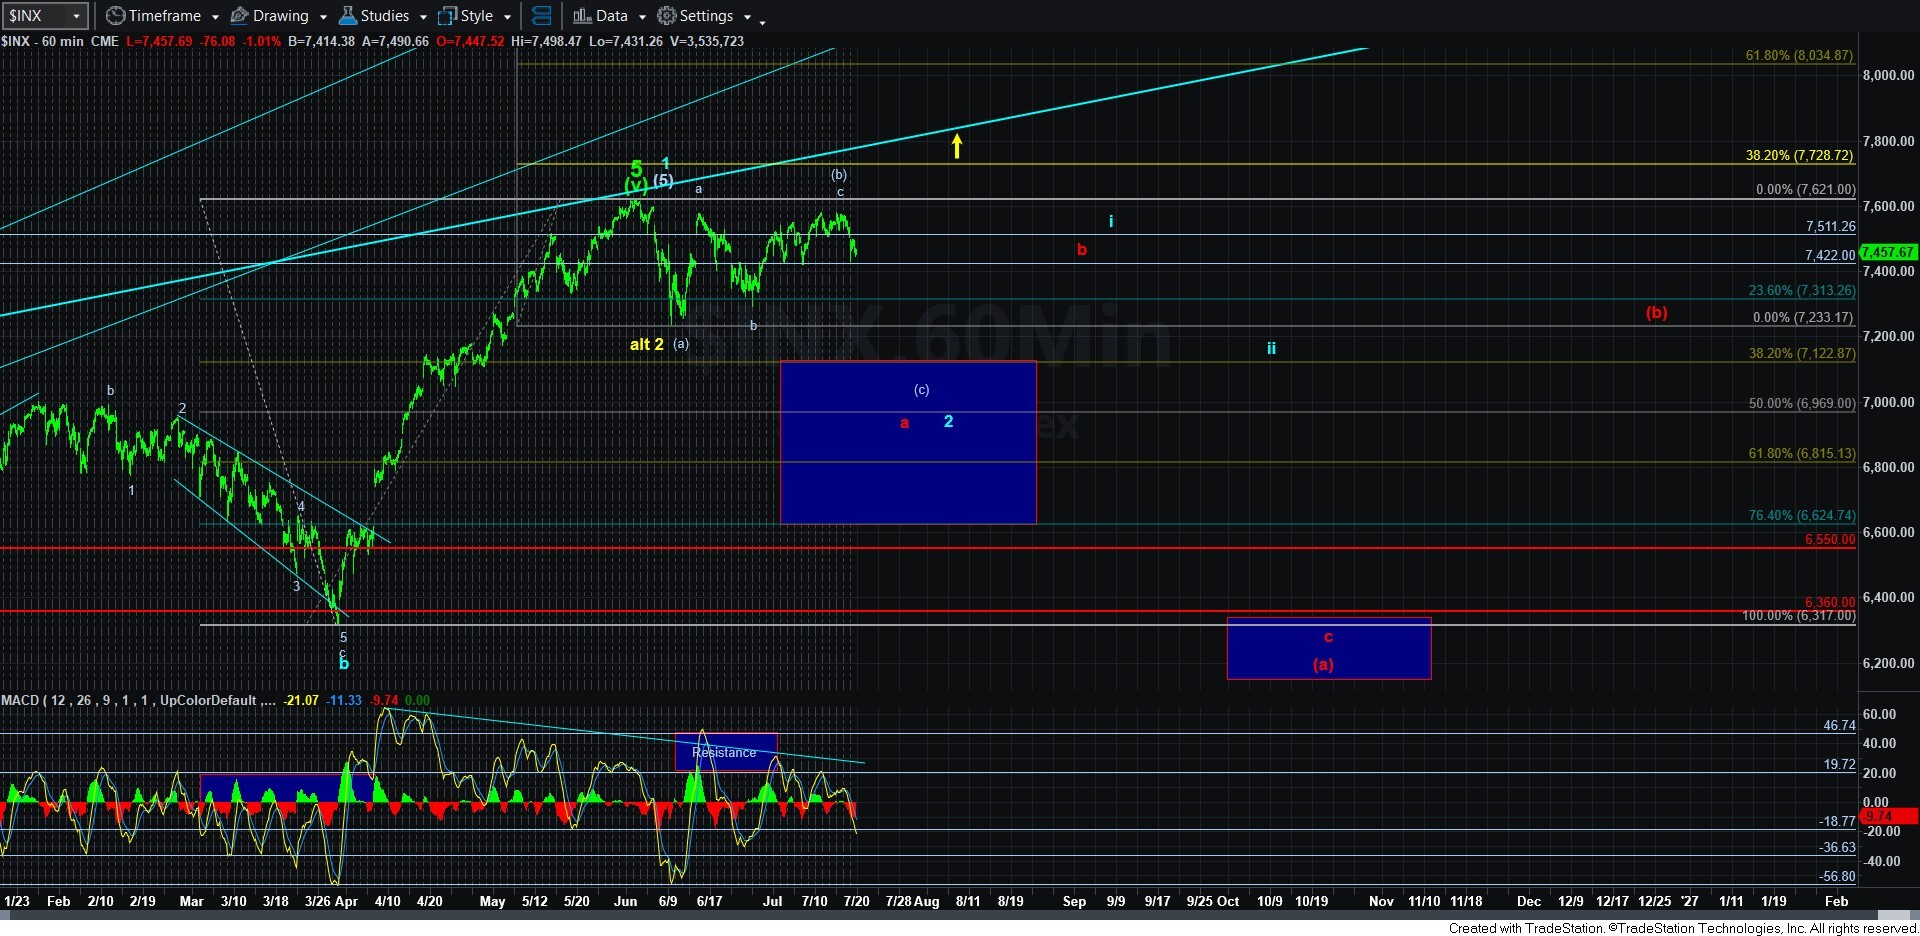
As I have also outlined in 2026, in order for me to adopt the more bullish path pointing us north of the 9000SPX region, the market must prove to me this intent with a 1-2, i-ii structure. But, as I noted above, ideally, we wanted to see a standard wave 2 to provide a lower-risk potential long trade, especially in the face of a potentially ending long-term bull market. Thus far, after topping in early June, the market has not even reached a .382 retracement, which you can see on the attached 60-minute SPX chart.
While I have been tracking a potential 1-2, i-ii already in place as the yellow alternative (especially in light of the action we have seen over the last several years with VERY shallow retracements), I MUST see a break-out over the 7635SPX level to even consider adopting this potential. This resistance represents an a=c region in a potential (b) wave rally. Through that level, and it begins to shift probabilities from this being a corrective (b) wave rally.
For now, I am still maintaining my primary analysis with the expectation of a (c) wave decline yet to come. To this end, while I can fashion a leading diagonal count to the downside suggesting a 1-2 structure in the (c) wave is developing, I must note that a lower low would look best for wave 1 down in the SPX. But, as long as bounces remain corrective, I am now viewing the (b) wave high as being in place at the high struck this past week, and as long as we remain below that high, pressure will remain down. Ideally, my expectation remains that we at least test the support box on the 5-minute and 60-minute SPX charts, the top of which represents the .382 retracement of the rally which concluded in early June.
But, simply dropping down to that support and rallying off that support does not present us with a structure that is pointing to the 9000+ region. Rather, that bounce MUST be a CLEAR 5-wave structure for me to adopt the more bullish path into the end of the year and potentially into next. Should that bounce occur in a corrective fashion, there is potential that the red wave count (which suggests that the market has already topped) can begin to take us much lower into year end.
With that being said, I have much less confidence that the long-term top has yet been struck. You see, it seems as though this last segment of the long-term market rally has been taking shape as an ending diagonal. As an aside, this has made counting waves significantly more difficult since the structure takes shape in 3-wave moves, which are much more variable and difficult in tracking as compared to a standard 5-wave Fibonacci Pinball structure. But, I digress. When an ending diagonal concludes, it usually begins with a VERY strong reversal signal. As we have not seen such a signal thus far, I really have no evidence right now that a major market top has been struck. For this reason, I have been highly focused on finding an appropriate 1-2, i-ii structure to provide a higher probability and lower risk framework to join a rally pointing to 9000+.
Yet, I do have to note that there are a few nicer set ups for this potential in various Stock Waves individual charts. And, I want to make a point about this.
While my job is to provide analysis for the SPX, that does not equate to being able to identify a high-probability, low-risk entry point for a trade at all times. Nor does it mean that I can create a high-probability, low-risk set up when the market does not provide one. It simply means that I am required to provide analysis for the index, and it will not always present you with a clean trade to be had.
For that reason, I have always advised to be reviewing individual stock charts, as you can almost always find many charts to provide you with lower-risk, higher probability trades (either long or short) as you have a much larger collection and range of stocks from which to find that better set up. And, if the SPX does not provide one, that does not mean you should give up your standards for higher-probability and lower-risk opportunities simply because the market is moving in one direction. In my humble opinion, once you go down that road you will jeopardize your long-term success as a trader or investor.
I want everyone to read those last sentences very carefully. I know the indices have been extremely frustrating in not providing lower-risk entries, especially in light of where we reside in the long-term cycle. But please do not allow the emotion of the times to affect whatever margin of safety you deem appropriate for your investing style. And, yes, I do realize that this is a herculean task.
In summary, I will continue to track the potential for a rally to the 9000+ area for a (c) wave to complete a long-term 5th wave ending diagonal and the likely culmination of a very long-term bull market cycle, as I have no clear indications that that long-term top has yet been struck. But, I will continue to do so with a very strong eye towards risk due to where we currently reside in that long-term cycle
But, as long as we remain below the high struck in the (b) wave, I am maintaining an expectation for a (c) wave decline to at least the top of the support box noted on the 5-mintue and 60-minute charts.
Should the market take us to that target (or even simply approach that target), and then begin a CLEAR 5-wave structure to the upside, I will be viewing that as the 1-2, i-ii set up for a rally to the 9000+ region over the coming year. Alternatively, should the market turn back up impulsively early in the coming week and break out over this past week’s high and follow through over 7635SPX, then I will also have to strongly consider the bullish alternative presented in yellow – but this is not my expectation at this time. Should either of those scenarios fail to materialize, you must respect the posture of the long-term cycle, especially if a break of the 6600-6800SPX lower end support of that box is seen in the coming months.