What Is Fibonacci Pinball, How Did It Predict the COVID Bust/Boom, and How Did It Predict The Bottoms In Gold & Silver?
If you are like most in the market, you probably didn’t expect the market to drop significantly in February and March of this year, nor did you likely expect it to bounce the way it did off the March bottom. You also probably didn’t expect the move up to 3200+ on the S&P 500 (SPX). Technically – and fundamentally – these moves just didn’t seem possible.
In fact, if you traded based on news, you would have missed much of the massive 50%+ rally in the market off the March low, as the worst news about COVID came out as we were bottoming in March of 2020. Moreover, the highest death rates were being reported daily during the rally off the March low.
But, from an Elliott Wave sentiment-based perspective, the bottom at 2191.86 on the SPX on March 23 was evident in the wave counts, which called for a low-end target of 2187.90, just 4 points below the actual bottom. The local top at 3233.13 on June 8 was just 83 cents from our ideal 3234 target evident on our charts from early April, after which we were expecting a pullback towards the 2900 SPX region.
Similarly, with Gold, you probably didn’t expect the GLD to be approaching the $200 region this year. Yet, when the GLD was at $120 in May 2019, we projected a target of $149.92 by the April 2020 period (the GLD closed at $149.45 on April 1), and then we expected much higher levels to come later this year, as we approached a long-term target in the $200 region. And, lastly, you likely didn’t expect it if you were listening to the pundits who always told you gold couldn't rally alongside equities!
The Importance of Sentiment
You see, markets are not driven by the substance of news or exogenous events, but are predominantly driven by market sentiment. Many social experiments have been conducted over the last 30 years which proves this to be true, despite the public’s belief to the contrary. And, as these experiments have proven, what does control market direction is something we term “market sentiment” or “social mood.”
In a paper entitled “Large Financial Crashes,” published in 1997 in Physica A., a publication of the European Physical Society, the authors, within their conclusions, present a nice summation for the overall herding phenomena within financial markets:
“Stock markets are fascinating structures with analogies to what is arguably the most complex dynamical system found in natural sciences, i.e., the human mind. Instead of the usual interpretation of the Efficient Market Hypothesis in which traders extract and incorporate consciously (by their action) all information contained in market prices, we propose that the market as a whole can exhibit an “emergent” behavior not shared by any of its constituents. In other words, we have in mind the process of the emergence of intelligent behavior at a macroscopic scale that individuals at the microscopic scales have no idea of. This process has been discussed in biology for instance in the animal populations such as ant colonies or in connection with the emergence of consciousness.”
The prevailing social mood or market sentiment interprets the exogenous events we hear about, and as the market moves based upon the predominant mass sentiment, the media retroactively spins the events to align with the market sentiment. If sentiment is positive, then the market will react positively, even if the news is negative, and vice versa. This is why we often see markets go up on bad news and down on good news, and it makes so many scratch their heads, especially if they are looking towards “logic” in the markets or if they are looking for their directional cues based upon the substance of the news.
This also explains why so many were looking the wrong way when the stock market bottomed in March. They were following all the news, pundits and analysis which explained how the market was going to continue to crash. And even as we rallied, if you had read most of the articles being published during the recent 50% rally in the SPX, all you heard was how the market was about to imminently crash again due to unemployment, or bankruptcies, or the 2nd wave of Covid, etc.
But true market sentiment, as measured by our Elliott Wave analysis, was pointing higher, which benefited our members in a life changing way.
Measuring Sentiment Through Mathematical Analysis
How does Elliott Wave analysis measure market sentiment, and what does “Fibonacci Pinball” have to do with any of this?
The answer begins with an understanding of a mathematical principle called “Phi.”
In 1228, Leonardo Fibonacci da Pisa published his monumental work entitled Liber Abaci, in which he “rediscovered” what is commonly known today as the Fibonacci sequence of numbers: 1, 1, 2, 3, 5, 8, 13, 21, 34, 55, 89, 144, etc. Within this sequence, each higher number is the sum of the prior two numbers, and the ratio of any two consecutive numbers approximates 1.618 or its inverse, .618. The higher you move through the sequence, the closer you move towards the 1.618/.618 relationship. This .618 number has been referred to as the “Golden Mean” throughout history. We also refer to this number as Phi.
There is significant evidence, based upon recent studies, that behavior and decision making within a herd and on an individual basis display mathematically driven distributions based on Phi. This basically means that mass decision making will move forward and move backward based upon mathematical relationships within their movements. This is the same mathematical basis with which nature is governed. The same laws that were set in place for nature also govern man’s decision making, en masse, and on an individual basis.
Elliott Wave’s Use of Fibs to Predict Markets
In Elliott Wave analysis, we use ratios based upon Phi, the Fibonacci ratio of 1.618, and its inverse .618, among other ratios, to predict the progression and regression of market prices.
Below is an example of a classic 5-wave market advance. As you’ll see, each up-wave has 5 sub-waves within it, and each down-wave has 3 sub-waves, with each sub-wave having a specific Phi-derived target.
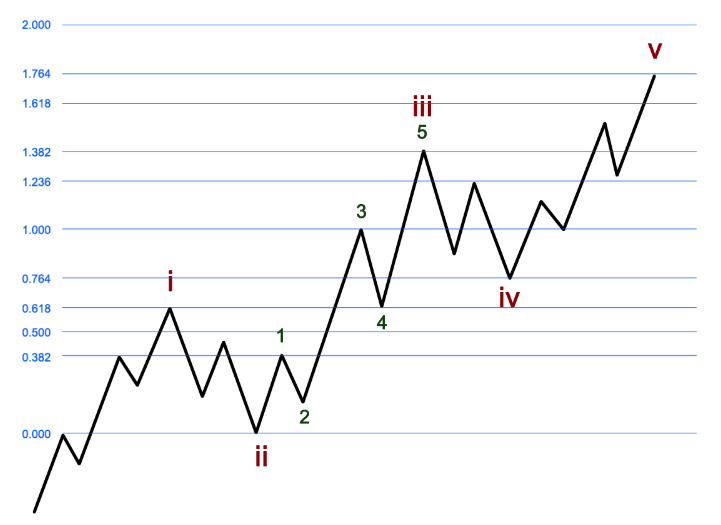
Once the first two waves (i and ii on the chart) are complete, the sub-waves of the following three waves become relatively easy to prognosticate, as they advance or decline based on Fibonacci extensions that are calculated based on the length of the first two waves.
We call this phenomenon, in which we can more reliably predict the sub-waves starting in the 3rd wave, Fibonacci Pinball.
Essentially, like a caroming pinball, price takes off in a classic 3rd wave, zigzagging in five relatively predictable sub-waves. The relative predictability continues into the 4th and 5th waves.
We used Fibonacci Pinball in predicting the market bottom in March, as well as our upside target in the SPX of over 3200 off that March bottom.
From the top near 3136 that the SPX reached on March 3, labeled wave (2) on the chart, we were able to identify a bottoming target range between 2266.43 and 2187.90, with the lower end nailing the market low.
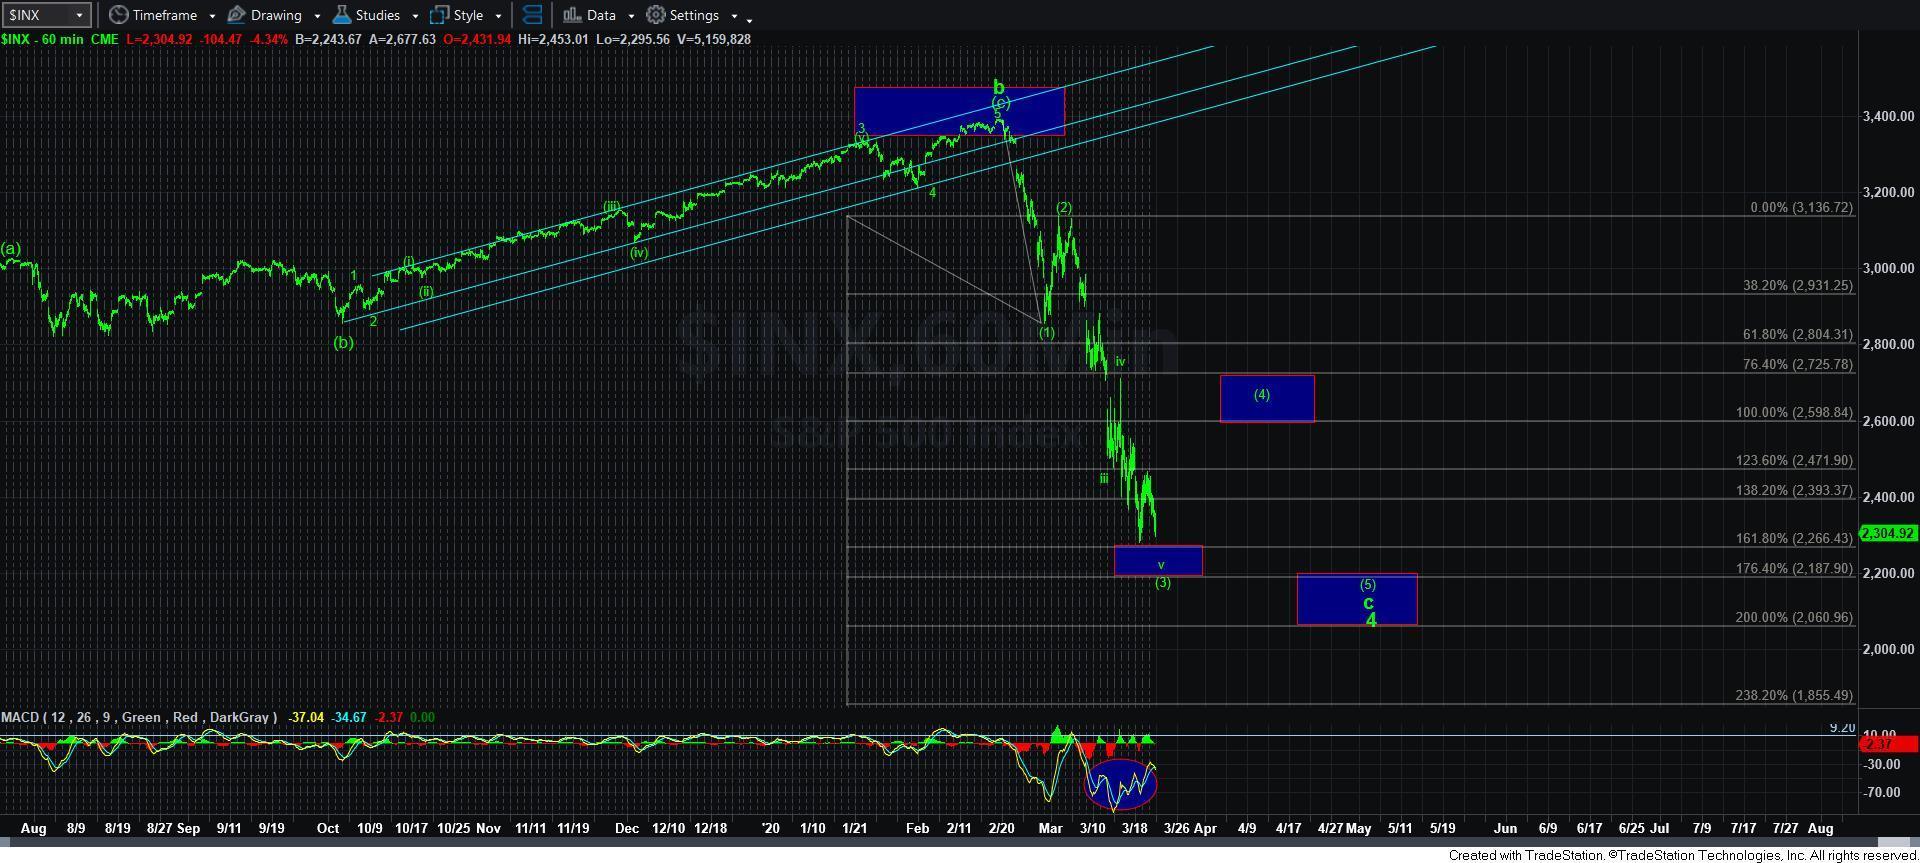
As you can see on the same chart, we were initially expecting a 4th wave rally, with an upside target of 2725 on the SPX. But, once the market moved through that resistance point, it told us quite clearly that we needed to adjust our perspective in favor of a continuing rally north of 3200 from there.
For those in our chat room, you would know that I noted to our members that I was getting back into the market as we were striking those lows in March, and was even getting back into the market with my children’s 529 plans (since I went to cash in those accounts near the highs and you can only make changes to them twice a year).
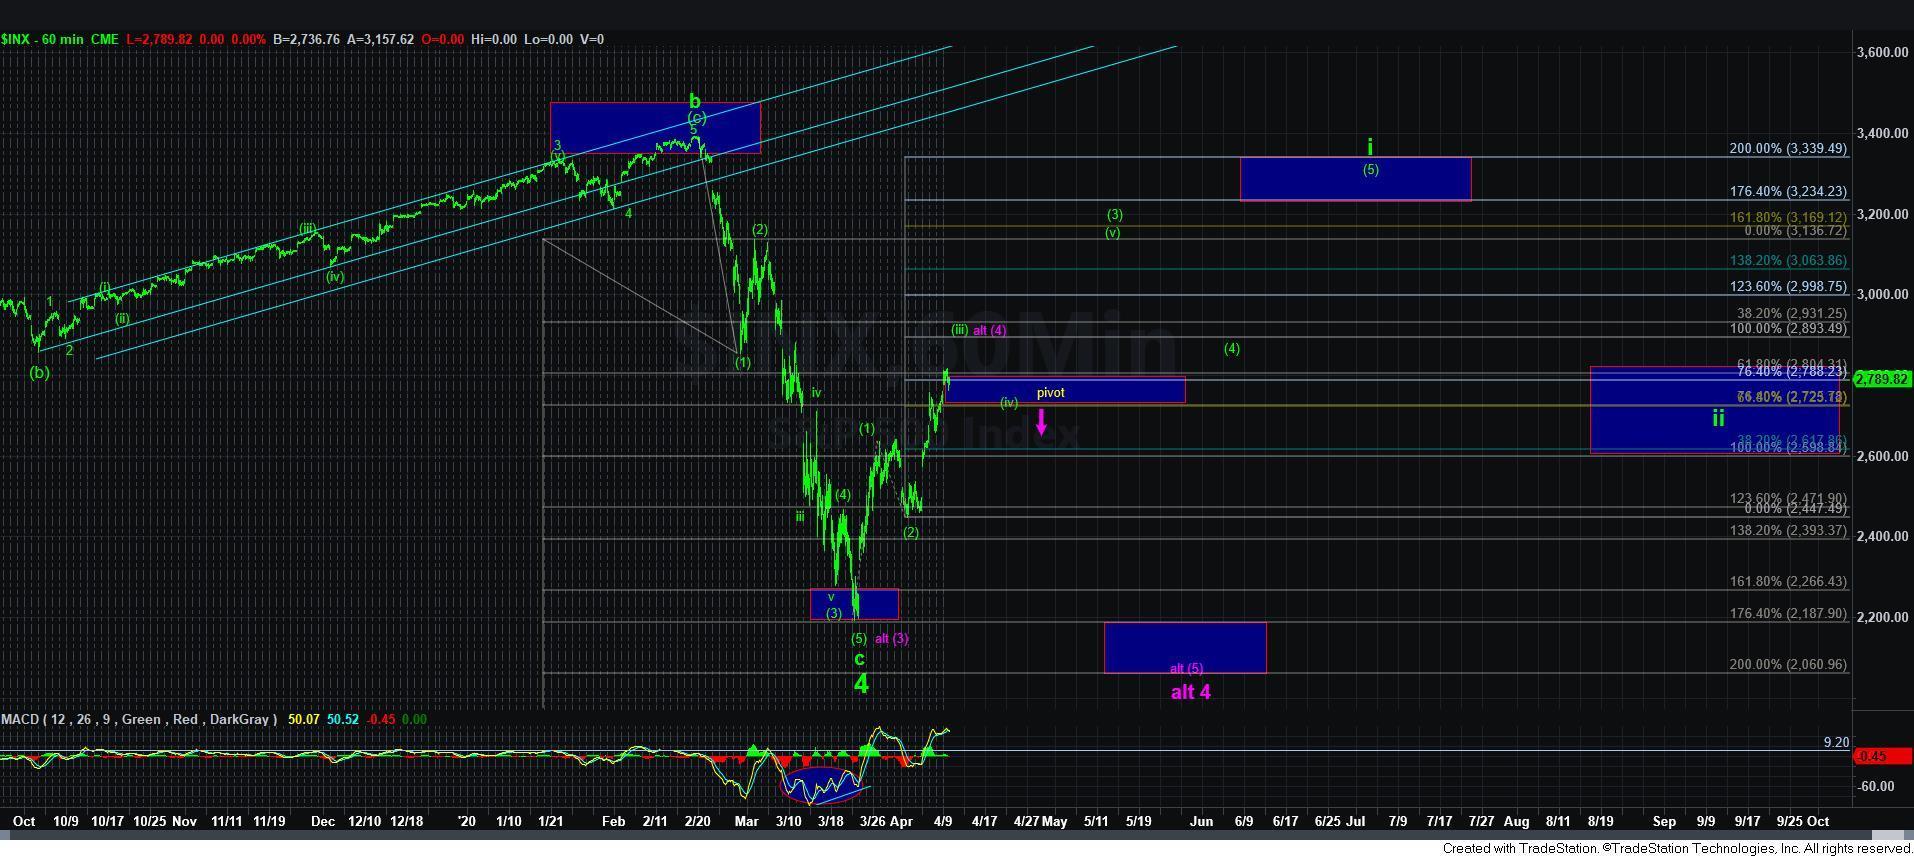
On April 11, we posted the following chart. From the trough of the wave (2) low the SPX reached at 2447.49 on April 1, a standard 176.4% extension pointed to 3234.23. That is exactly (by 87 cents) where the SPX nominally topped on June 8, and, at the time of this writing, we are still unsure if this was the high of all 5 waves off the March lows, or if we are going towards the 3400-3440 SPX region for a more extended initial 5 waves off the March low.
Forecasting Gold
Similar analysis directed our projections on gold.
On May 11, 2019, we wrote the following to our members: “Sideways seems to be the way the metals like to move over the last 3 years. And, it has become quite maddening. But, they often say that the bigger the basing, the stronger the rally. So, when we finally do break out, it would suggest that the market will be moving fast and furious to our targets overhead, as can be seen most clearly in the daily GLD chart I have attached.”
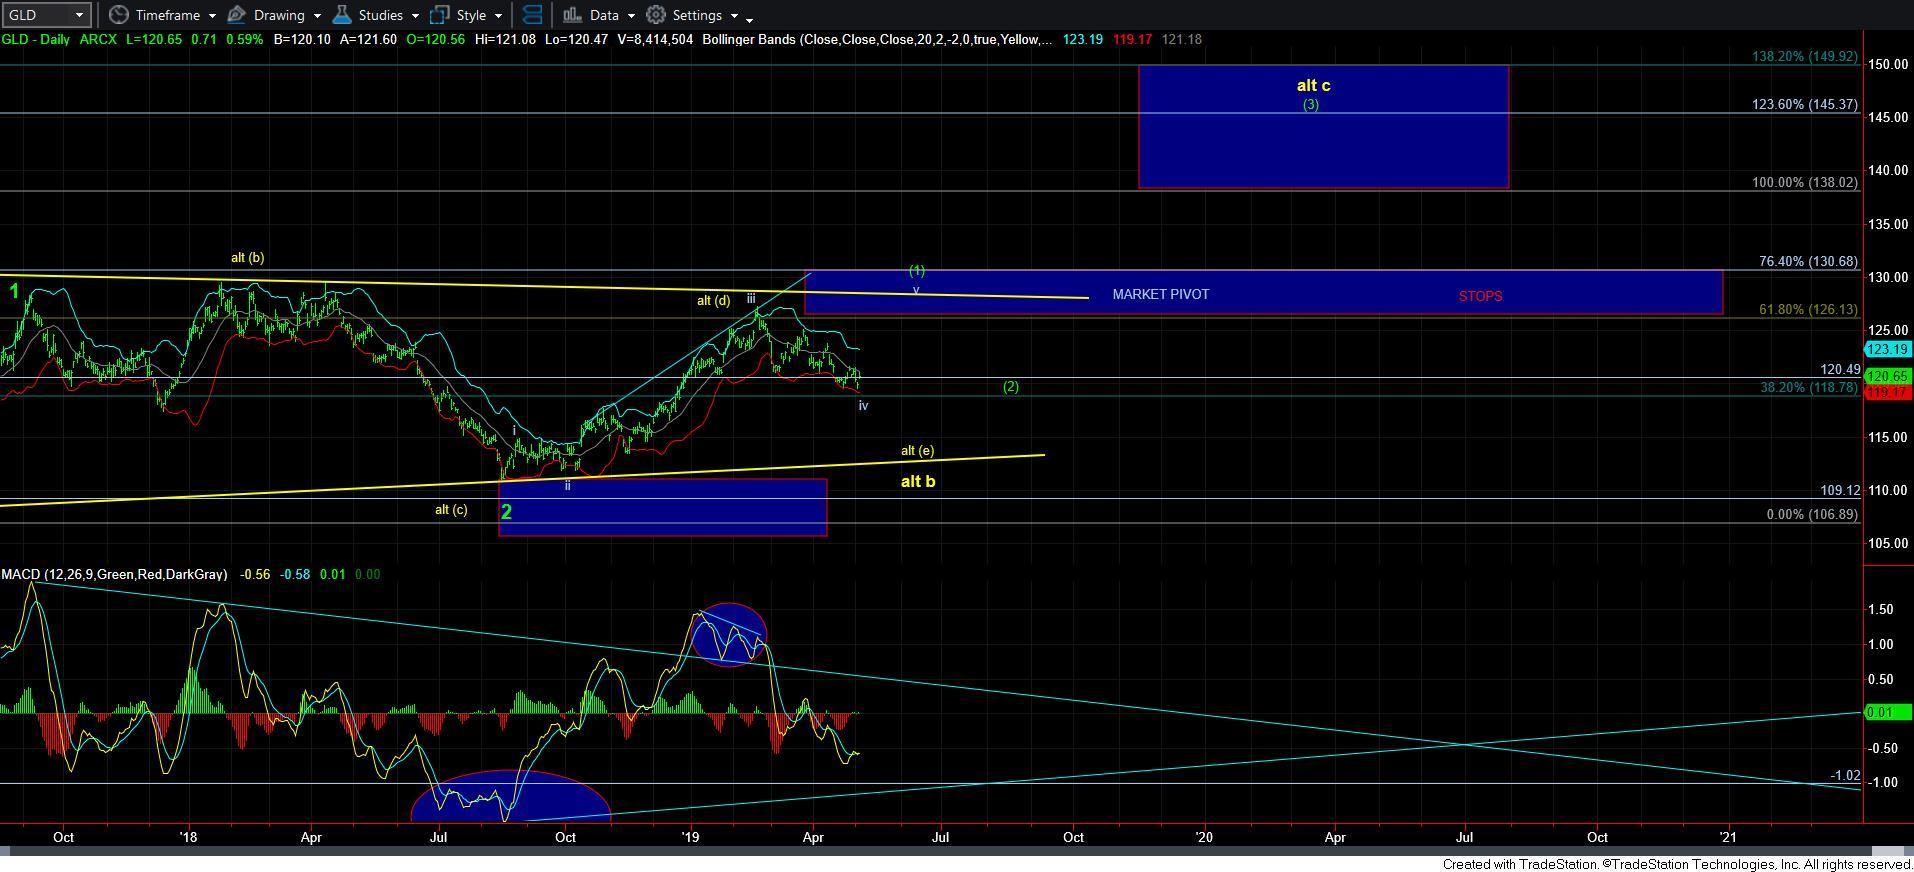
As we showed on the chart, the GLD had actually “bottomed” in a wave 2 in September 2018, and was setting up for what we know in wave 3 to be its most powerful move of the 5 waves.
That May 2019 chart only shows a portion of the expected upside, pointing to around $150 in April 2020. Here’s what a more recent chart looks like, showing the actual power of that wave 3 move – a move, incidentally, with still more upside ahead for the GLD:
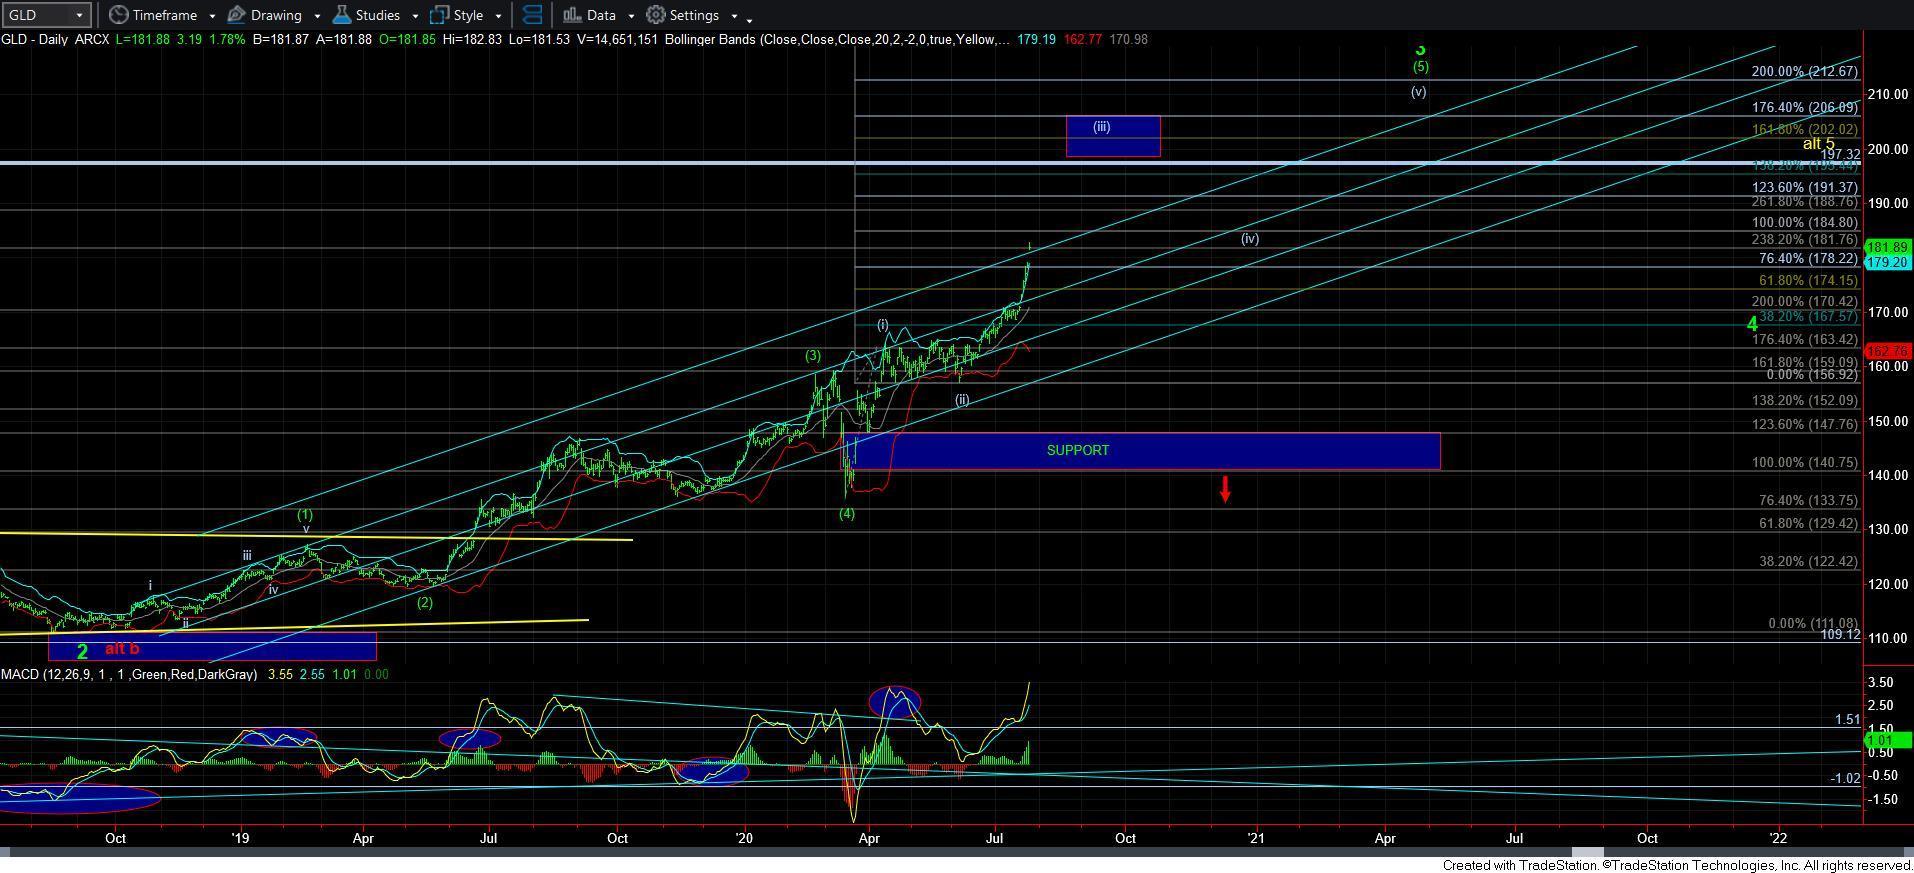
Notice that the top of wave 3 points to a near double in price off the September 2018 wave 2 low near $110. And looking at a more micro third wave count, a standard 176.4% extension off the wave (ii) low near $156 in June of this year points to the GLD reaching $206 in wave (iii), as shown in the blue box on the chart.
Looking Back To What’s Ahead
Market sentiment is clearly bullish for gold, despite what pundits may tell you about using gold as a hedge against a market downturn. Our Elliott Wave analysis anticipates this positive sentiment will continue to drive the GLD higher, to above the $200 level in the coming months.
From there we should see a major bout of weakness, perhaps at the time when news and pundits tell you all the reasons why you need to own gold.
To understand how well this methodology has worked in the metals market over the years, consider that I called the market top in gold in 2011 within $6 of the actual high struck that year, and outlined the $1000 region as an ideal target for a correction begun in 2011. This was at a time when everyone and their mother was certain that gold was going to rally through the $2000 mark during the parabolic rally we were experiencing during the summer of 2011. This really highlights the outstandingly accurate topping call we made in 2011.
Then, I told our members the night that gold bottomed in December of 2015 that I was on the phone with my broker buying gold. I was also buying mining stocks quite heavily in 2015. We even rolled out our EWT Mining Stocks Service in September of 2015 in anticipation of a major bottoming in the complex. At the time, we were buying mining stocks such as Barrick Gold in the $7 region, whereas it has more than quadrupled today, just 5 years later.
In fact, Doug Eberhardt, of Buygoldandsilversafely.com, has noted the following about my purchases from him back in 2015:
“I can attest to your accuracy on actually buying both gold and silver from us as close to the bottom as one could. With gold you called it to the letter and your limit order which was placed well in advance executed perfectly. The silver limit orders were within a tight range of the lows as well . . . Your timing on buying the dips is uncanny Avi! People should be aware of this.”
Then, again, in March of 2020, as silver spiked just below the $12 level, I noted that I was again on the phone with Doug buying silver. Doug posted the following to our members not long after that purchase in March:
“Avi has the magic touch. Listen to him . . . And I want to explain to you all what Avi did for you. He got most of you to buy the metals before the premiums shot up and before everyone ran out of product. This is the 2nd time he has done this and kudos to him for doing that for you.”
In the coming months, I will be outlining to our members where I plan to begin taking profits on the positions I bought in the mining complex back in 2015.
We also expect a pullback in the SPX in the coming the months, perhaps right when FOMO has everyone and his aunt telling you to buy.
That pullback in the SPX will actually be a primary wave ii, which we see should retrace to a minimum of the 2900 region. Once we determine a bottom for that wave, we’ll be able to measure the Fibonacci extensions that tell us where the next big primary wave iii rally in the market is headed, which could be as high as 5000 in the next few years and with all 5 waves pointing as high as the 6000 region before the start of a multi-year bear market.
Come join us in our Live Trading Room at ElliottWaveTrader.net for both our big-picture analysis on the SPX and Gold, as well as our micro counts for active traders. With 17 analysts and more than 6000 retail and professional money manager members with a range of time horizons and markets they follow, we also cover Energy, Bonds, Forex, Cryptocurrencies and much more, including all major U.S. indices and an extensive service around Individual Stocks.
