What Is ABX Telling Us?
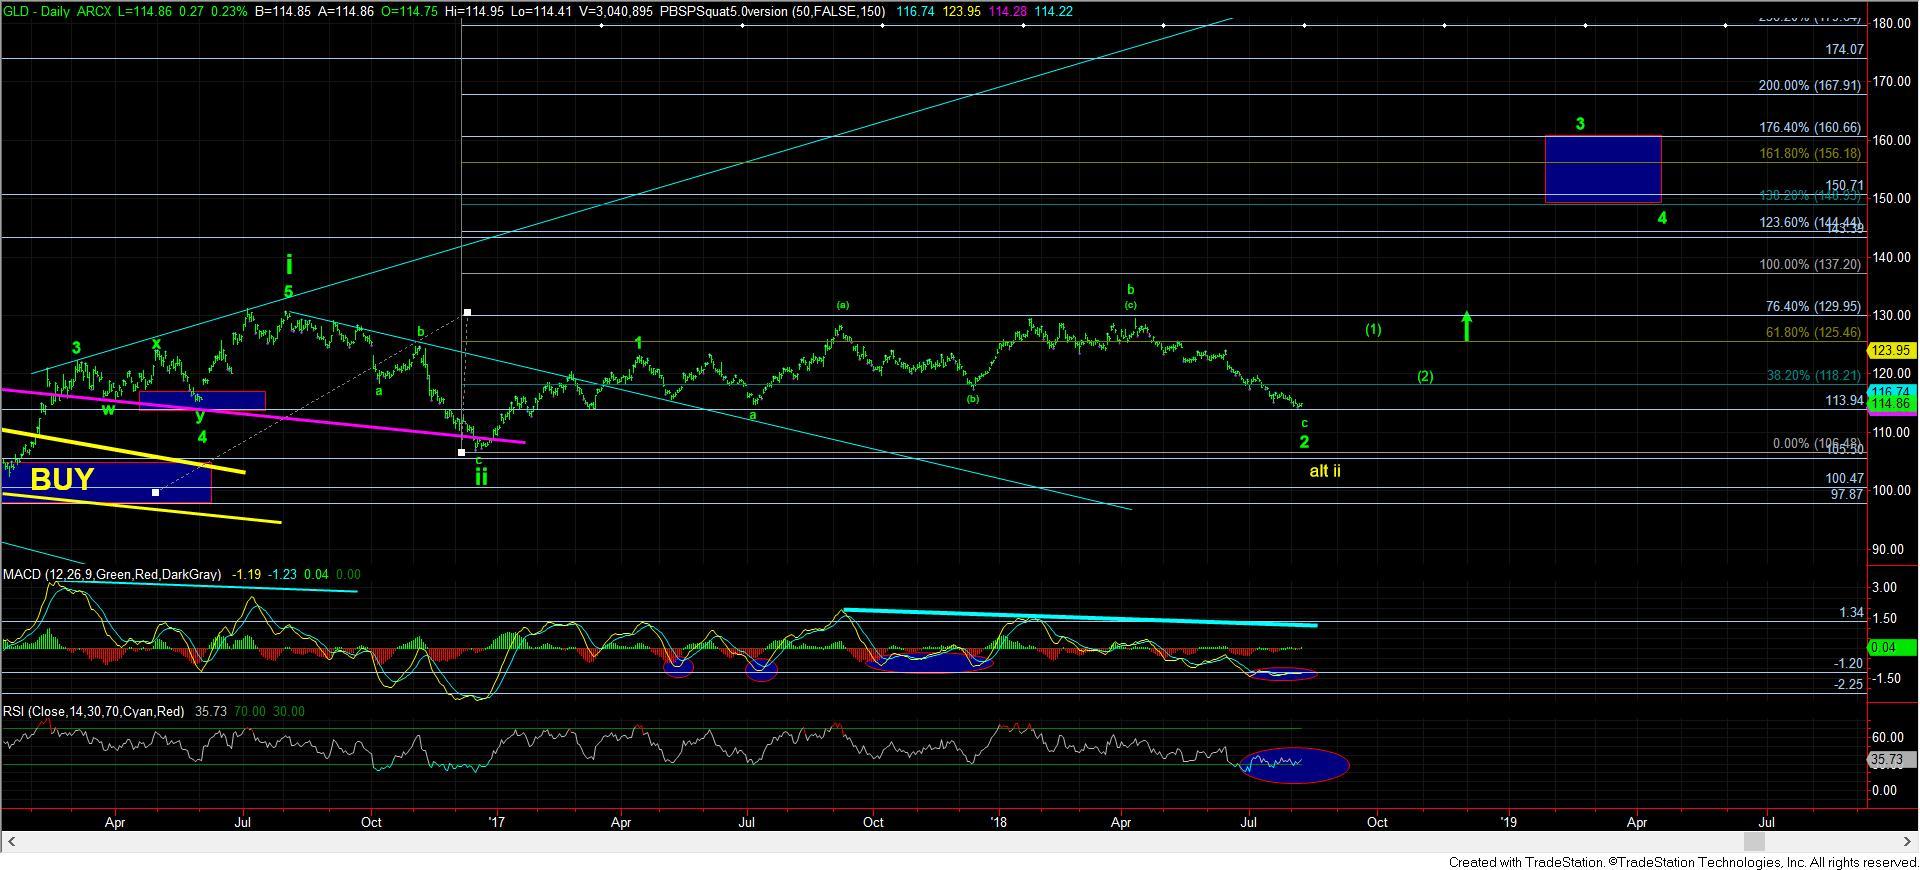
After a while, you begin to run out of ways to say that you are still looking for another 4-5 or a confirmation of a bottom in place. And, as noted on the weekend, with the GLD now striking the region we MAY finally see a bottoming in for the c-wave of 2, the market still has to prove to us that a bottom has been struck. Until such time, I am still looking for another 4-5 before we complete.
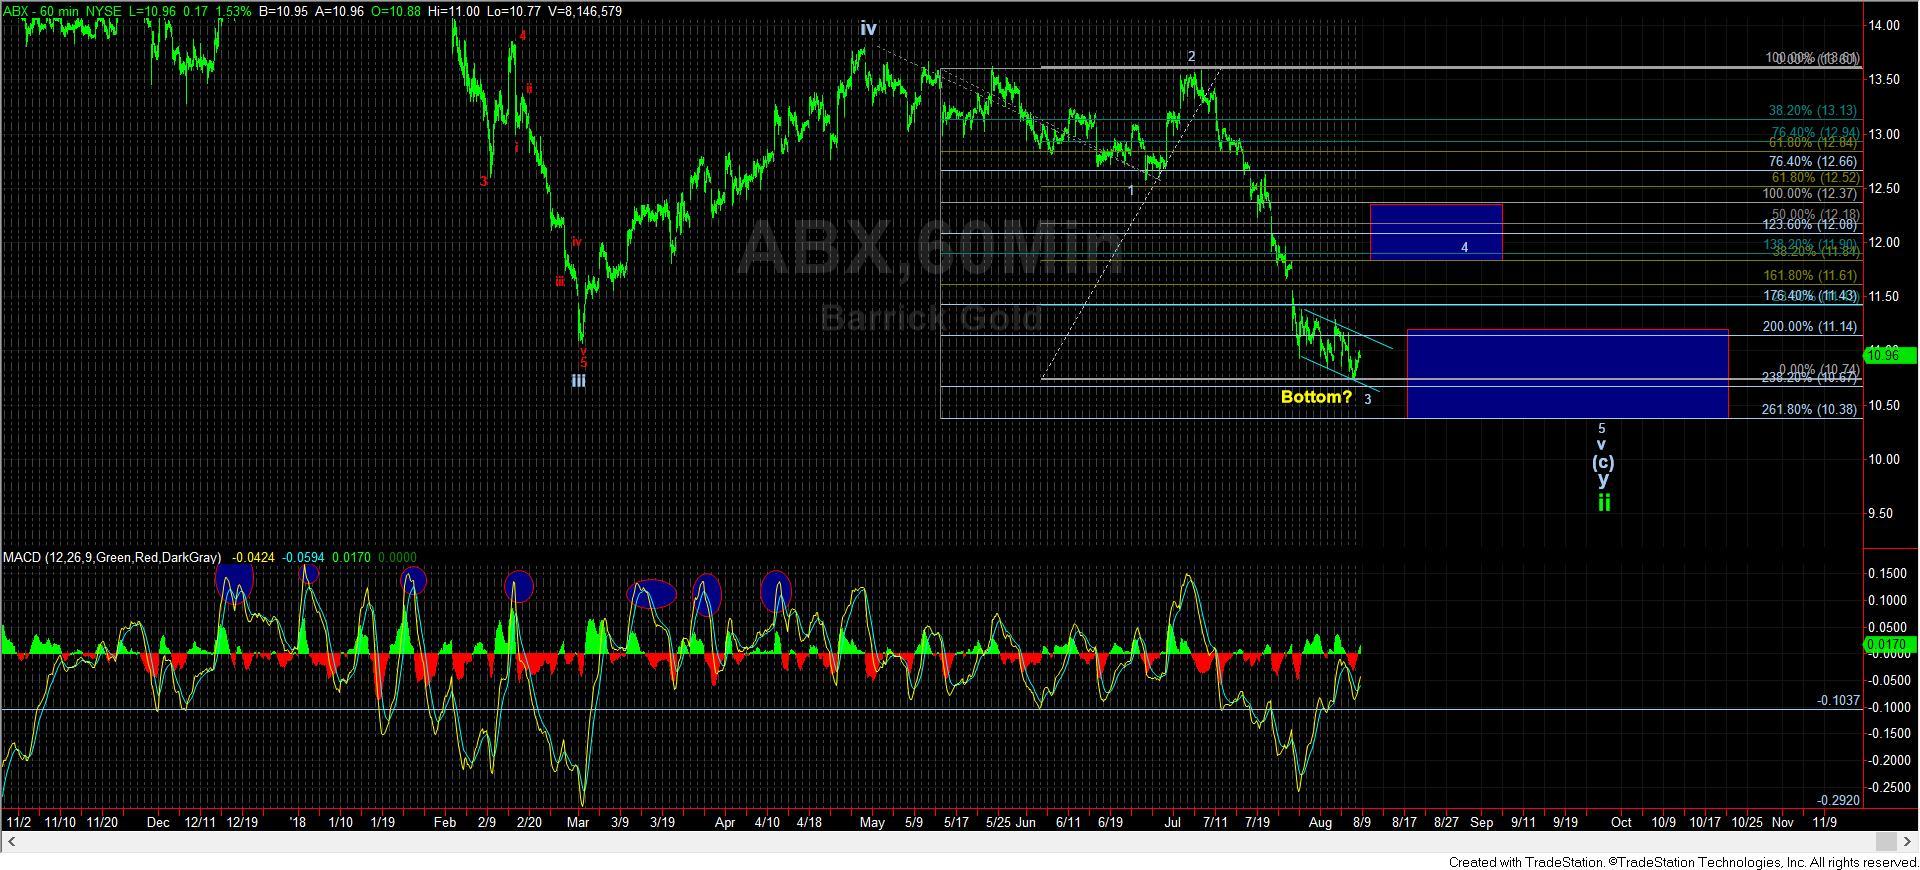
So, the question then is what is there for me to talk about in this mid-week review? Well, I think there is something interesting happening on the ABX 60-minute chart. If you will look at the structure developing since July 26th, you will notice it is a very overlapping structure which seems to be struggling to make lower lows.
Most of the time, such a structure is classified as an ending diagonal. And, that ending diagonal will likely complete the wave 3. However, this overlapping structure can also be part of an expanded 4th wave structure, with this lower low actually being the b-wave of that 4th wave. Unfortunately, I have no way to make that determination conclusive just yet, but the greater probabilities reside with the ending diagonal scenario. That means that once this downside completes, we will see a strong reaction to the upside back to the point from which the ending diagonal began, which is around the 11.40 region.
But, please do not assume that just because we see a strong reversal back to the 11.40 region that this market has certainly bottomed. You see, I really do not have a clear 4th wave in this last 5 wave segment which looks proportionate to the 2nd wave of the same 5 wave structure. While it certainly does not have to travel as high as the resistance box noted for wave 4, the bottom of that box is the .382 retracement of wave 3 down. So, it is a typical target.
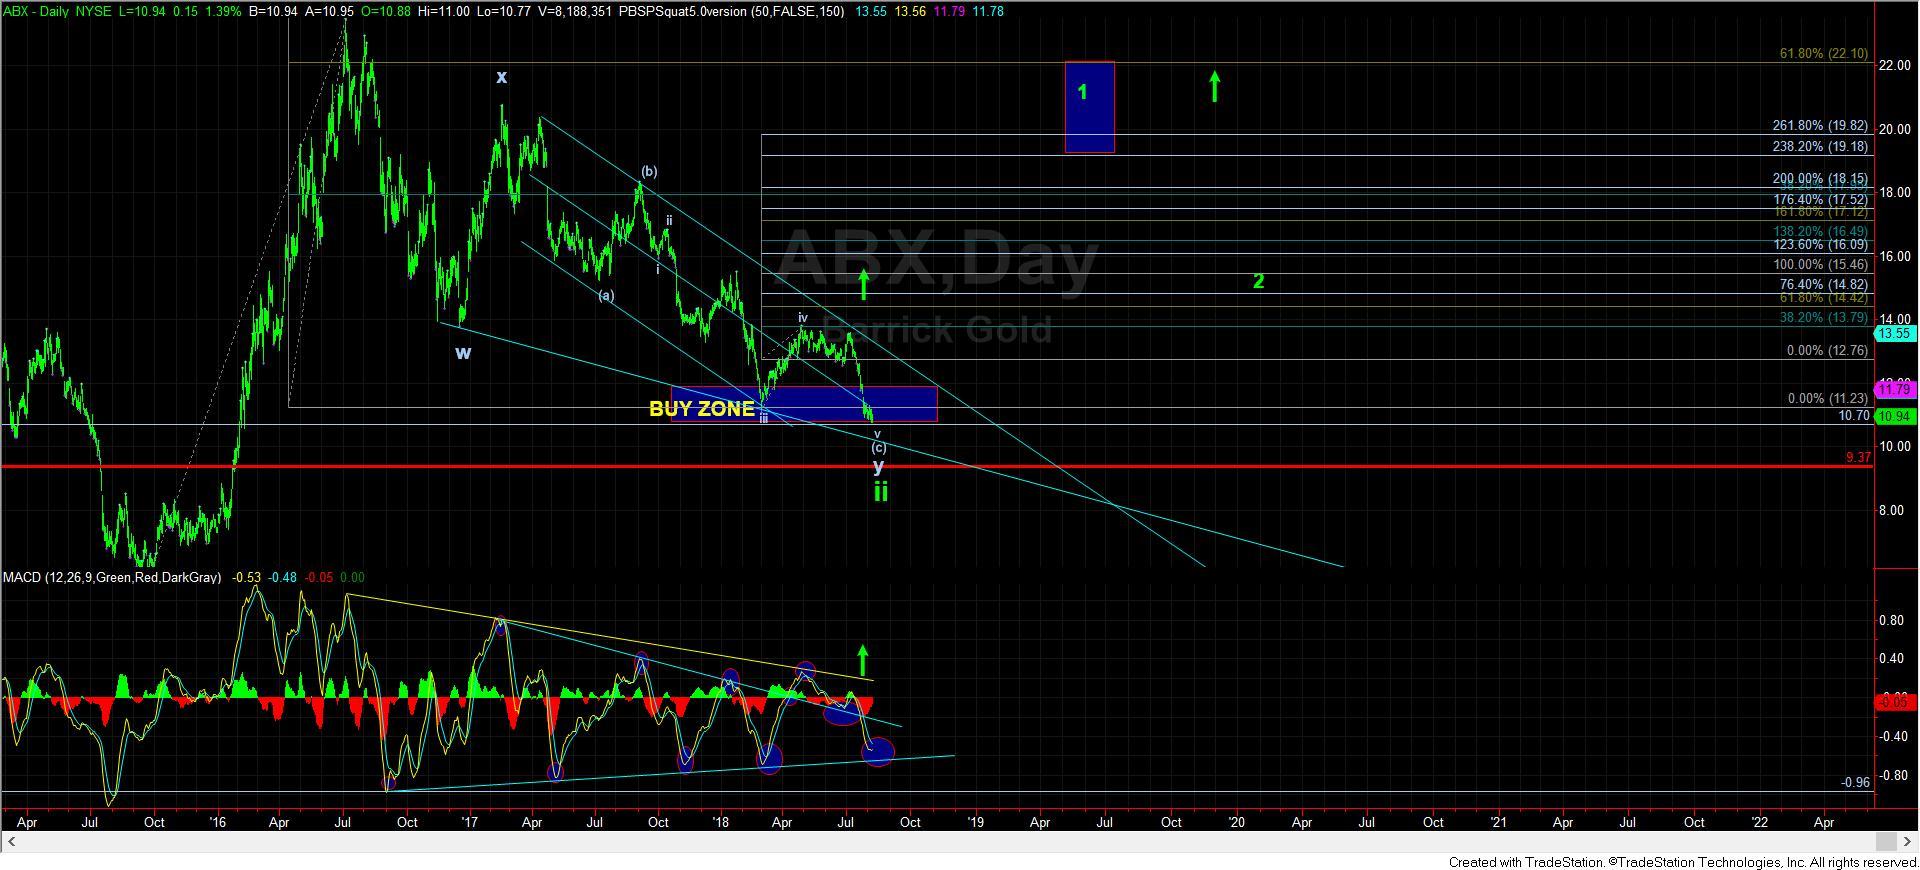
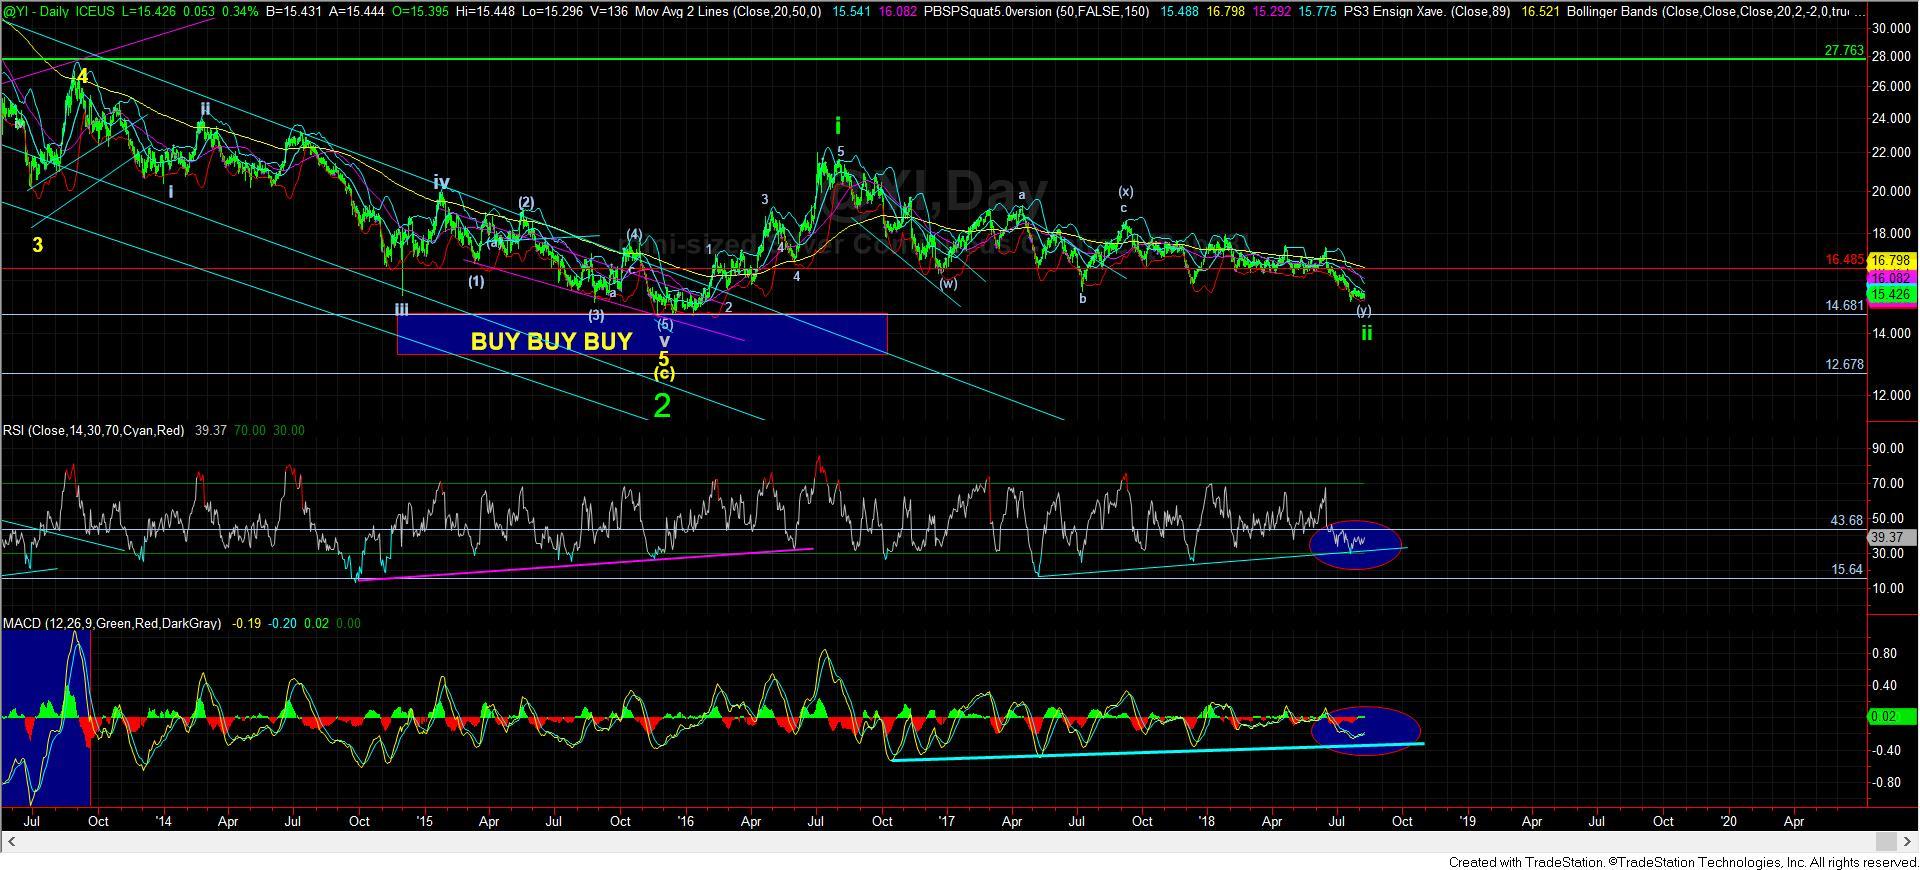
Overall, the point I am trying to make is that the ABX seems to be signaling an imminent bottoming and strong reversal. However, I am NOT confident just yet that this will represent THE bottom. While the market is certainly within the larger degree BUY ZONE we put out last year, we may still exceed this zone to the downside by a bit before we finally complete this larger degree wave ii. But, clearly, it seems the greater part of this c-wave has certainly run its course, and we are left with squiggles. Yet, even those squiggles can still take us as much as another month or two before this finally completes its downside structure.
Should the market provide us with a solid 5 wave structure off the lows, followed by a corrective pullback, and then a break out over the high of the initial 5 wave rally, then we can be more confident about a lasting bottom being struck. Until such time, I am still on the lookout for that final 4-5.