What Bottom Is This?
With the metals market now rallying as we expected this week, the question is what kind of bottom have we struck? And, the answer really depends on the chart you are viewing. But, overall, the market is still following the outlined we provided over this past weekend.
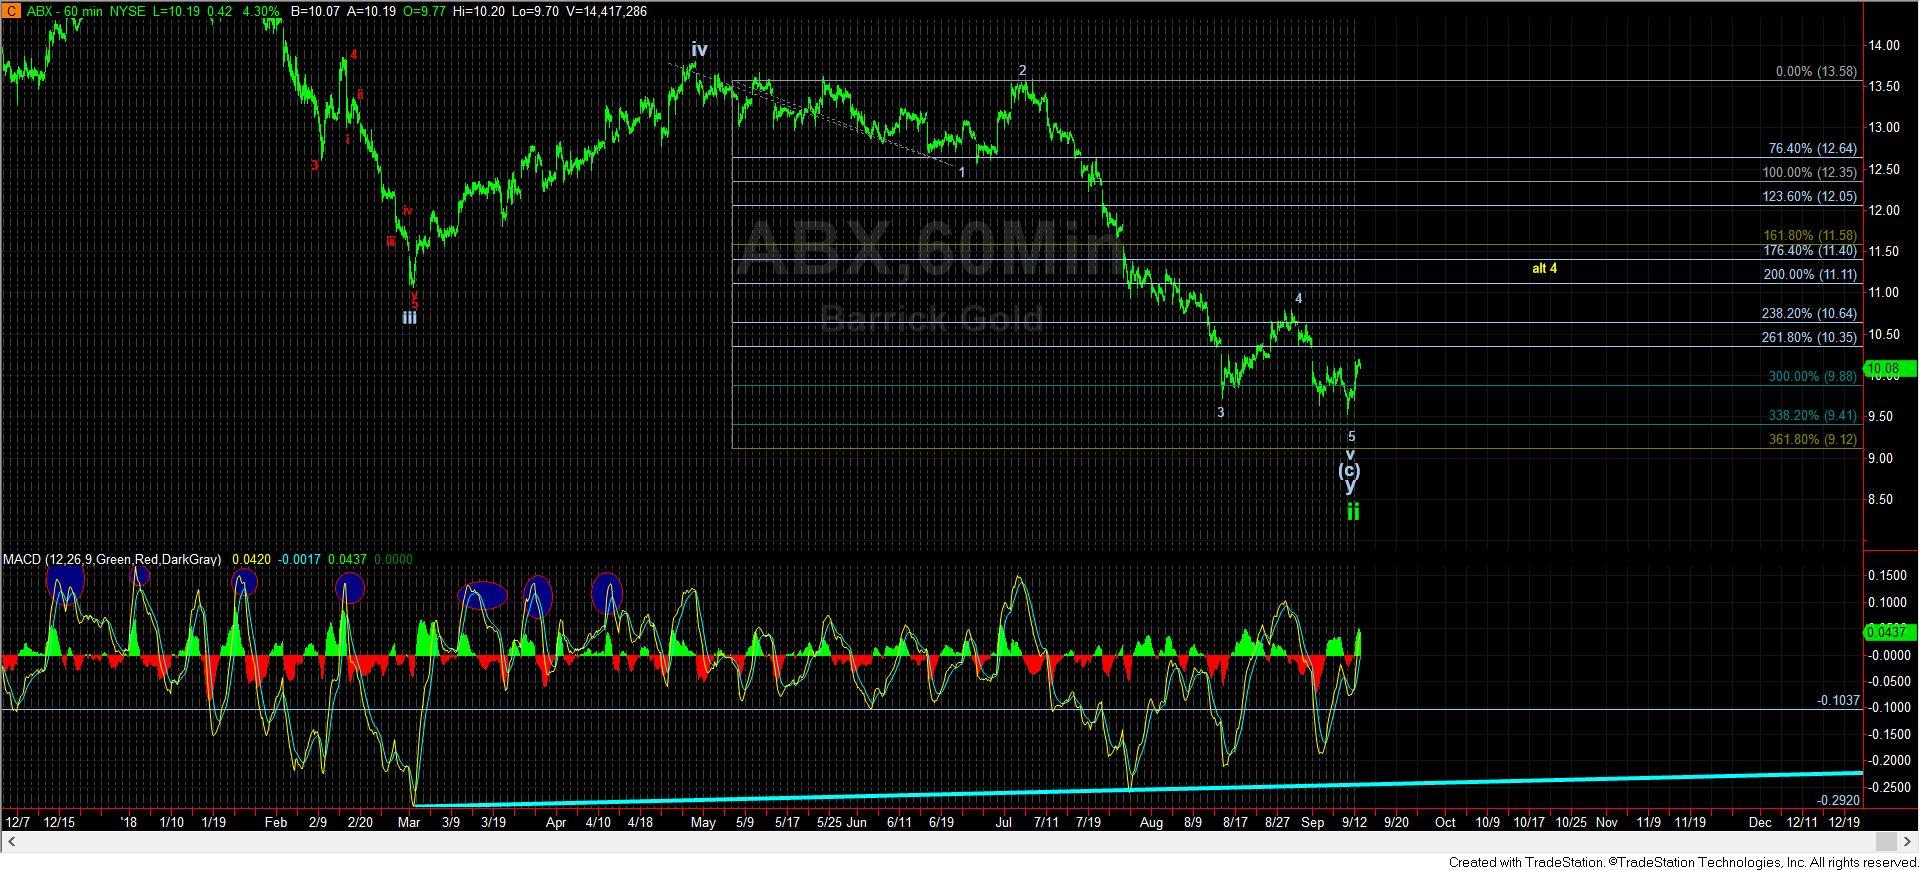
The chart that we track that has the best probability as having struck its bottom earlier than all the others still remains the ABX. In fact, we can almost count a nice micro 5 waves up off the recent lows. But, ideally, I would like to see a bit higher towards that 10.35 region.
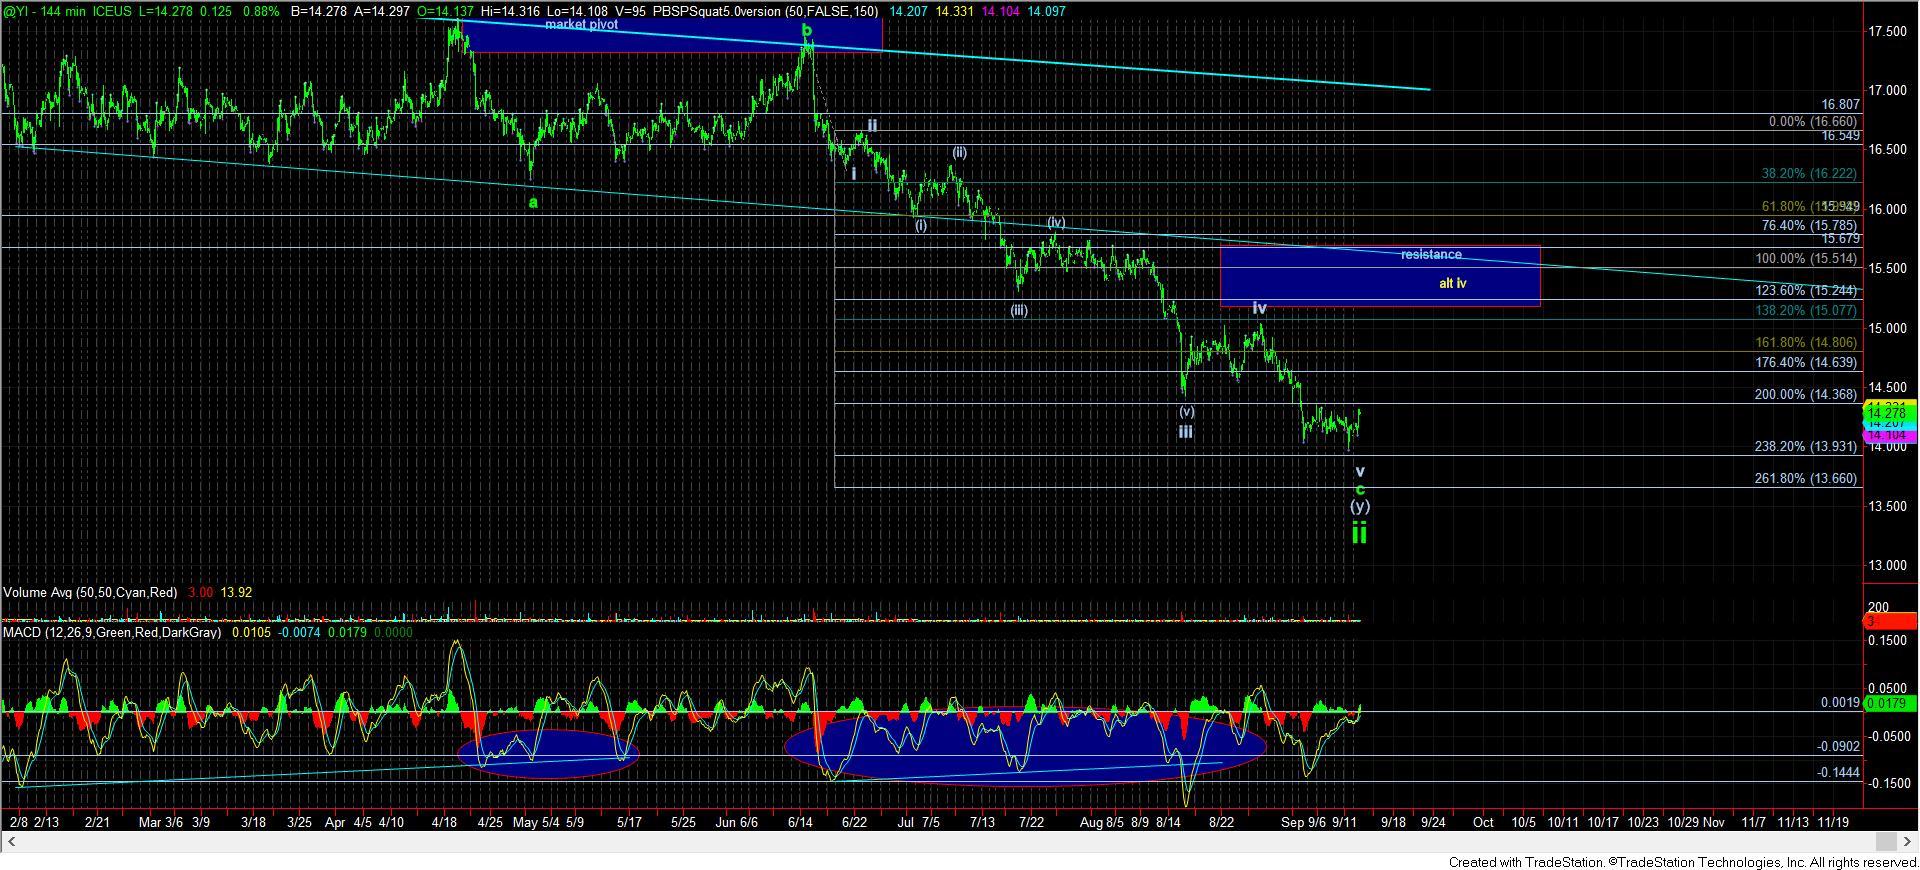
Silver may have struck a bottom with the minimum number of waves being in place for that too. However, we only have 3 waves up off that low.
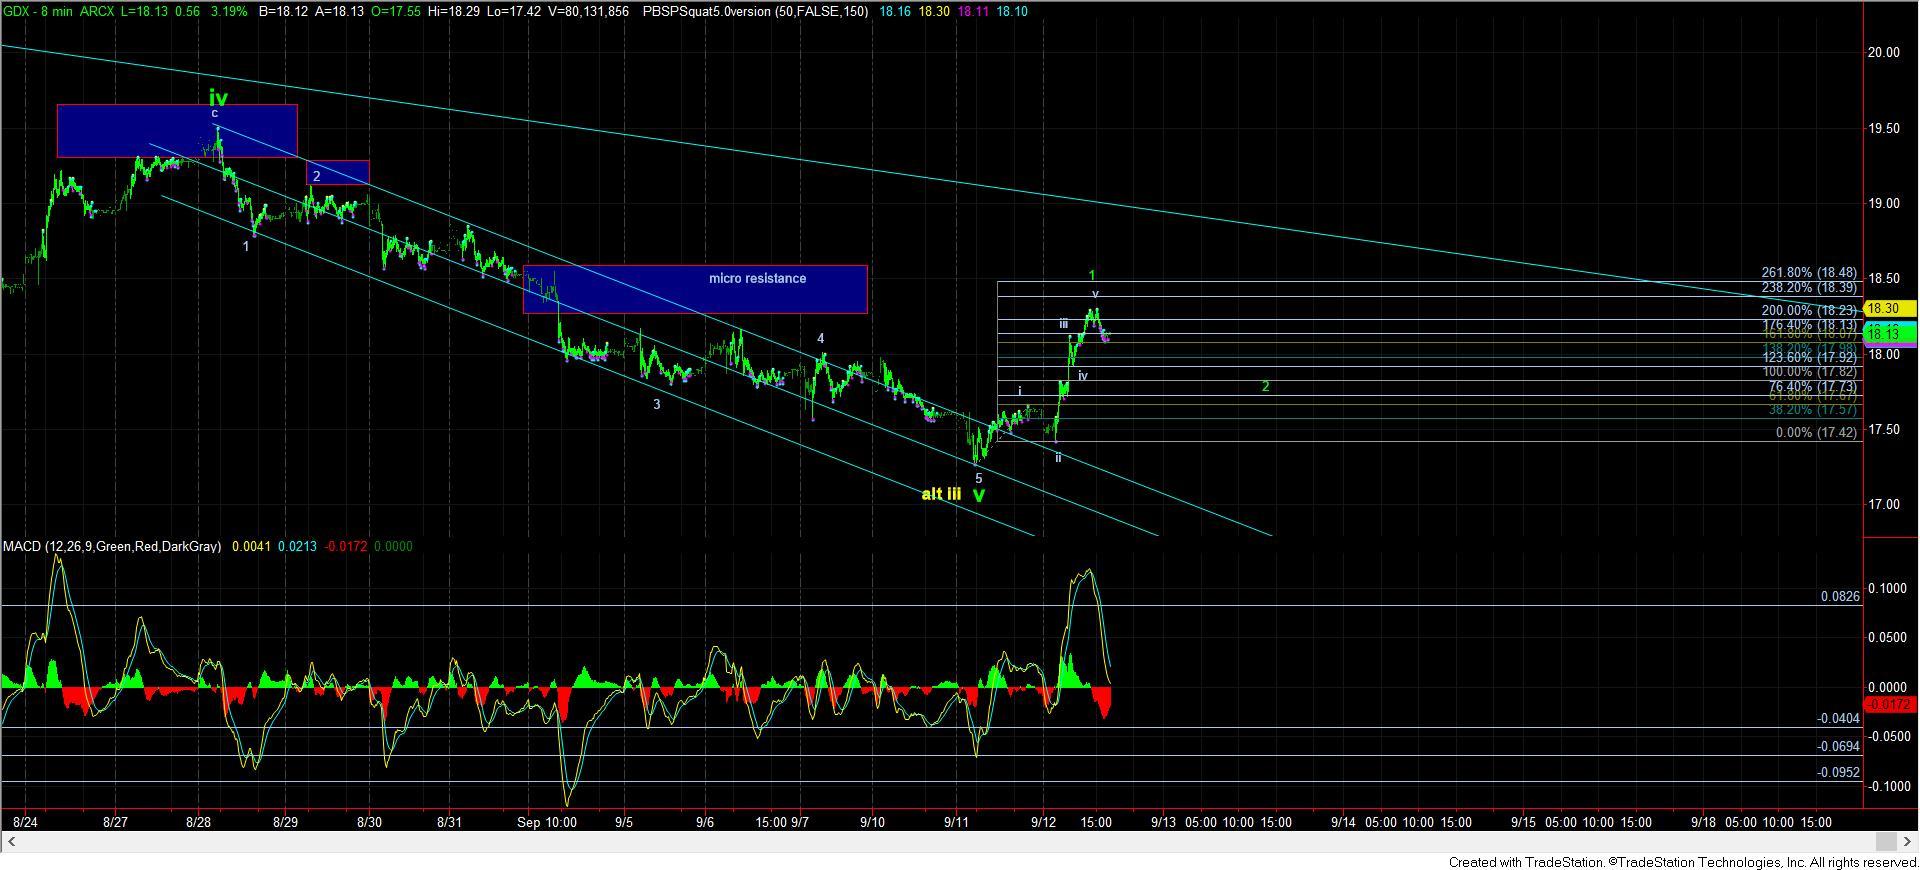
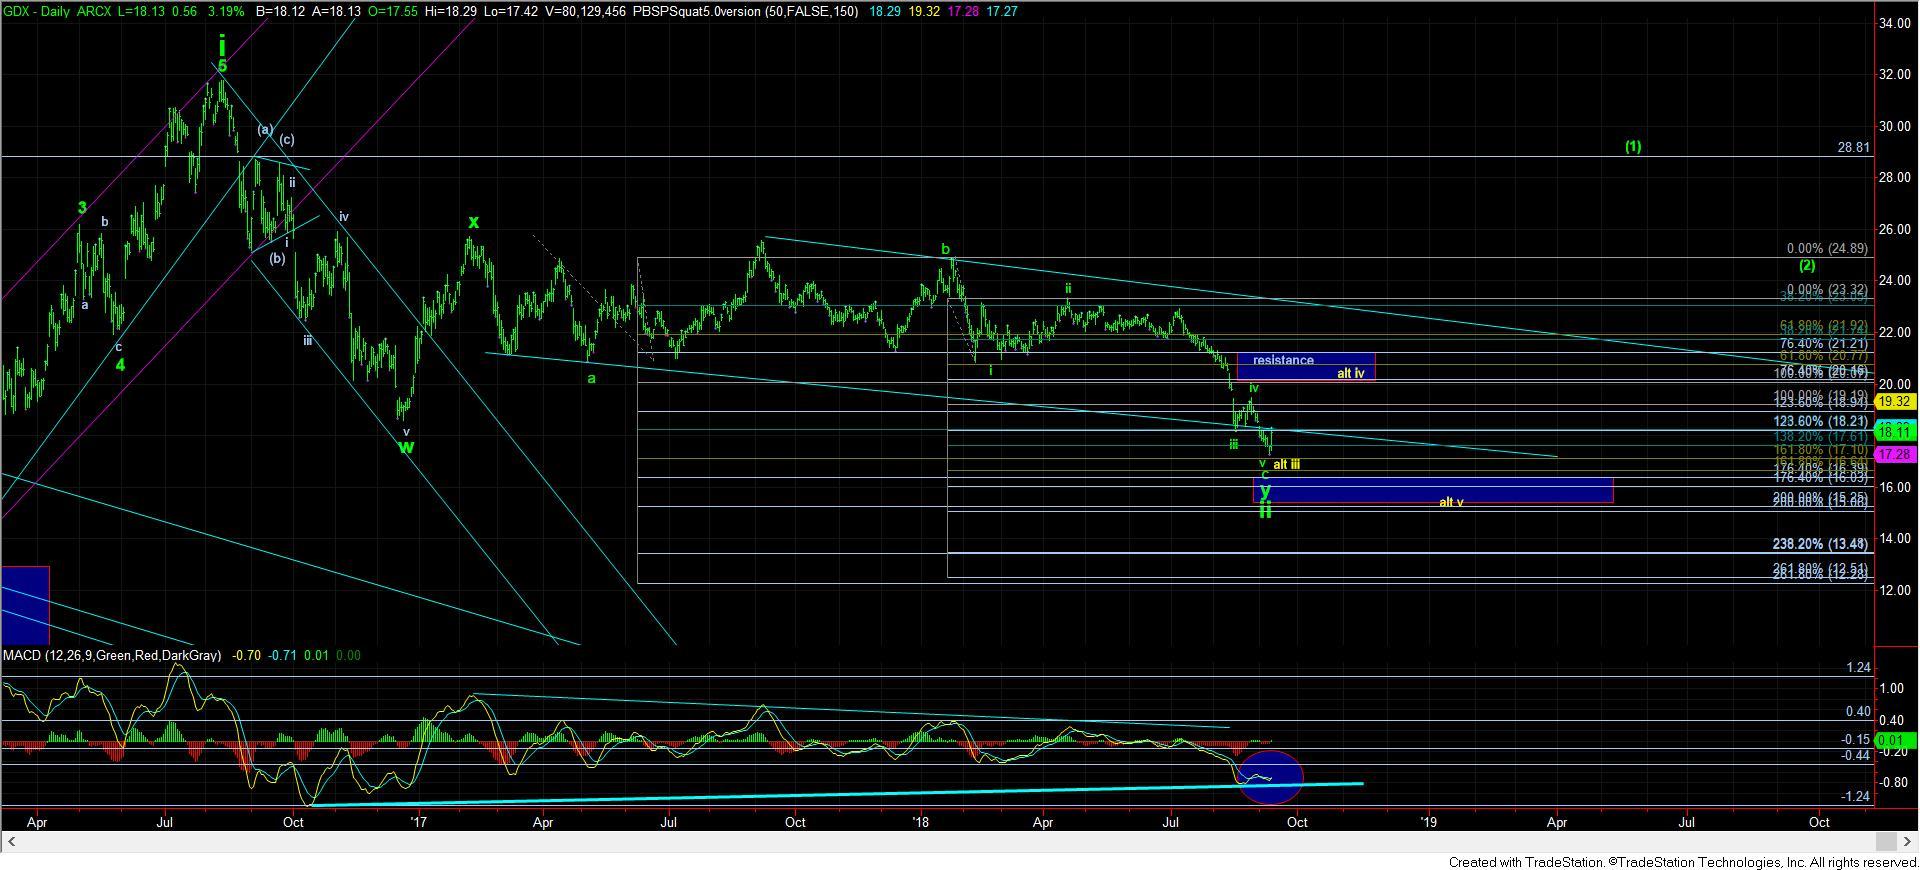
GDX has give us a 5 wave structure, but I cannot rely upon it until we see a corrective pullback, followed by a bigger 5 wave structure at one degree larger. That would turn this chart quite bullish. Until then, I will remain a bit cautious.
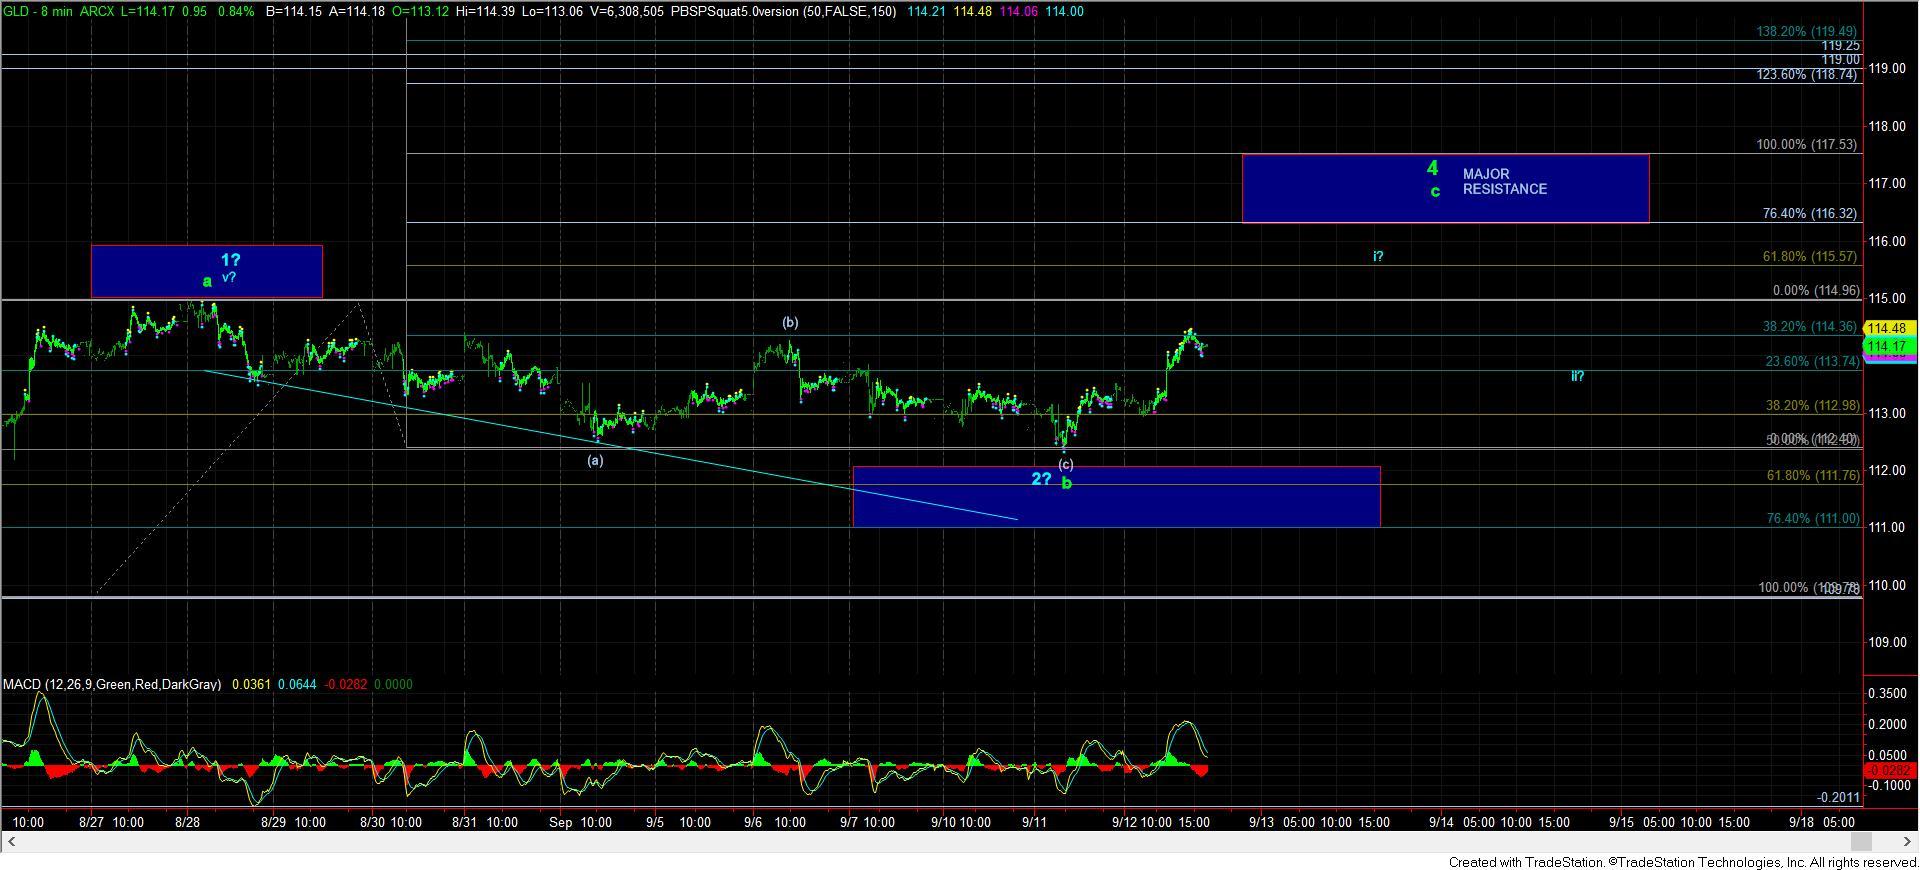
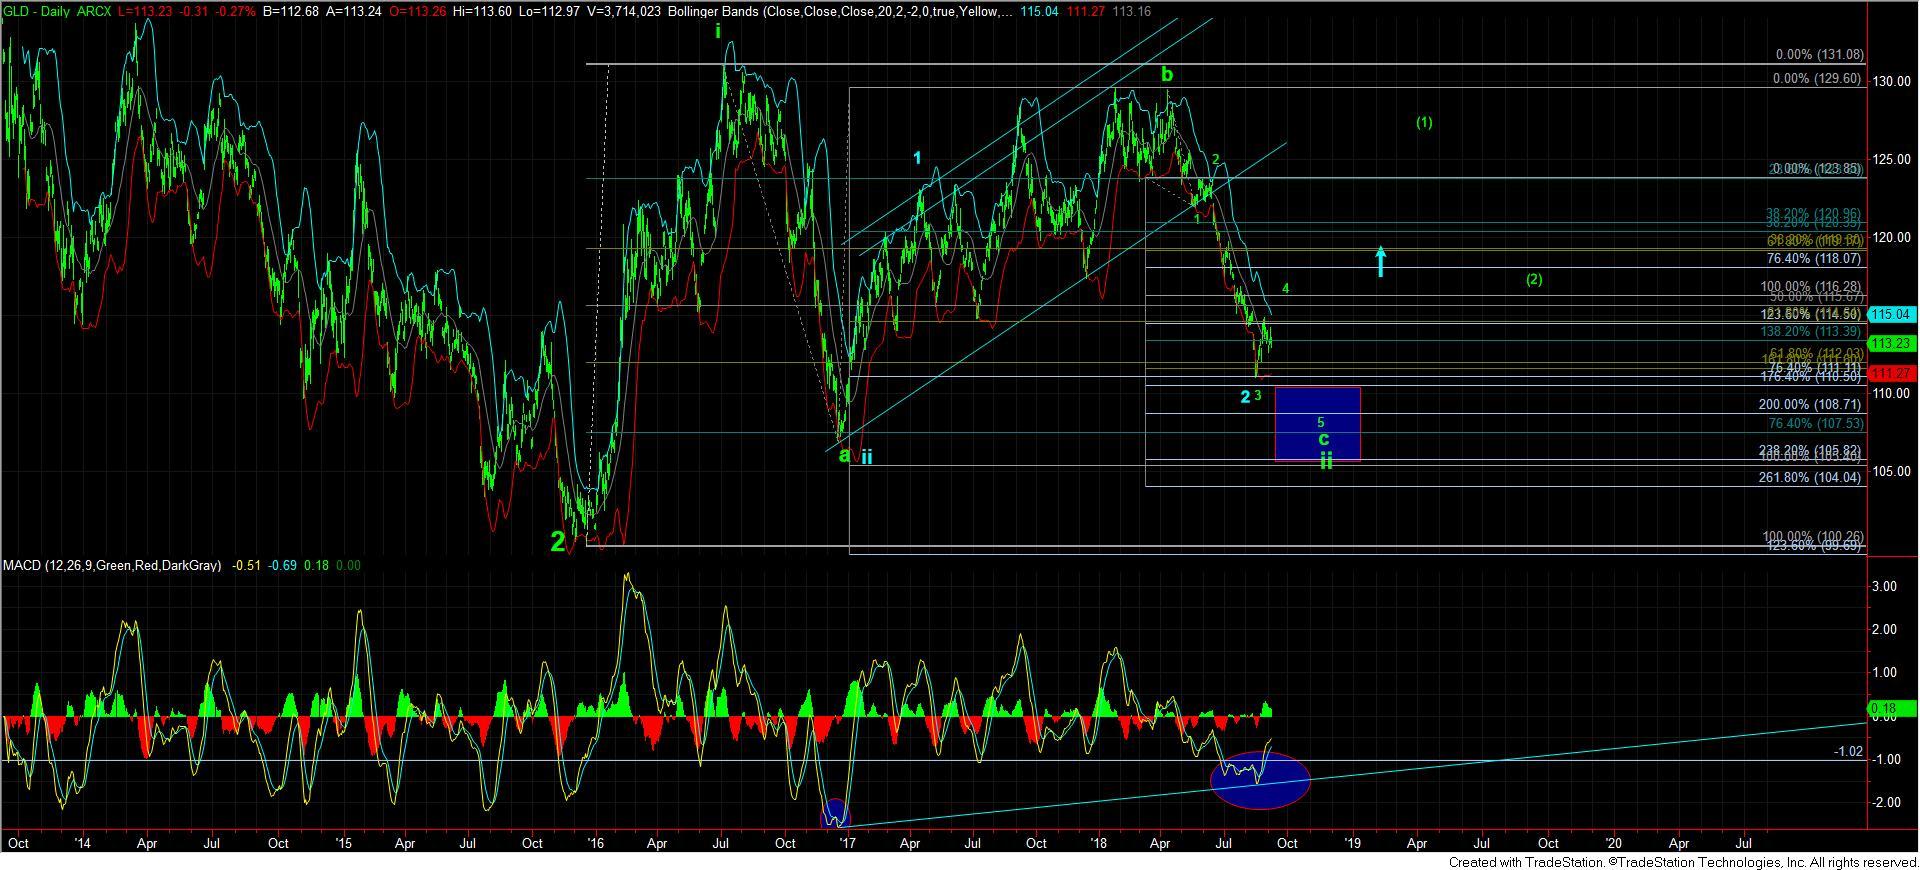
Now, GLD is probably the chart that is making me scratch my head a bit. Let me explain why. The rally off the recent low is only 3 waves up so far. Also, that 3 waves has only struck the 1.382 extension off the recent b-wave low. And, the 2.00 extension is pointing up towards the 115.50 region, which is .618 extension as calculated off the bottom struck in the middle of August. While it is possible to see the c-wave of 4 equate to .618 the size of the a-wave, I would say it is quite rare, and even more so in the metals complex. So, either we are going to see some strong extensions to get us closer to our c-wave target overhead, or the market really may have bottomed, and we are working on wave i of 3 in blue (since wave i of 3 will often target the .618 extension of waves 1 and 2). The 3rd possibility is that the b-wave of 4 is not yet complete and may try to dip one more time into our support box below, or even form a triangle. So, for now, GLD is in no-man’s land, as we have too many reasonable possibilities before us. We will need to see another day or two of action before this count clears up a bit.
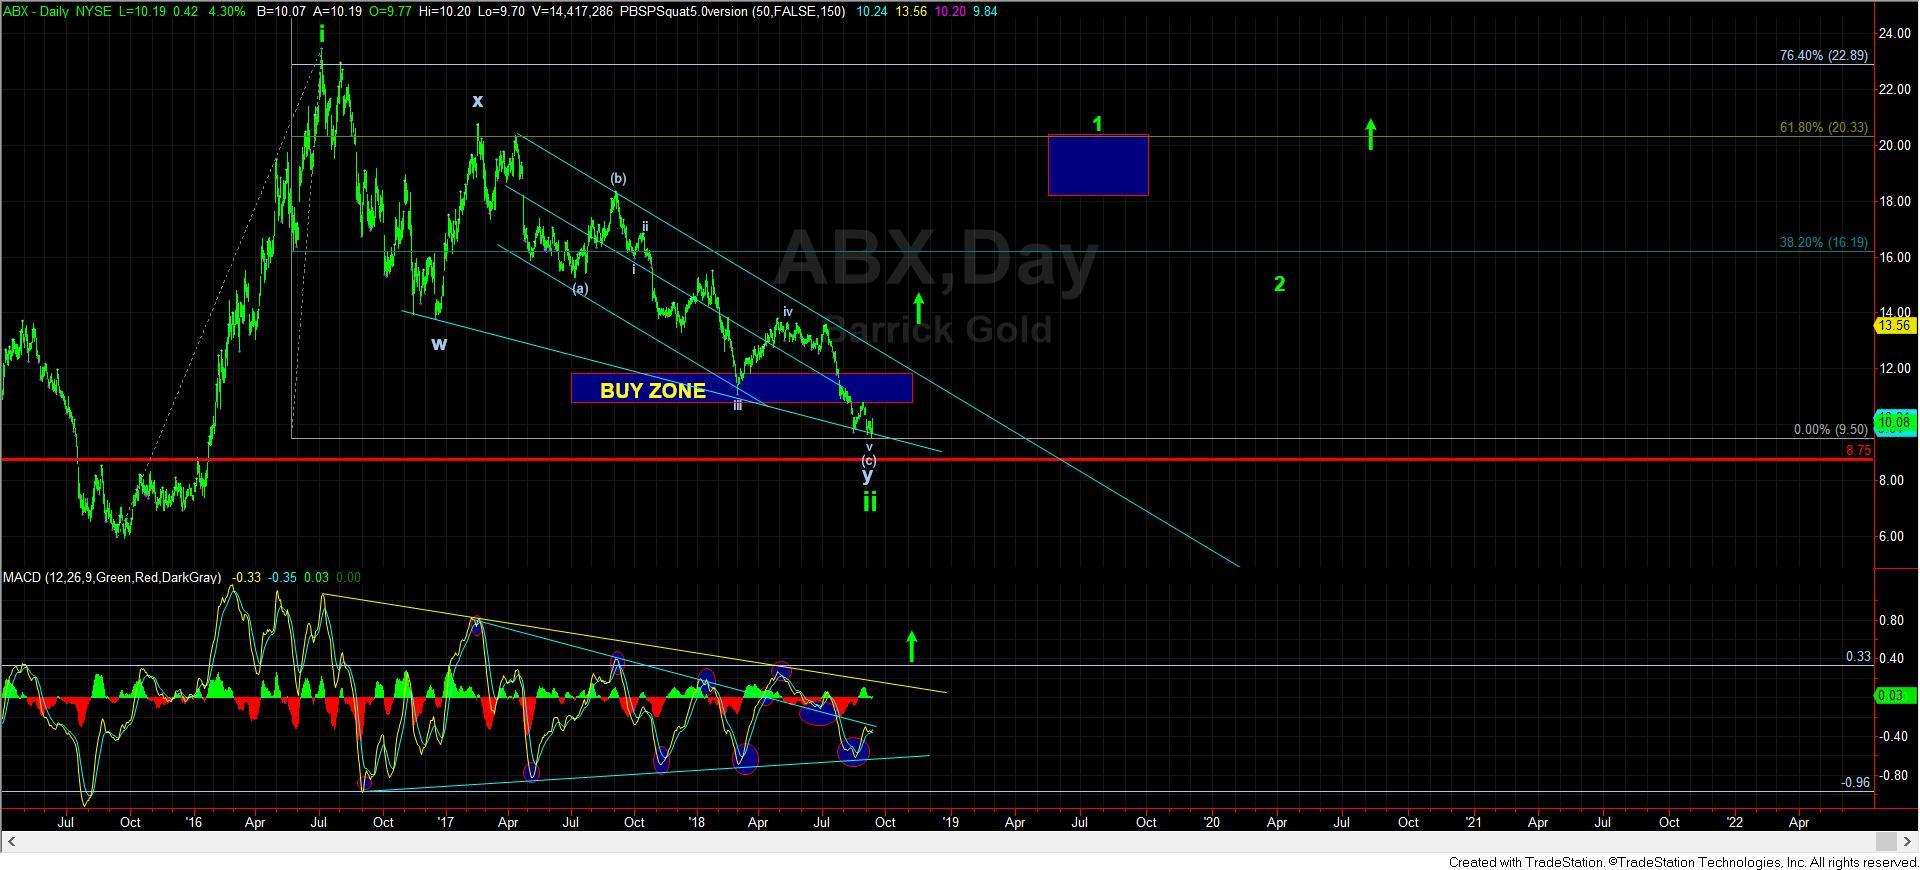
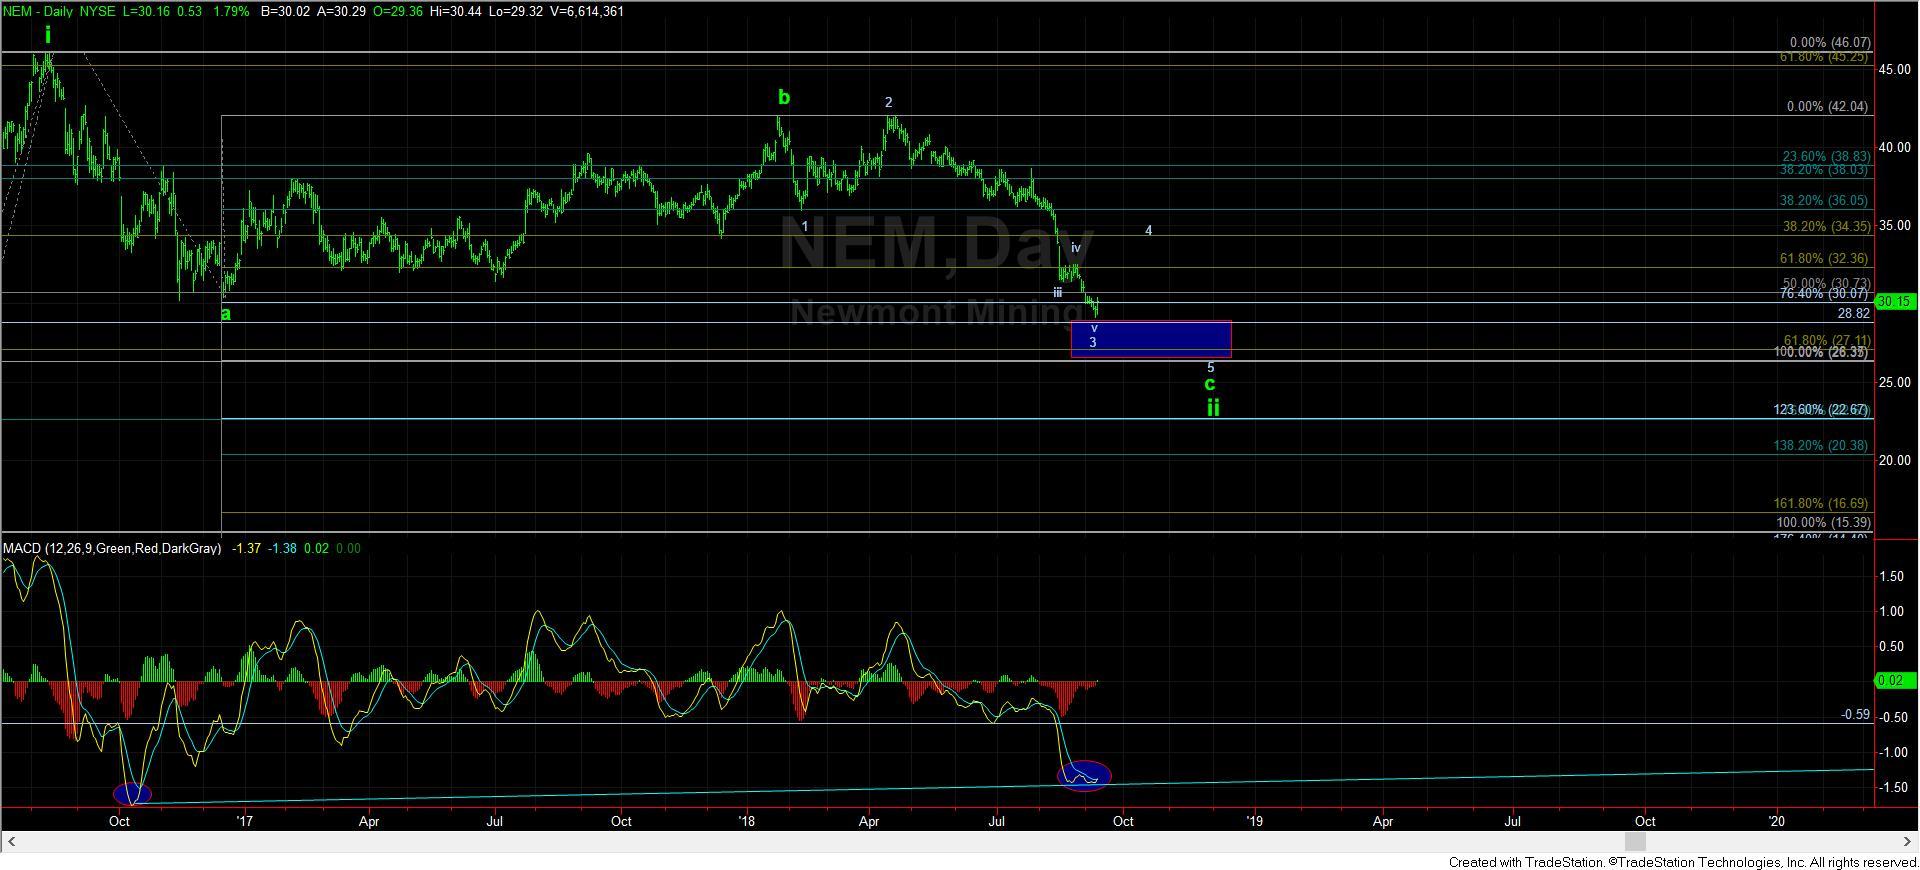
What is also quite striking is that all the positive divergences are holding in textbook fashion on the daily charts. While this does not confirm a bottom, it certainly is a strong signal of bottoming on the larger degree. It also supports the perspective that this is a c-wave pullback within a larger degree wave ii.
So, while we still do not have a confirmed bottom, I think we are seeing strong evidence of the market attempting to bottom out. While some charts clearly look like they need a lower low, whereas others may have struck their lows, I think the patterns are all filling in quite nicely, as we near the end of this 2-year pullback in this 2nd wave across the complex.

