What A Mess!
That title really conveys my frustration with these wave structures. There is nothing that I would call high probability in the smaller degree simply because of the extreme overlapping structures with which we are being presented in the silver and gold charts.
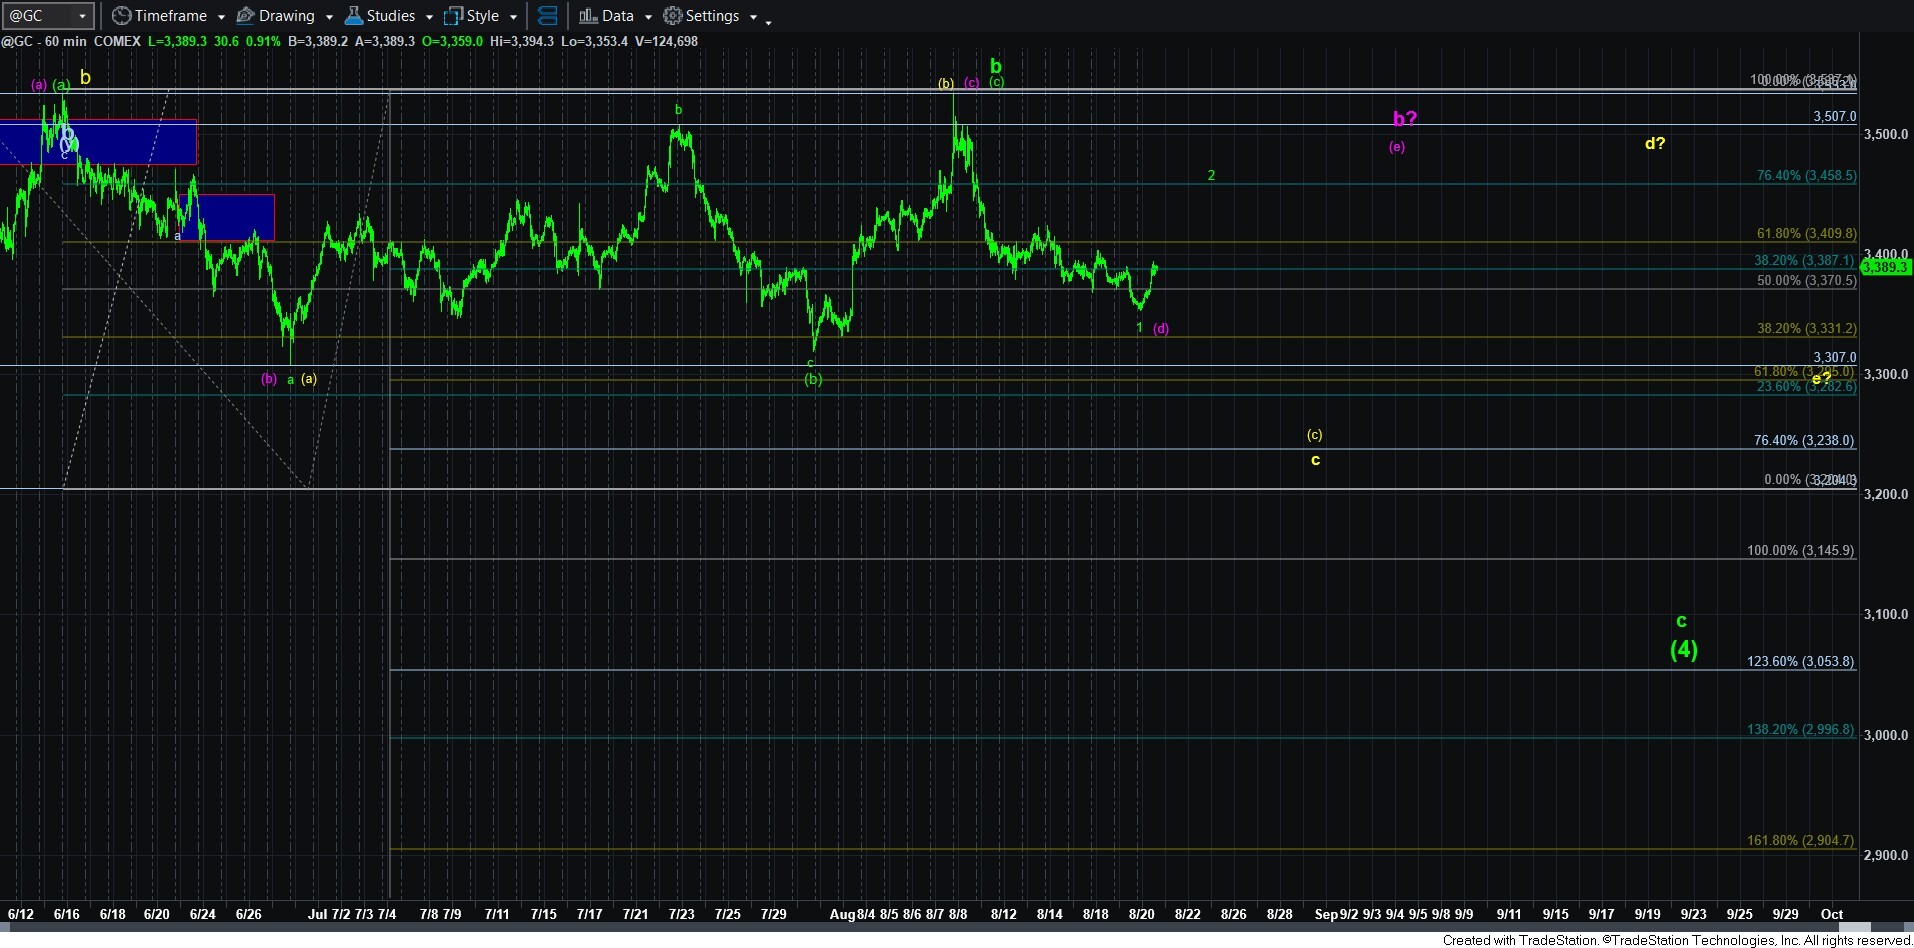
In gold, I am still viewing the purple and green counts as the most likely potentials. But, they both would still seemingly need a bigger bounce before any further downside is seen. But, if we see a move lower in a more direct fashion, I would begin to view the yellow count with a bit higher probability.
Overall, there is nothing to which I can point right now in the gold chart that would suggest the correction has completed or for a trade to be taken with any reasonable probability. We are simply going to have to be a bit more patient to allow the region to clarify in the coming days.
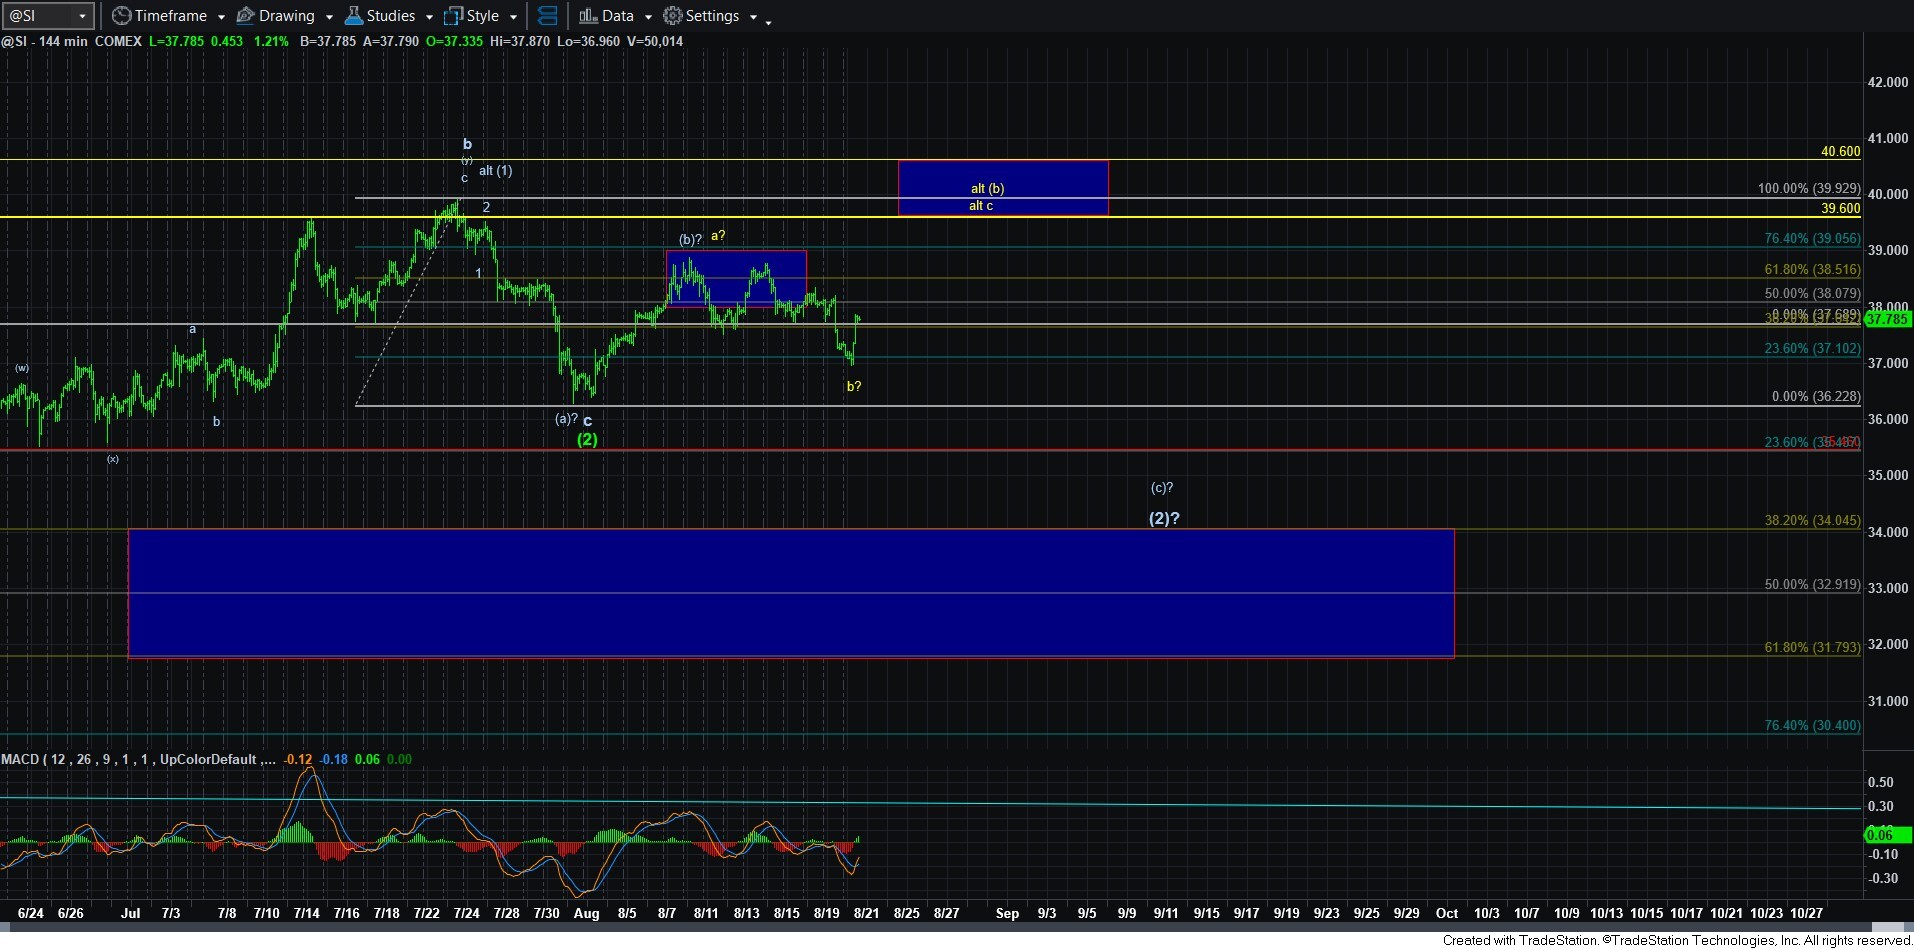
I presented my misgivings with the potential for an impulsive decline to have actually begun to the downside in my silver updates yesterday morning (because of the seemingly 3-wave overnight decline the other day), therefore, the pre-market action did not come as a major surprise to me. Right now, I have no impulsive downside count to which I can point other than a potential ending diagonal taking shape for the (c) wave down. But, even that has some issues.
I am starting to warm up to another rally higher, as presented by the alternative (b) wave in yellow. And, until we break below the overnight low, I think that path as a reasonable probability. Should the market follow through on that path, the ideal target is the 39.55/39.60 region, wherein we have an a=c target, which is the bottom of the resistance box on the 144-minute chart. The top end of that box is where c=1.382*a, and as long as the market is contained within that resistance box, I am still looking for a (c) wave lower. But, as I said above, I don’t see anything that I would classify as a high probability scenario – other than in the bigger picture we are likely looking a lot higher.
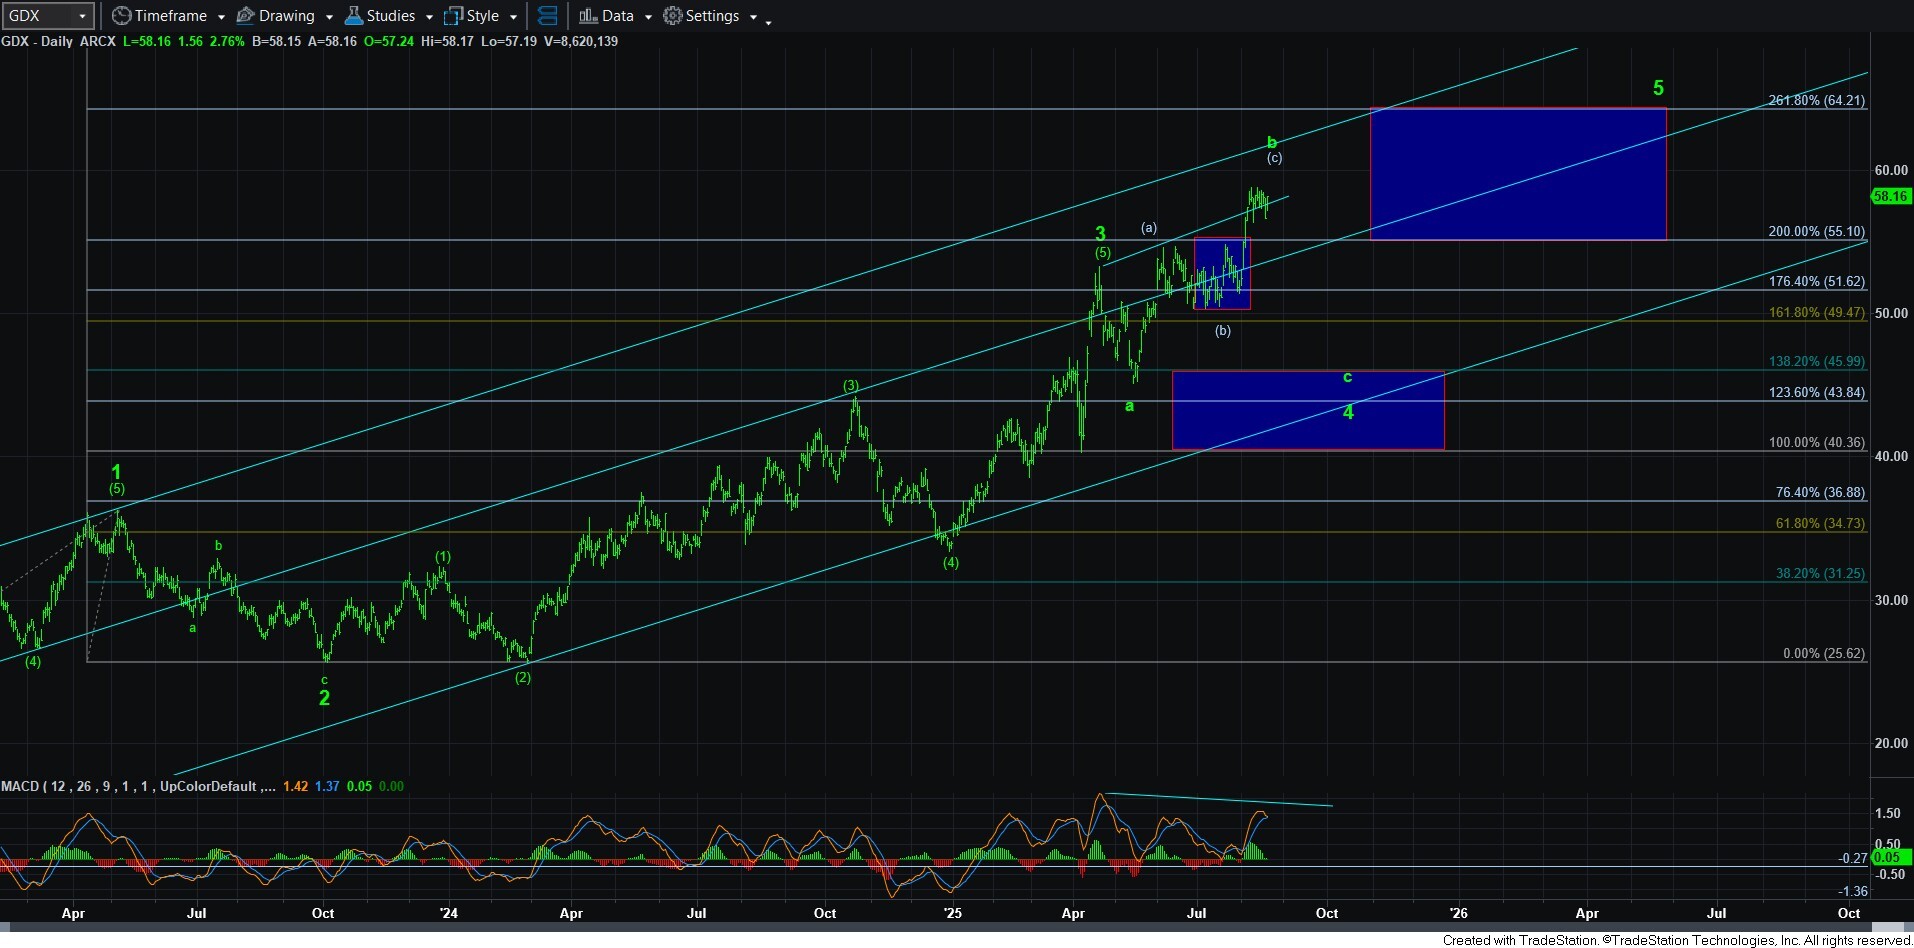
GDX still has not broken down below the 55 region, so it leaves the door open that this (c) wave is trying to push higher once again. While I am still not clear as to whether this extension is an expanded b-wave or a continuation to wave 3, I think that is somewhat academic as they both point towards the need for a 4th wave drop. And, that is how I am still seeing the bigger picture.
Overall, the market may be signaling a short term rally attempting to set up over the coming days. But, ultimately, I think we resolve much lower before this correction is done.