Wells Fargo: A Solid Sell Setup In Place
 By
Levi
By
Levi
- The stock has been significantly underperforming the S&P. A clear sell setup is now in place.
- Would you like to see just how strong your bank is? We have developed a testing methodology for bank strength.
- Only examining the earnings and financials of a bank is not enough.
- Follow along as we paint the likely scenario for the stock going forward.
by Levi at Elliott Wave Trader; produced with Avi Gilburt
Way back now almost 2 years ago, we began to warn of issues developing within the banking system. Specifically regarding (WFC), Avi wrote this article last December, “Is Your Bank Safe? A Look At Wells Fargo”. Since that article was published, during the time the (SPY) has gained more than +5%, (WFC) has declined nearly -14%. We anticipate that underperformance to continue. Here’s why.
First, the intro to that piece by Avi:
“Over the last few months, we have written several articles outlining our views of banks in general. We explained the relationship that you, as a depositor, have with your bank is in line with a debtor/creditor relationship. This places you in a precarious position should the bank encounter financial or liquidity issues. Moreover, we also outlined why reliance on the FDIC may not be wholly advisable. And, finally, we explained that the next time there's a financial meltdown, your deposits may be turned into equity to assist the bank in reorganizing.
So, at the end of the day, it behooves you, as a depositor, to seek out the strongest banks you can find, and to avoid banks which have questionable stability.”
The conclusion of the article comments as follows:
“In contrast to WFC, our 15 top U.S. banks do not have credit exposure to risky financial lenders and grant loans only to U.S.-based companies, have very low shares of unsecured retail loans, do not have any equities or derivatives on both their balance and their off-balance sheets, and also have very efficient business models with excellent cost-income ratios.
Moreover, WFC has more red flags, which we did not discuss in detail due to the limitations of the article, such as its various litigation issues, the bank's off-balance sheet items, and a potential increase in RWA (risk-weighted assets) in a volatile environment. However, all our Top-15 banks have been tested for these red flags to ensure their long-term stability.”
(This article, as well as Saferbankingresearch.com, was a combination of efforts between Avi Gilburt and Renaissance Research, which has been covering U.S., European, LatAm, and CEEMEA banking stocks for more than 15 years.)
Please review that article for a more in-depth look at the fundamentals of (WFC) as a company and a bank. This will make the following analysis more poignant as you will see how sentiment is currently pointing down. But, to where and for how long? Let’s dive in deeper with Zac Mannes and Garrett Patten.
The Technical Picture Paints A Sell
Let’s look at the two most probable scenarios.
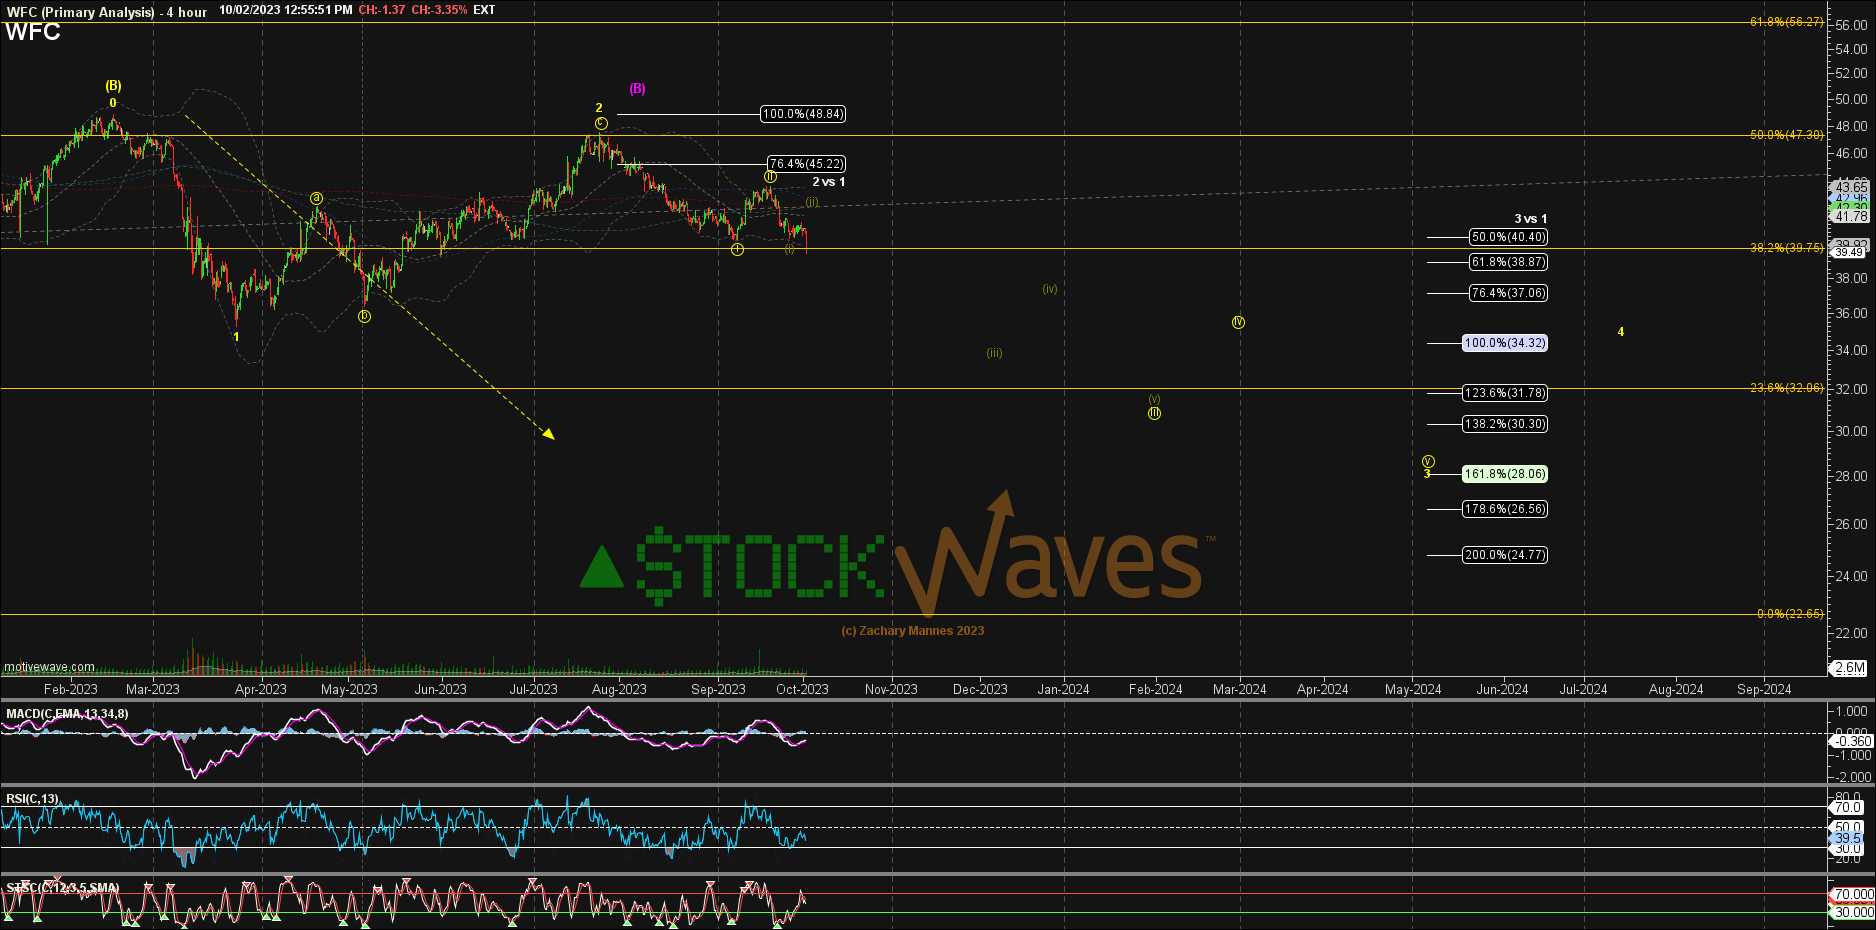
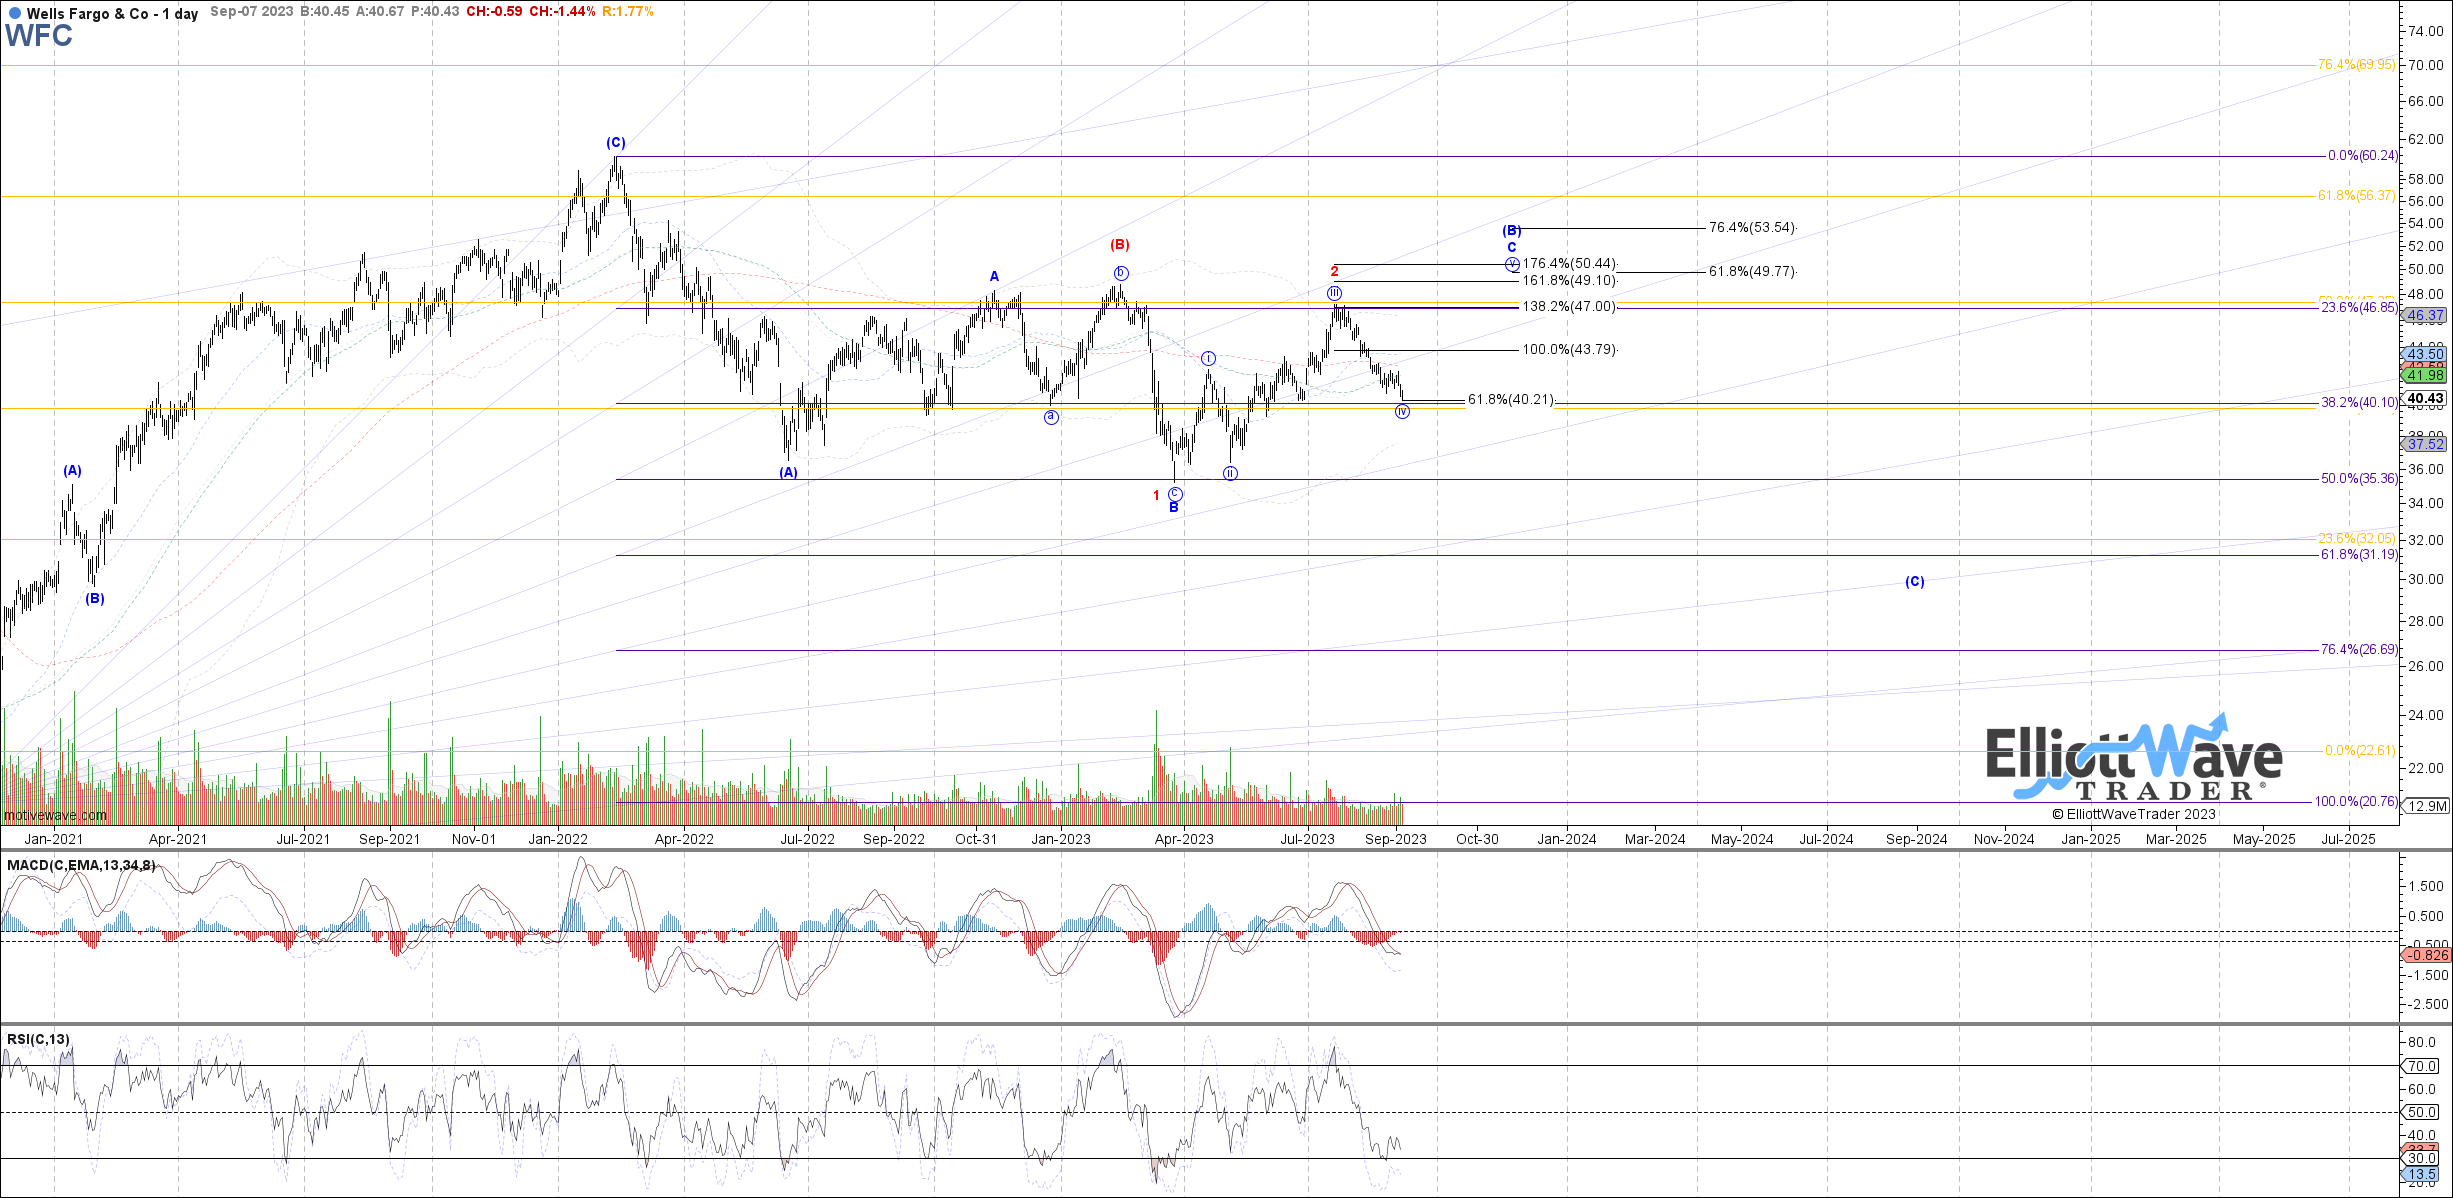
Note that both of our lead analysts have charts that point to lower levels to come. Zac’s chart shows an immediate sell setup. Garrett’s leaves the possibility open that the larger [B] wave bounce has not yet completed. Zac’s alternate purple [B] also allows for this path.
If price begins to decline below $38 then we are likely in the immediate downward scenario that Zac has as his primary. Should price reclaim $43 then the larger [B] wave bounce becomes more likely and could target as high as $50 - $51.
In fact, we have (WFC) and (MS) both rated as ‘sells’ in our Wave Setups feature for members. In this section of StockWaves we discuss specific setups for both buy and sell. Levels are given as targets, support, resistance and invalidation of the setup. Just in the month of September more than 40 setups have been provided in this service.
Remember that we view the markets from a probabilistic viewpoint. They are non-linear, fluid and dynamic in nature, just like human behavior. So we show the path we see as most likely and also provide an alternative scenario.
Avi Gilburt has frequently described this like a general that prepares a primary plan for battle and then a secondary contingency plan. Doing so keeps us from being caught offside or unprepared.
Risk: Should price break strongly above the $51 area then we would reassess this sell setup.
We are not completely bearish the entire banking sector. While (JPM) has some issues, it would appear that it is in a slightly better position when compared to (WFC).
Note the latest updated chart from Garrett here:
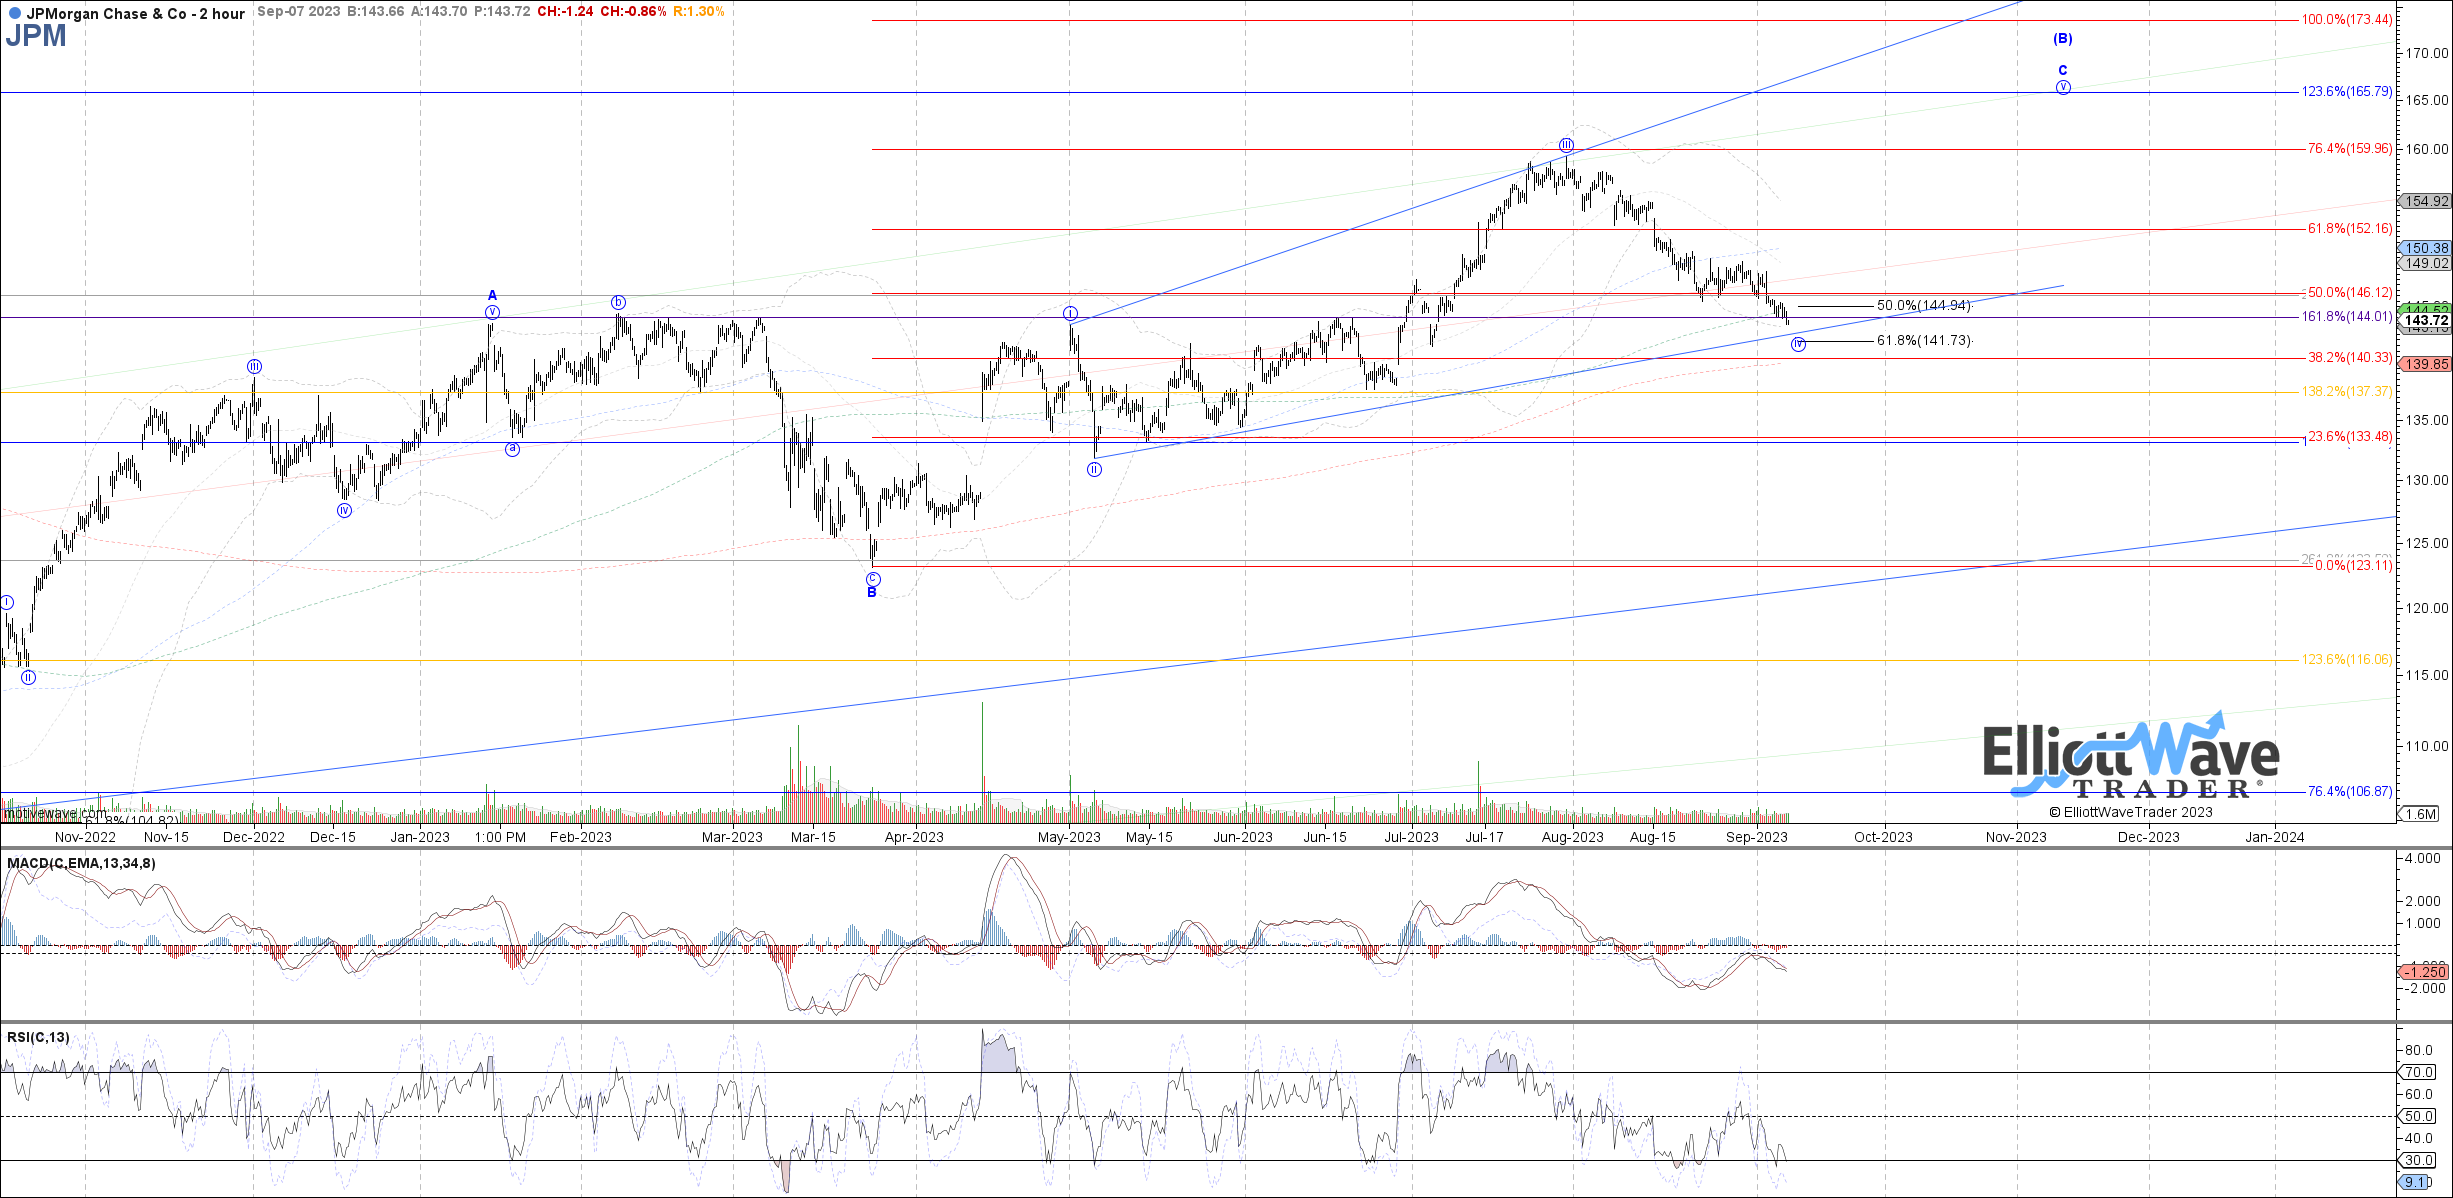
For as long as price remains above the $133 level, the (JPM) chart is pointing to as high as $165 next.
This is the type of specific analysis in literally dozens and dozens of individual stocks that we provide and then constantly update for our members.
Continuing Education
We have an extensive Education library available at Elliott Wave Trader. As well, we want to teach others this methodology. Three times a week we have beginner and intermediate-level videos where we show the exact way we count the waves and give in-depth analysis techniques. This methodology, if you give it the chance, will change the way you invest forever. More on that can be found here.
There are many ways to analyze and track stocks and the market they form. Some are more consistent than others. For us, this method has proved the most reliable and keeps us on the right side of the trade much more often than not. Nothing is perfect in this world, but for those looking to open their eyes to a new universe of trading and investing, why not consider studying this further? It may just be one of the most illuminating projects you undertake.
