Weekly Altcoin and Crypto Equity Report, August 3rd, 2022
 By
Ryan Wilday
By
Ryan Wilday
Here are the weekly altcoin and crypto equity charts I am watching most closely.
General: By and large we have seen constructively bullish action over the last week.
Coin Charts I'm Trading
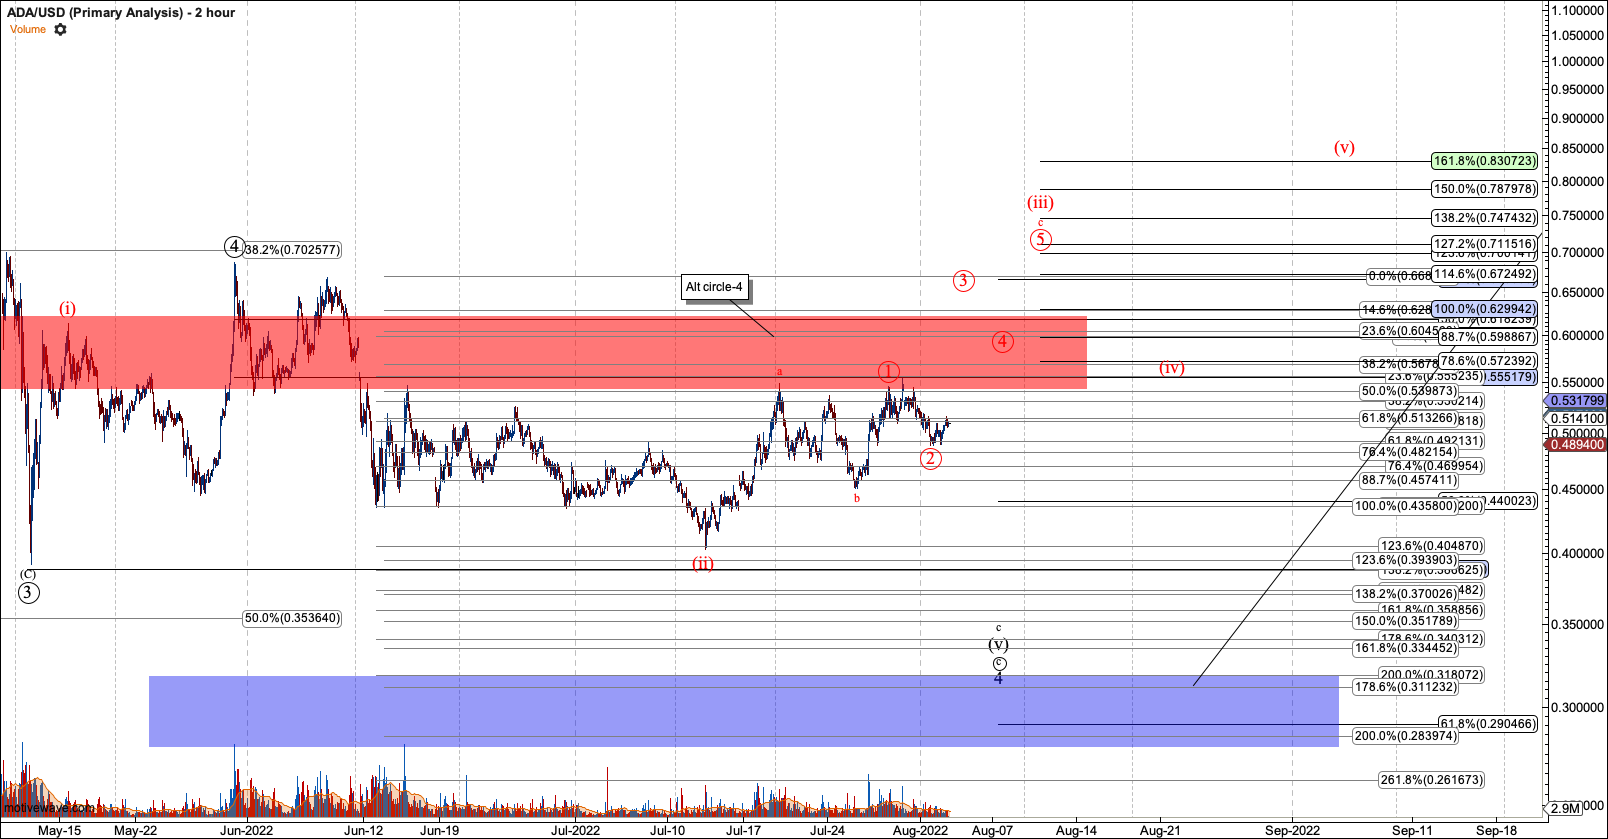
1. ADA looks like it wants to hold the red 1-2. However, until I have five waves to 80 cents, I won’t be ready to say the bottom is in.
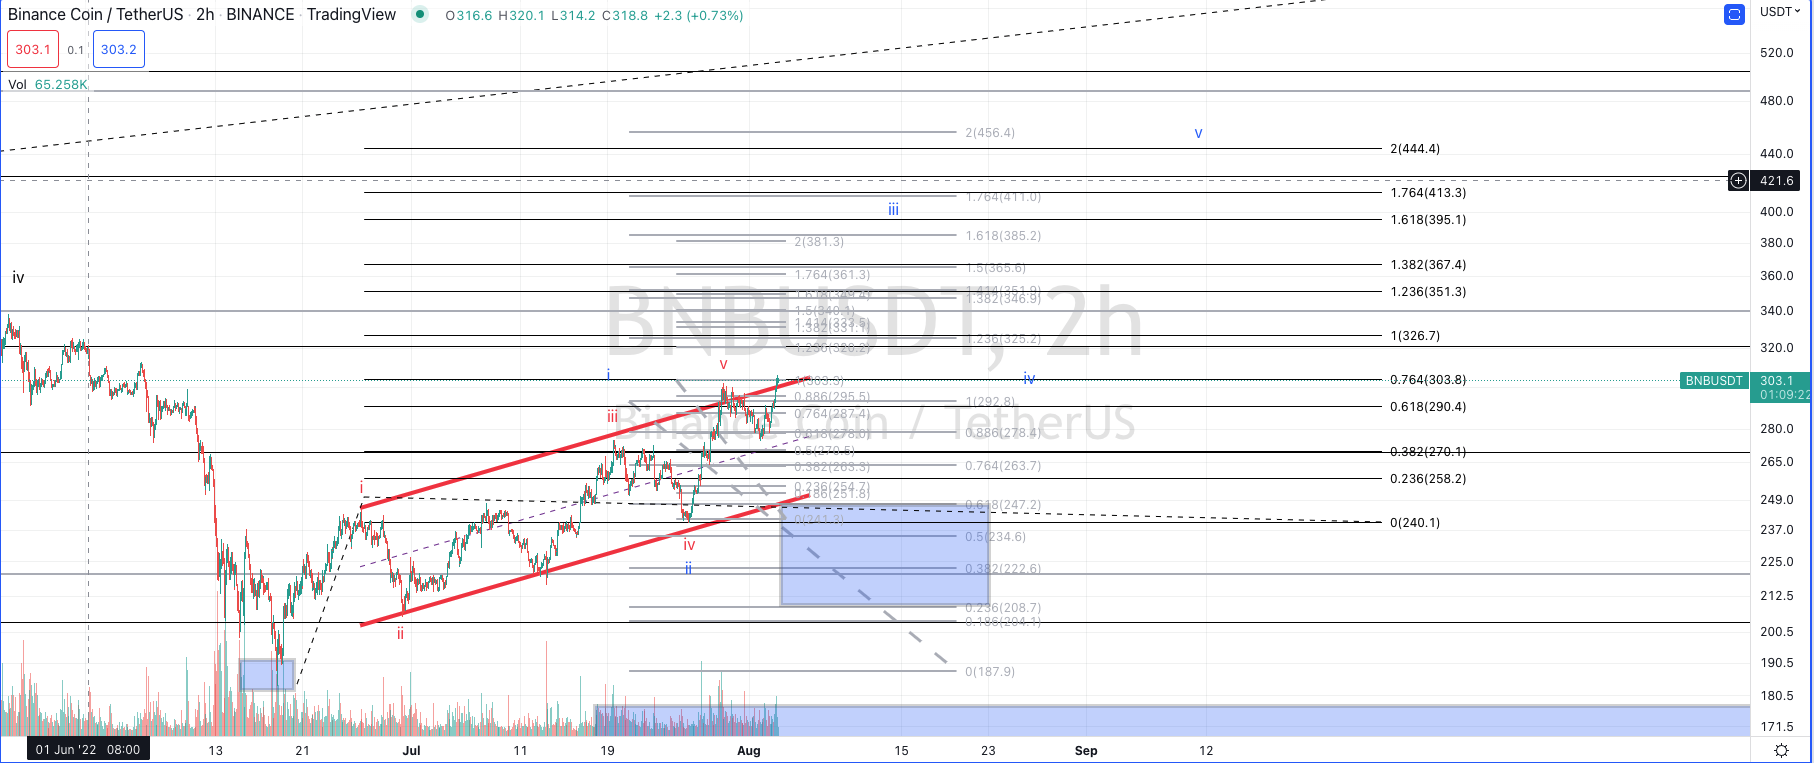
2. BNB may be finishing up V in red. However, this week I added the blue count based on a wave two that is a running flat. This count projects a third wave target at $395. Breaking over $330 should indicate follow-through in this count.
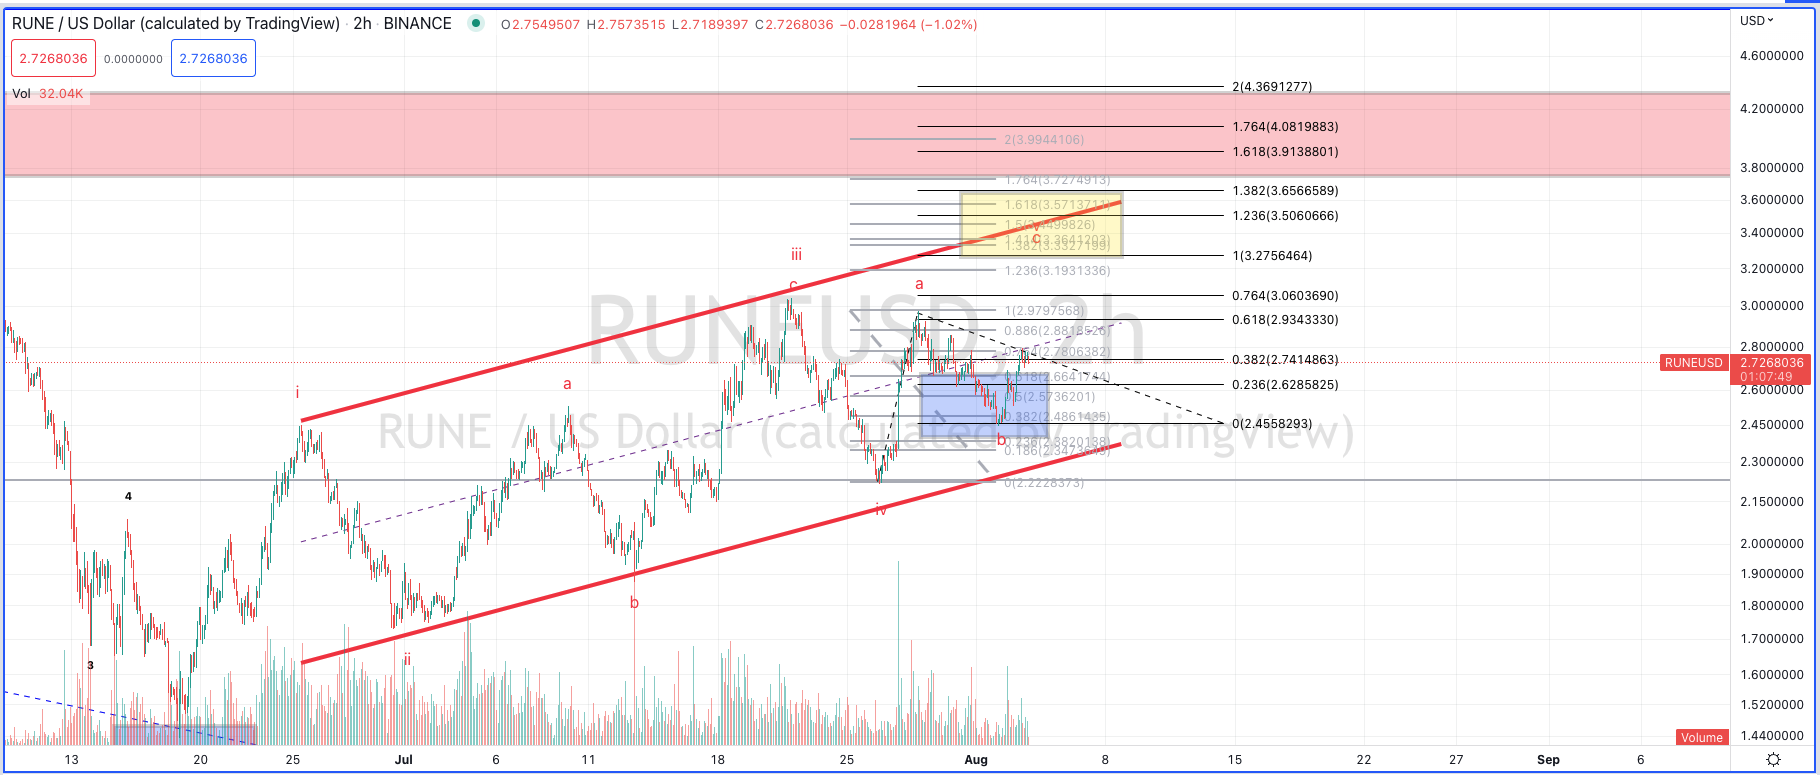
3. RUNE should be on its way to $3.25+ in V. Note after V, it can retrace to as deep at $1.70 in the next degree before its break higher.
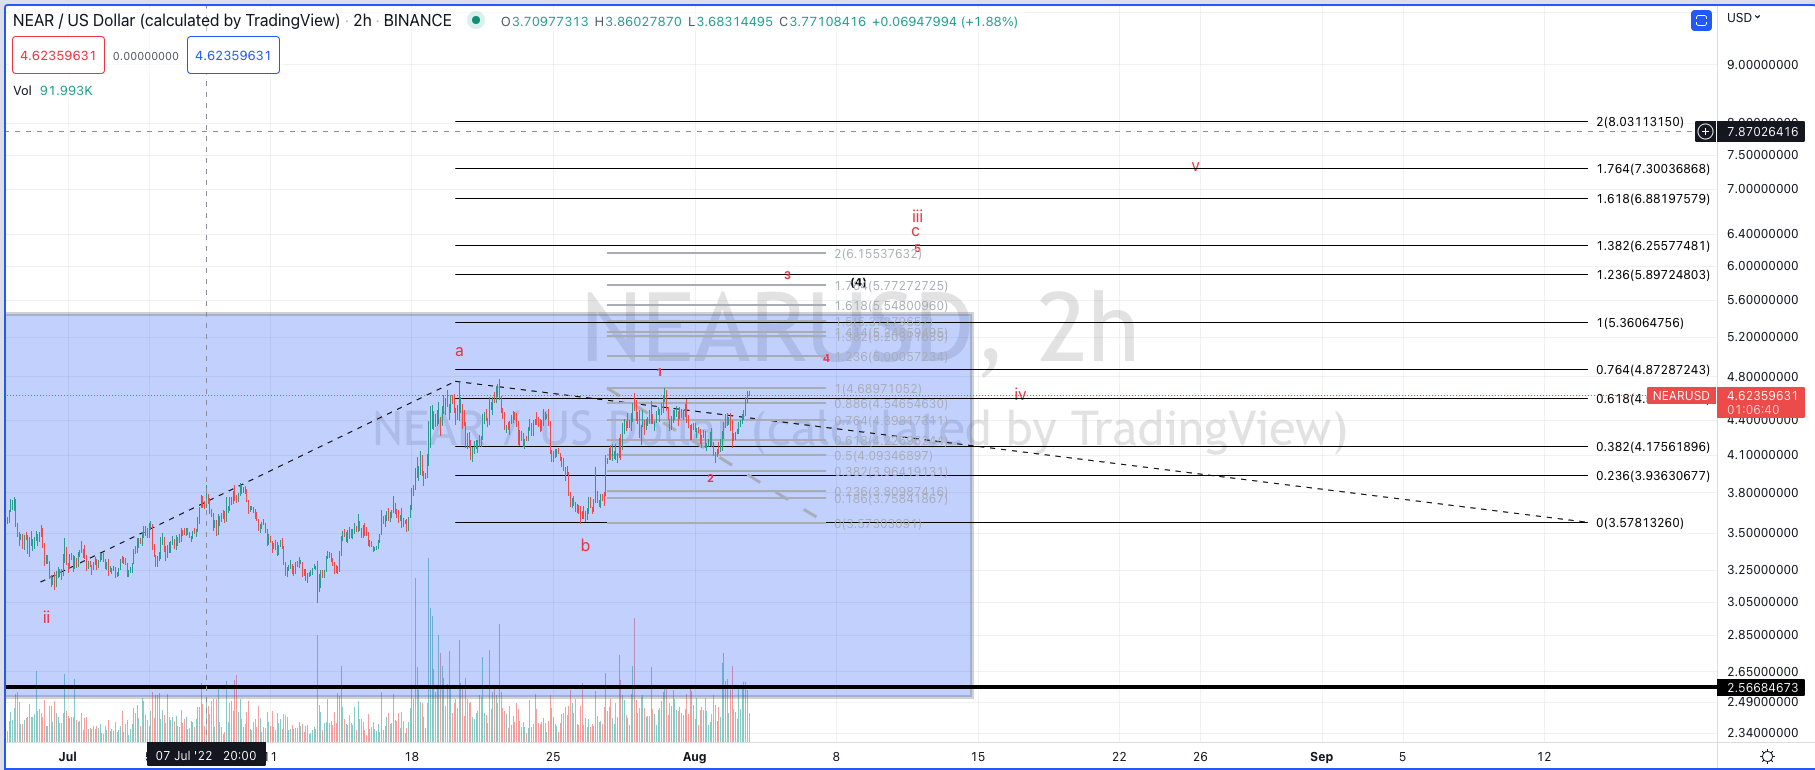
4. NEAR- As long as over $3.80, NEAR looks like it can make a run in the red count. Note that I need all five waves filled in to suggest this chart has bottomed.
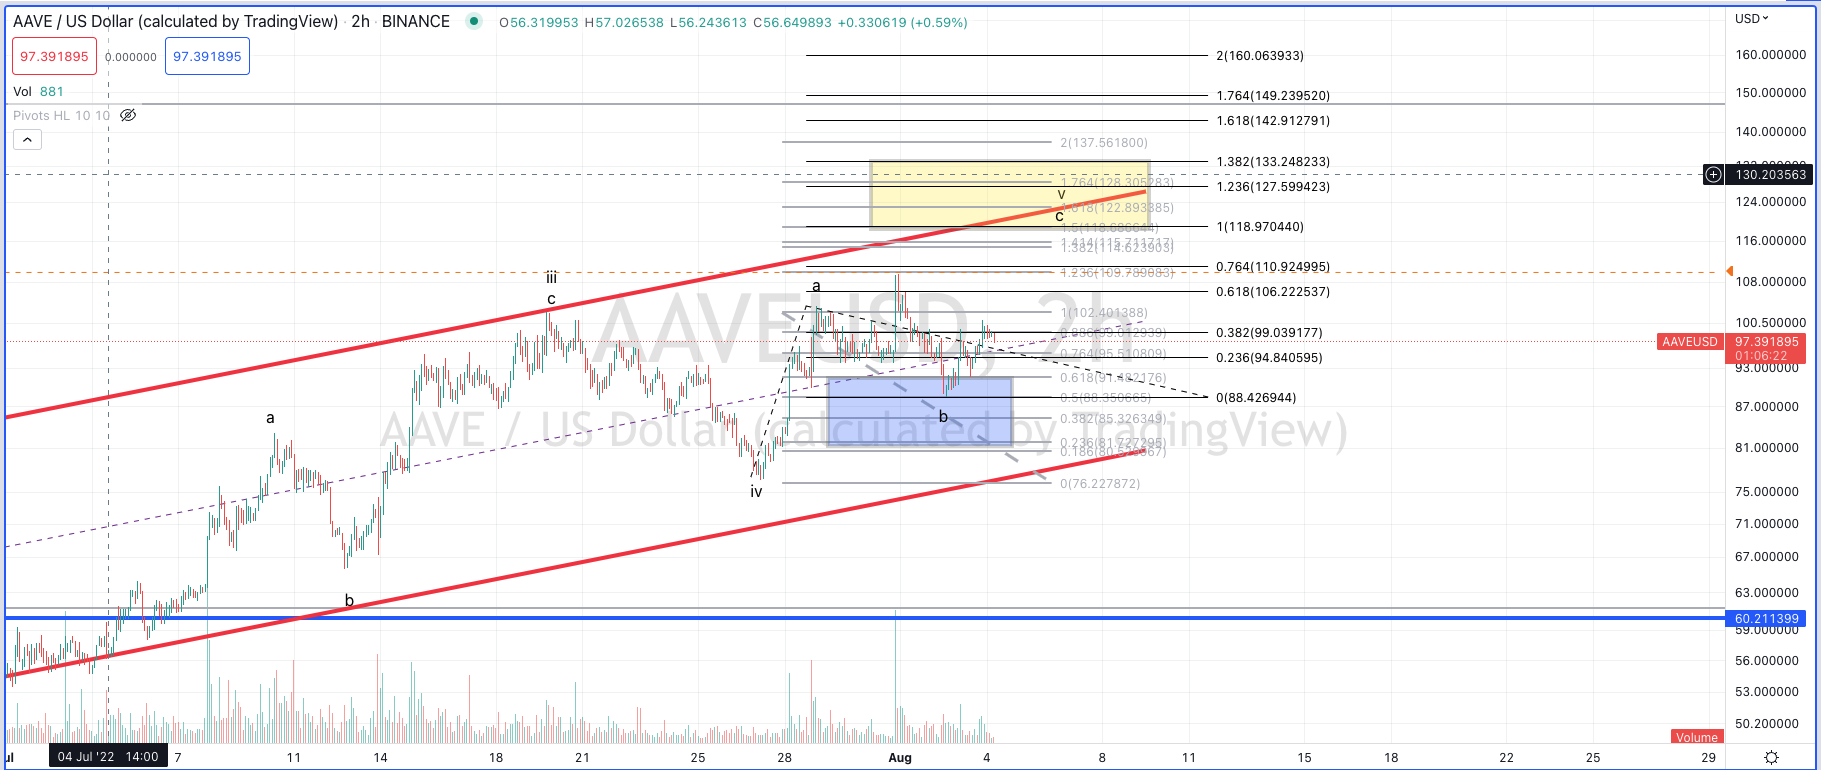
5. AAVE may have bottomed in iv and b of V, so should be headed to between $110 and $130.
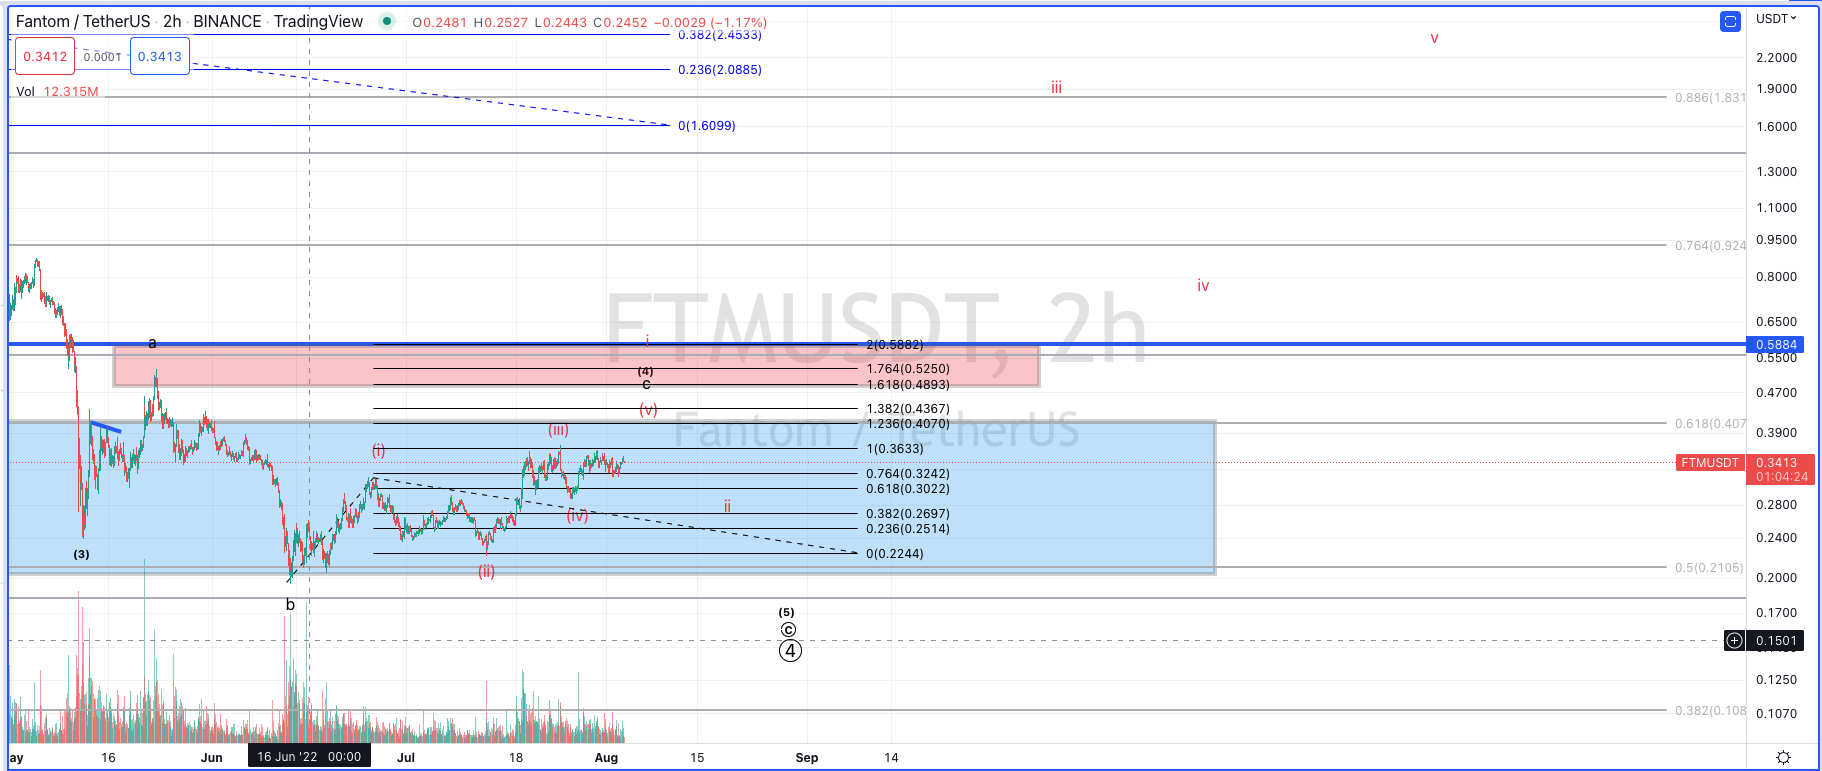
6. FTM looks like it will fill all five waves in red. Although, this is a very anemic diagonal, that likely reaches the 1.382 extensions at best, instead of the ideal 1.618. And, this diagonal can still be C of 4 in the black count. So it will need to stay off the June low once all five waves complete to setup a break higher and a daily chart trend change.
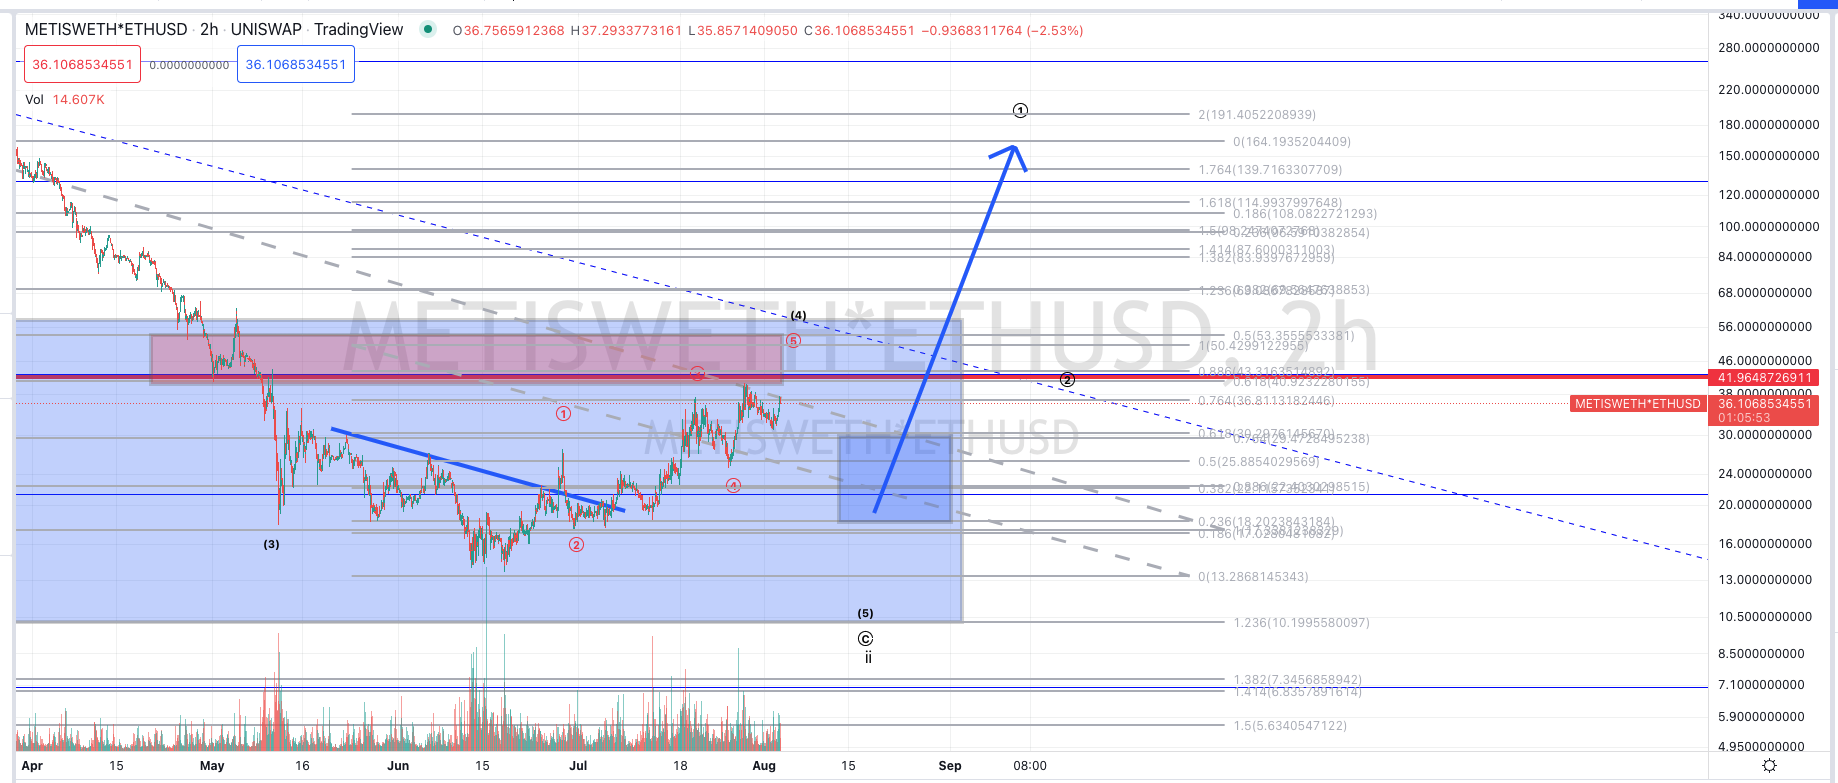
7. METIS- It looks like METIS will fill in five waves. For this to not be C of 4, I estimate it will need to hold $18.20 to follow the blue arrow to black circle 1. I'll tighten that level up as we see a clear top in red (V).
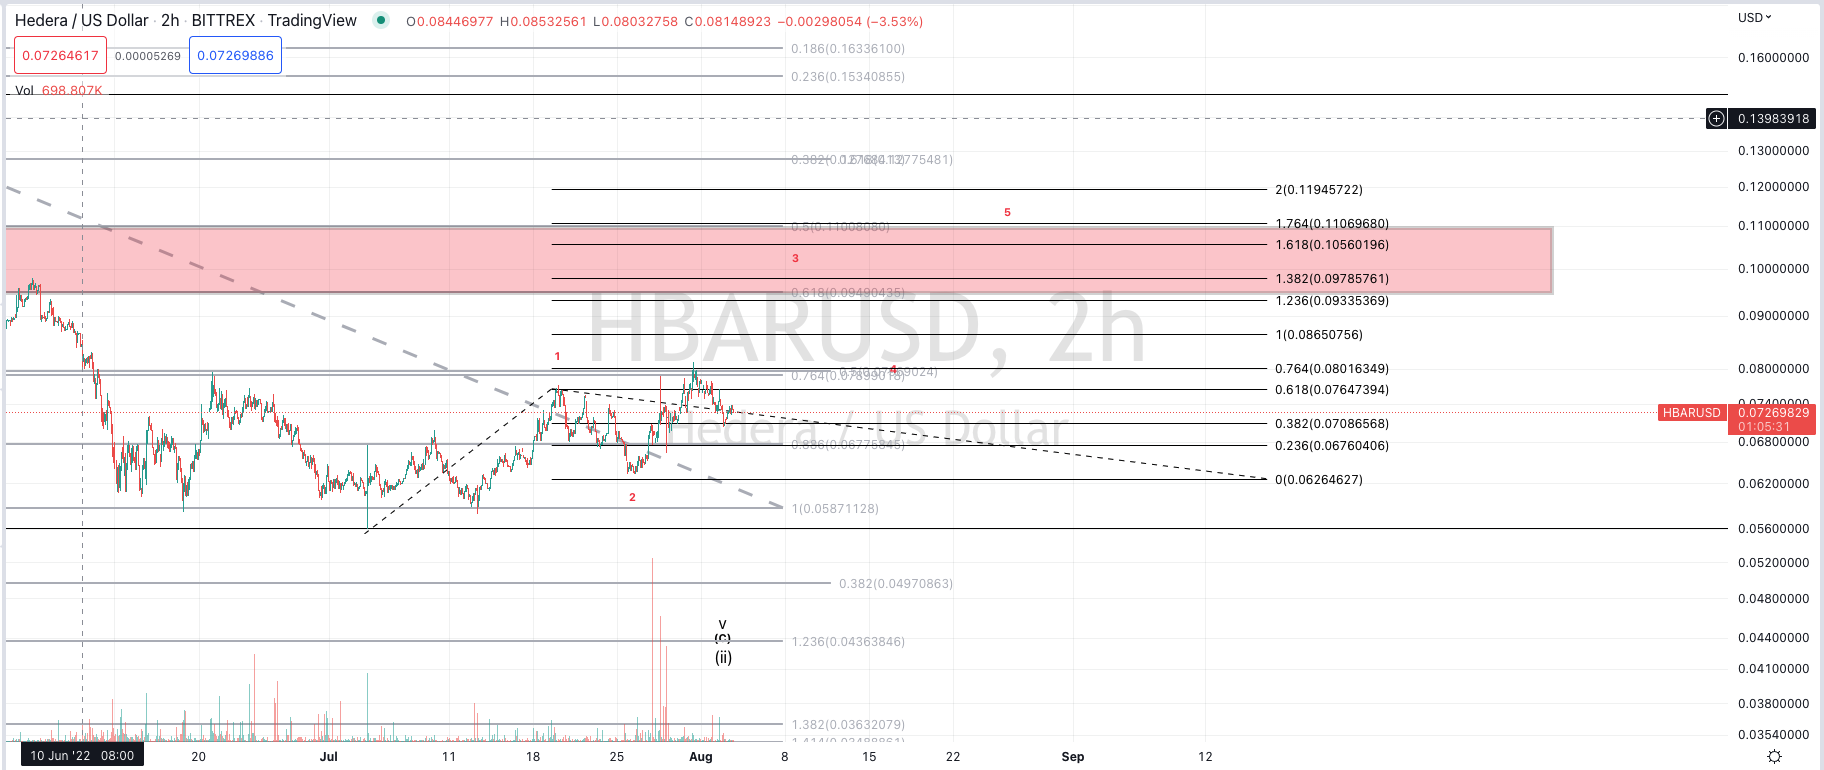
8. HBAR needs to fill out the red count for the first indication a bottom is in. Otherwise, it can sink to 4 cents before putting in the black count.
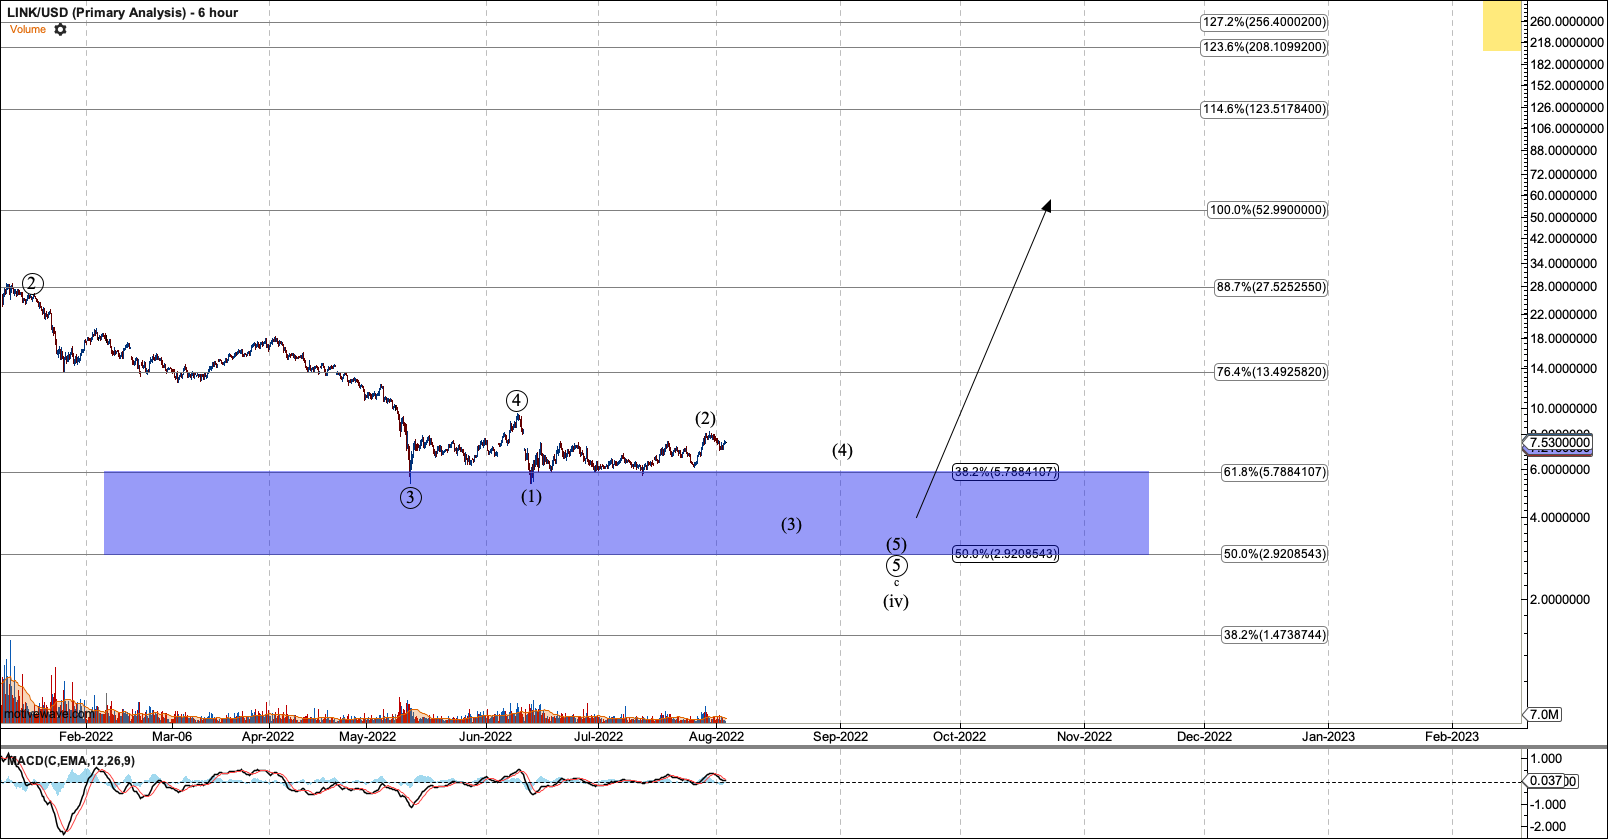
9. LINK put in a higher (2). I still see no clear short-term bullish path.
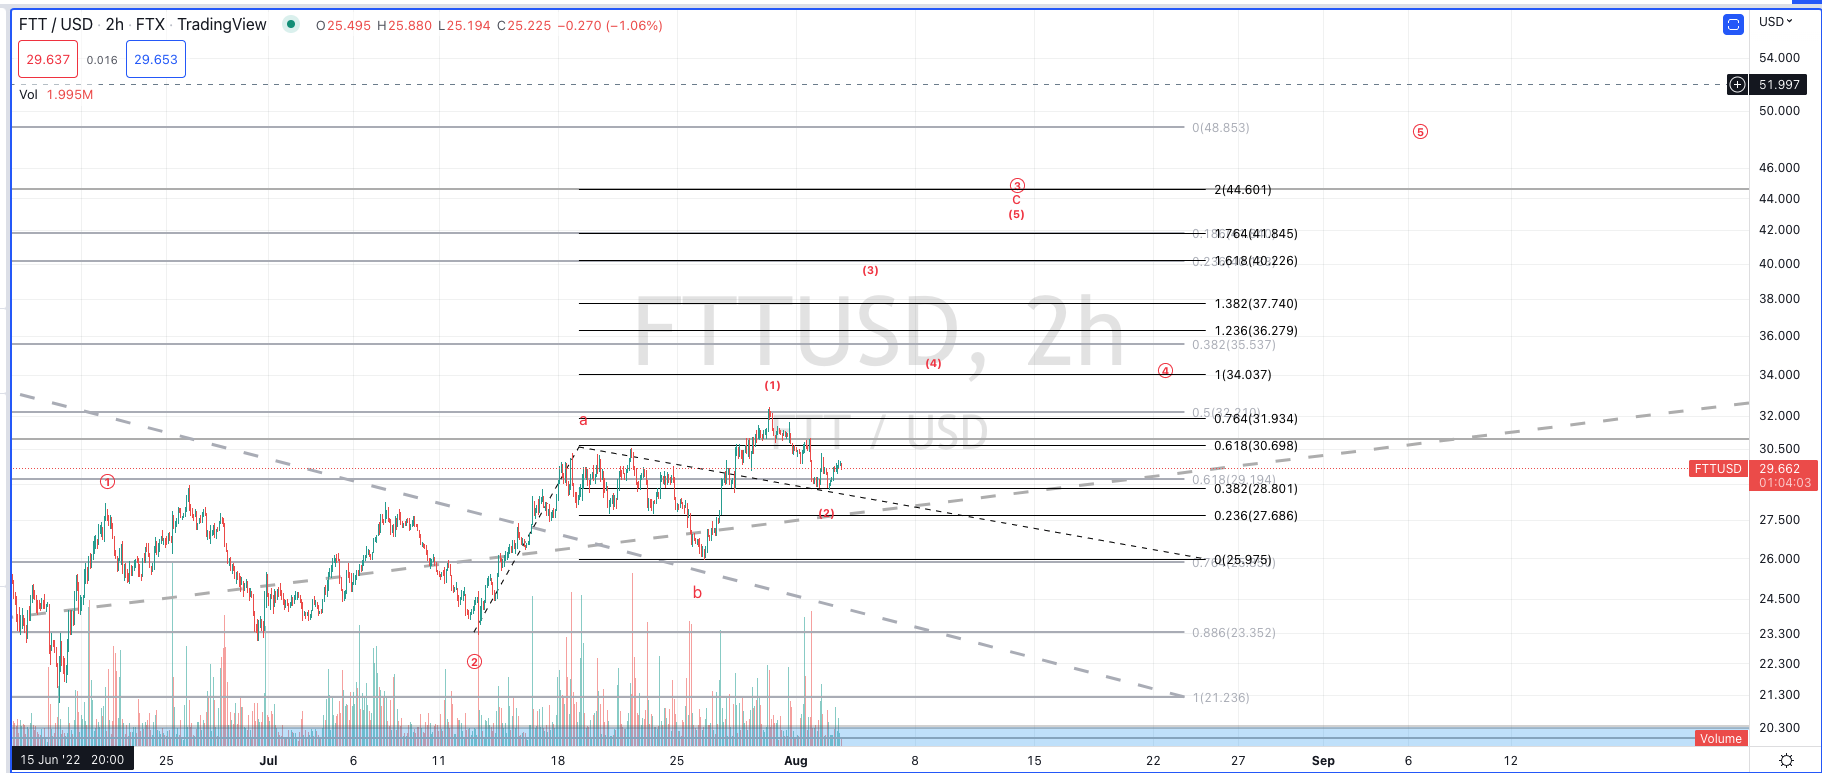
10. FTT- I was looking at fibs today, and I see that we can see a stronger push than I expected in this third. Based on the micro 1-2, I like $41 for the third.
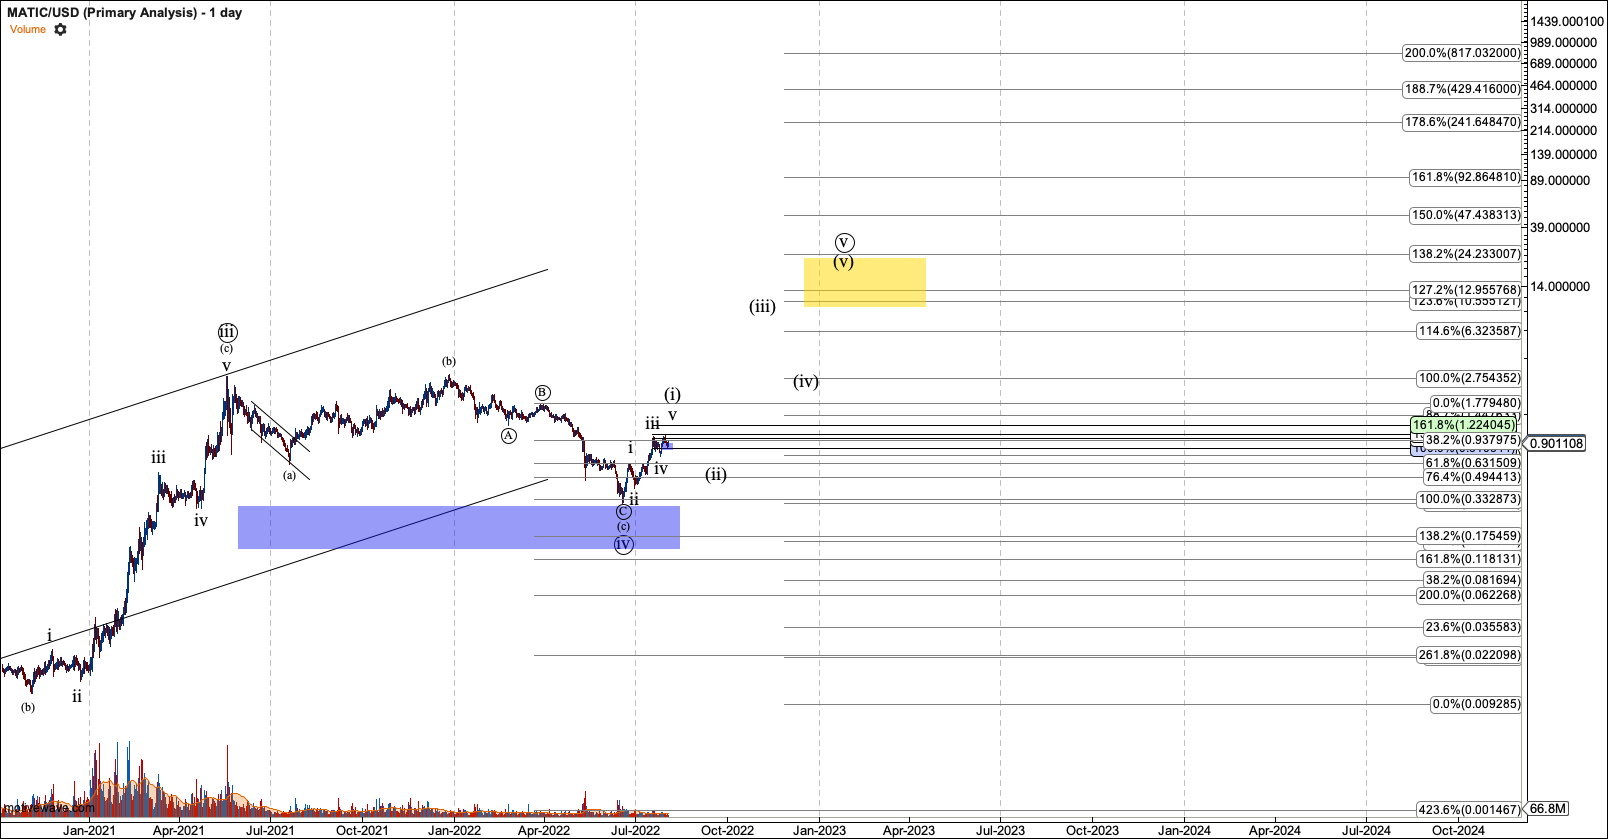
11. MATIC looks well set up to complete V of (i), so I wanted to use this chart to zoom out and comment on the next degree. Today in the main room I posted:
One important question is going to show in many charts in the coming month, If we have found a bottom of our year-long correction. We are still not sure that we have, because we don't have five waves off the low in any chart. And no chart has seen the 'wave 2 challenge' that is upcoming. But let's say we do because it looks that way more and more each day. Some charts are close to completing the fifth wave off the low.
The question, then, is whether the first five waves area going to be the first of the first of the next bullish leg, or just the first of the entire move. I know that is a mouthful. I'll put it another way. After the first five waves that any chart is working on now, do we need another larger five wave to point us to the charts weekly target?
Well, in MATIC, proportionally, and by just eyeballing, it appears that these first five waves will give us a wave (II) that can drop to as low as 40 cents (estimated), then setup the big run. This may also mean MATIC may be first to top. But that depends on it also hurrying through the third while some charts are working on a larger wave 1.
Coin Charts I'm Stalking
NA
Equity Charts I'm Trading
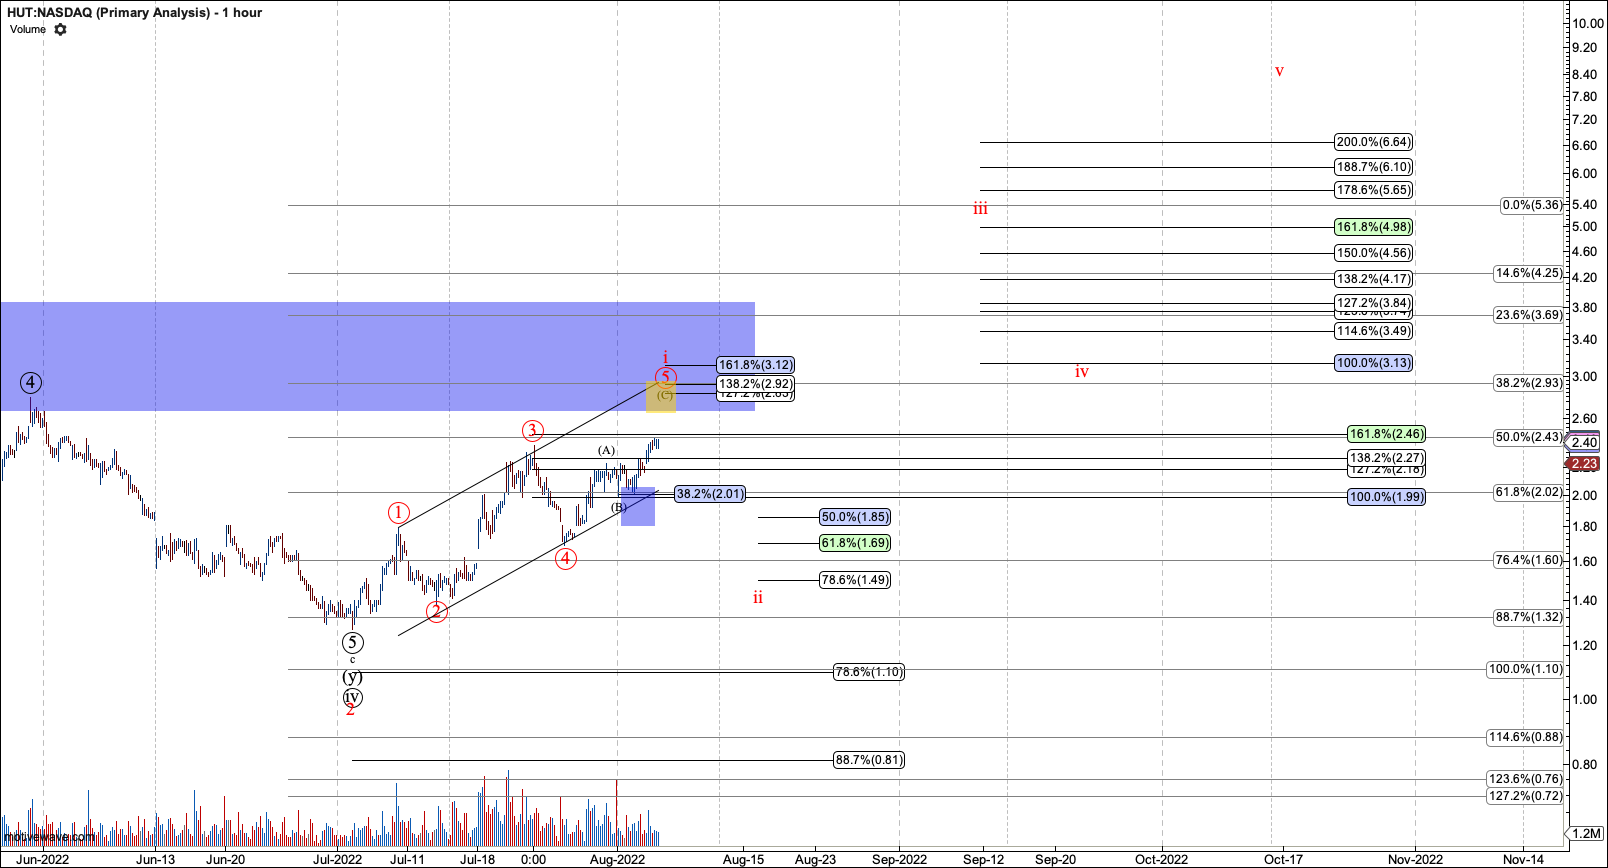
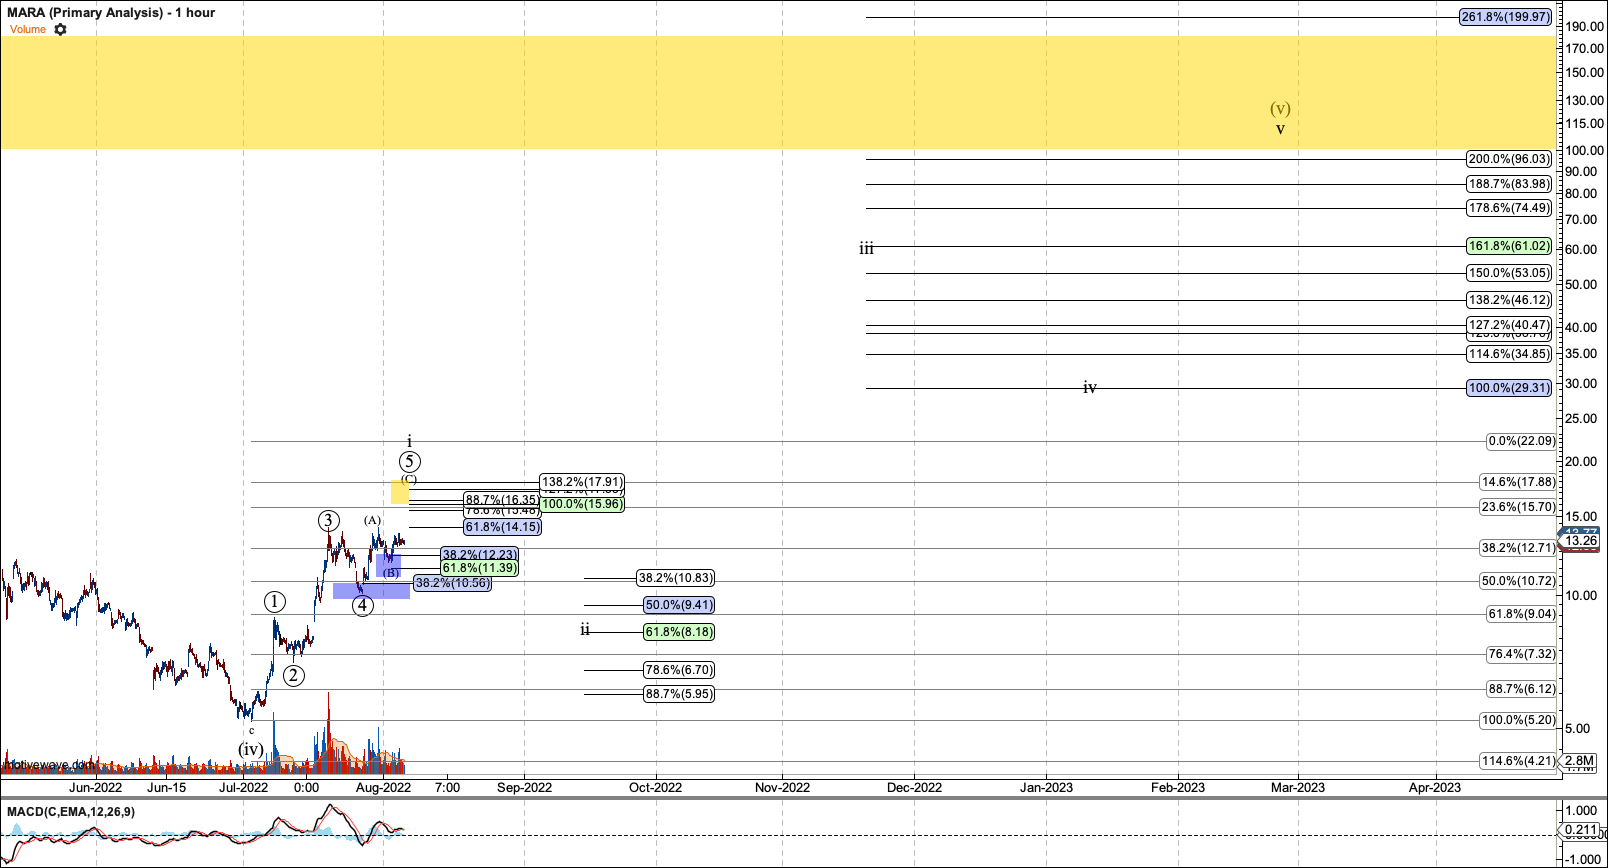
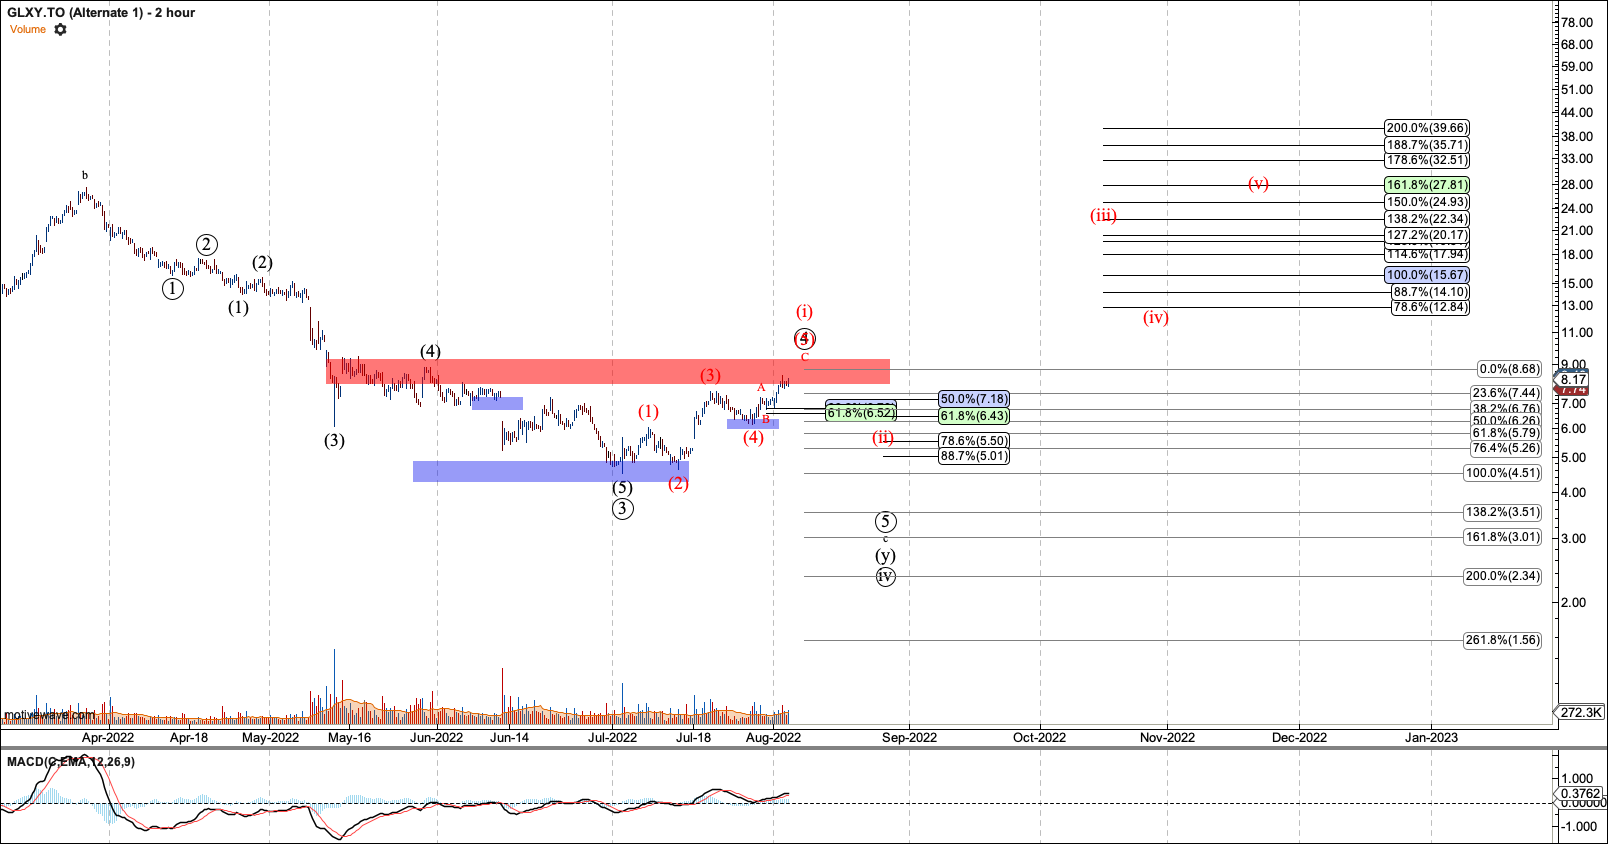
Warning: HUT, HIVE, MARA, and Galaxy are not reliable charts since they broke below the 50% retrace of wave three. However, I am keeping them on this report to help those that limit themselves to brokerage accounts. I have small positions but will not add until we have a trend reversal.
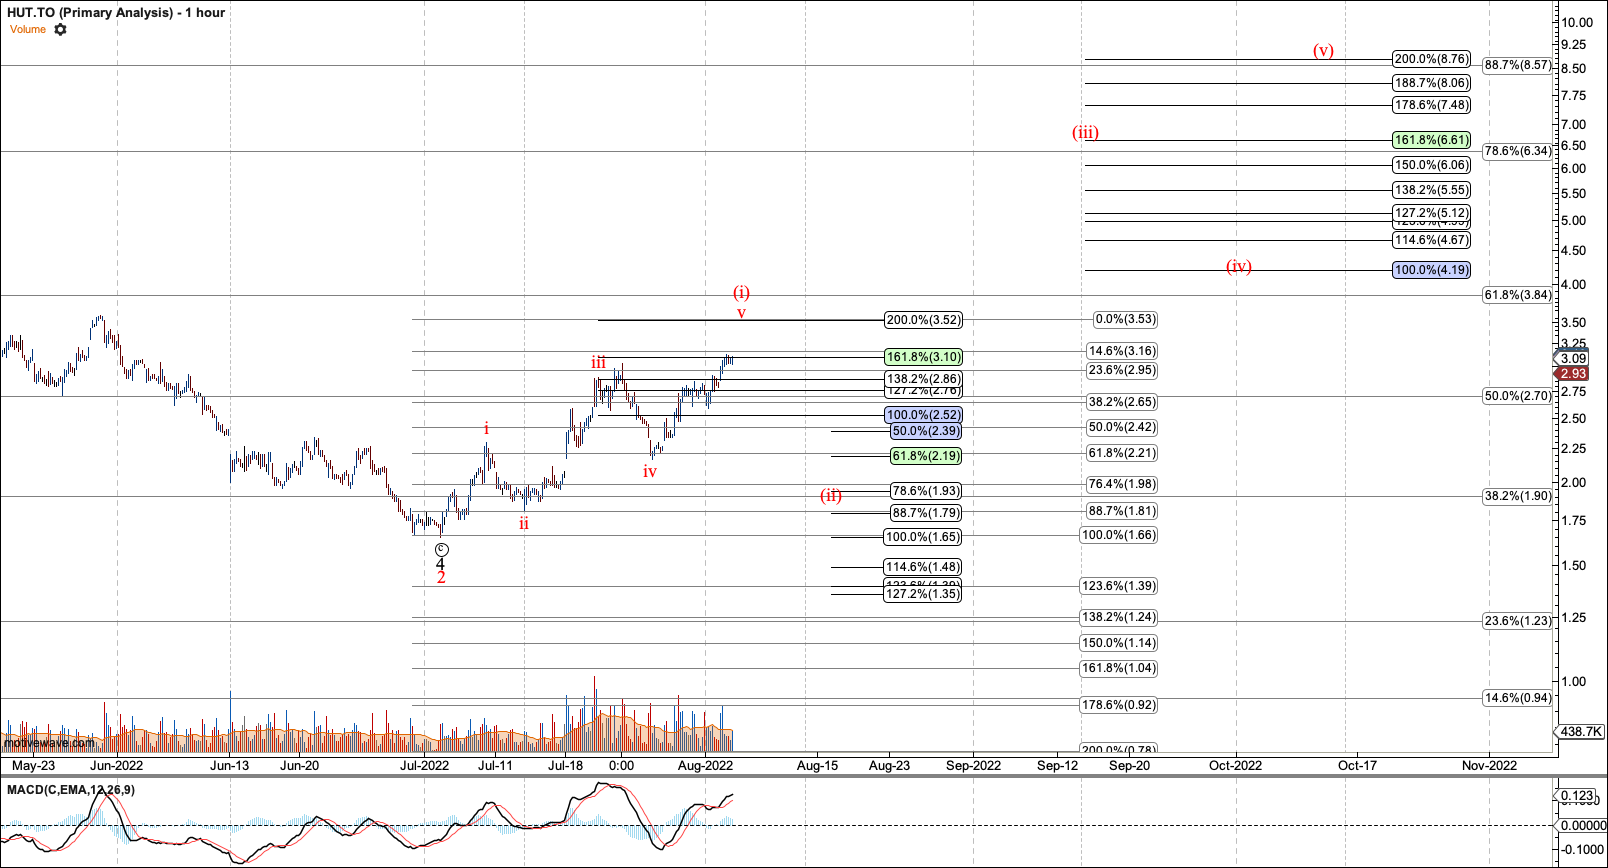
1. HUT is forming its fifth of wave-1. I'm jumping ahead to estimate that HUT needs to hold $1.50 USD / $1.93 CAD in the next degree ii.
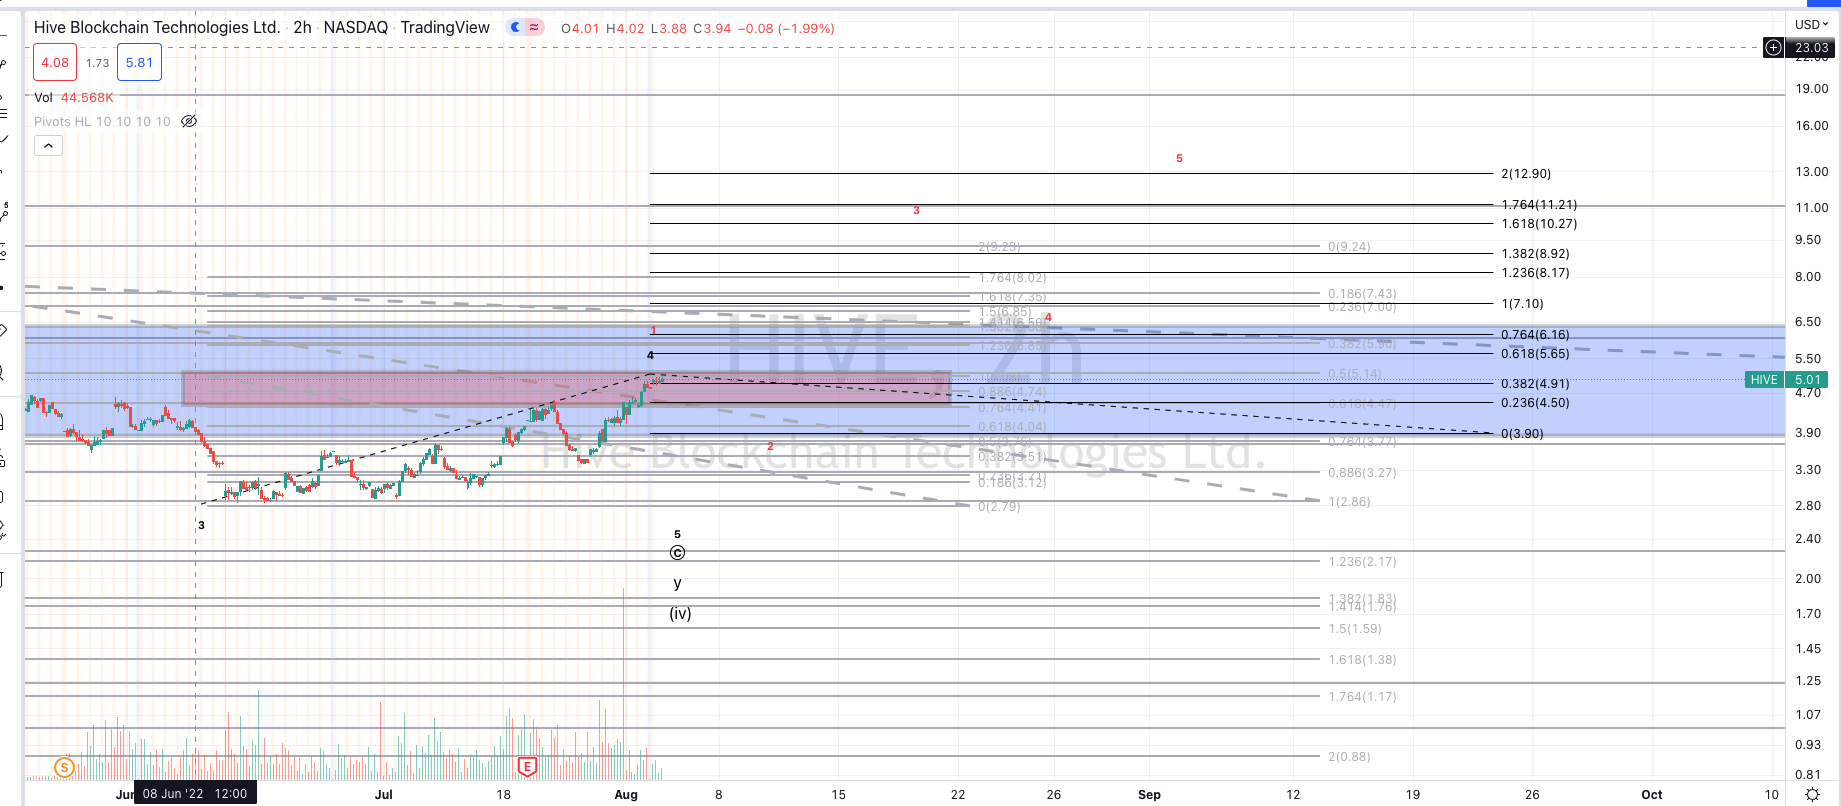
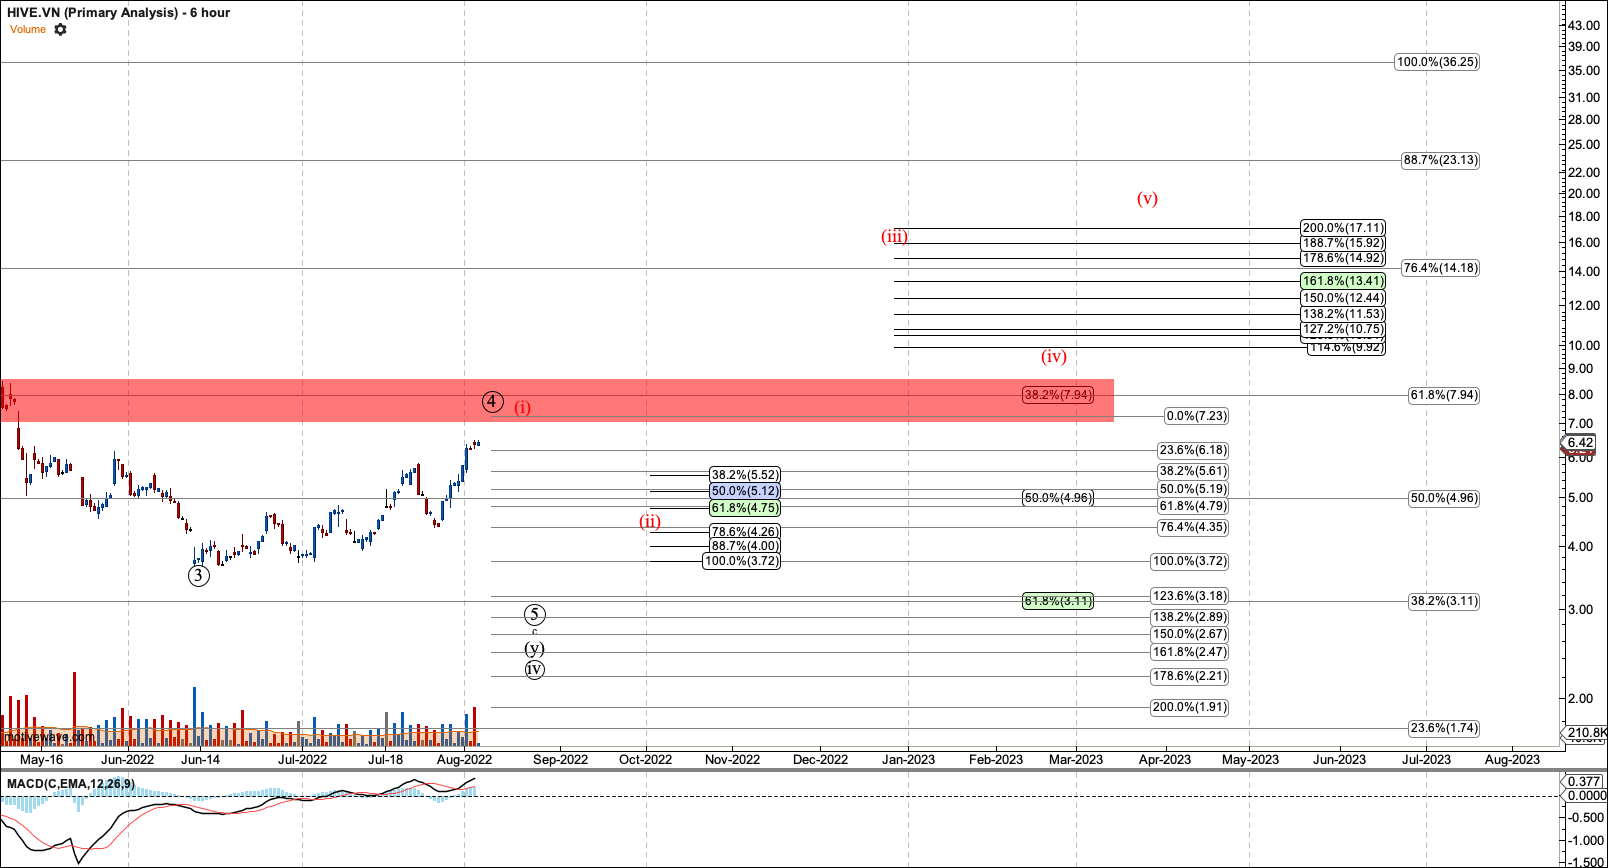
2. HIVE needs to break over $5.11 USD / $7.28 to indicate the lows are likely in. If it breaks over the point labeled wave 4. I am willing to believe it may have formed an expanded diagonal if any pullback holds $3.20 USD / $4.79 CAD then breaks higher.
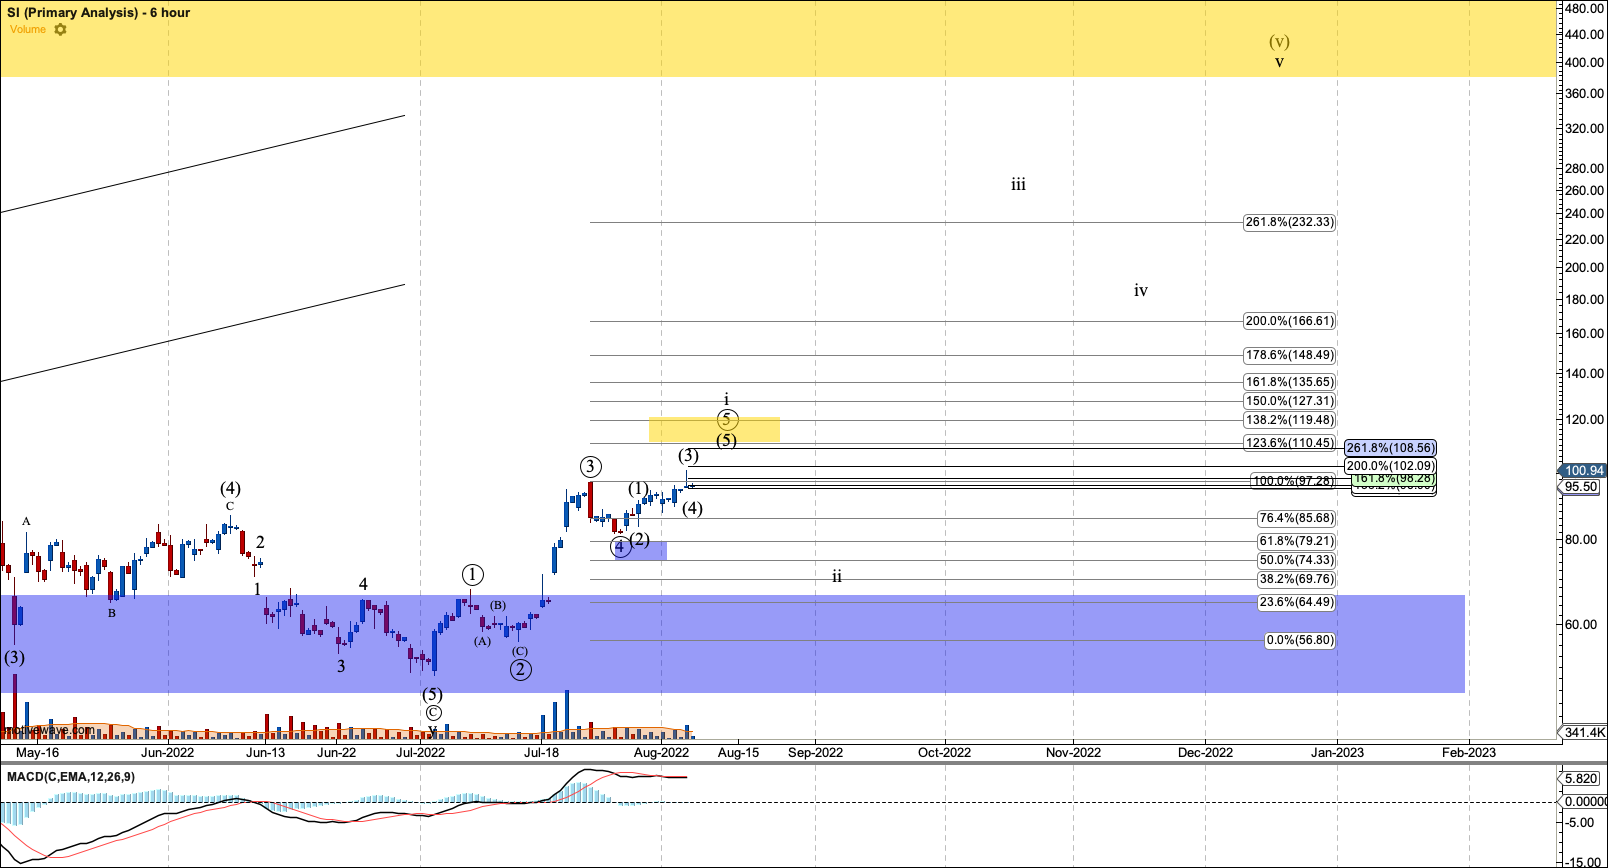
3. SI is still working on circle-4 of 1 and should reach $110. After the fifth note that wave ii can pull back to $70, estimated.
4. MARA is setup for C of circle-5 which should at least reach $16. This is jumping ahead but as long as (II) holds $6, it seems MARA can get very close to my original target at $100.
5. GLXY is working on five waves in red and is close to completion. The question is going to be whether this ends up being C of a larger 4th, or the first wave in a breakout. I estimate that it needs to hold $5 CAD / $4 USD and break over $9 to indicate a long-term bottom is in. I’ll tighten that up as we have a confirmed top in red.
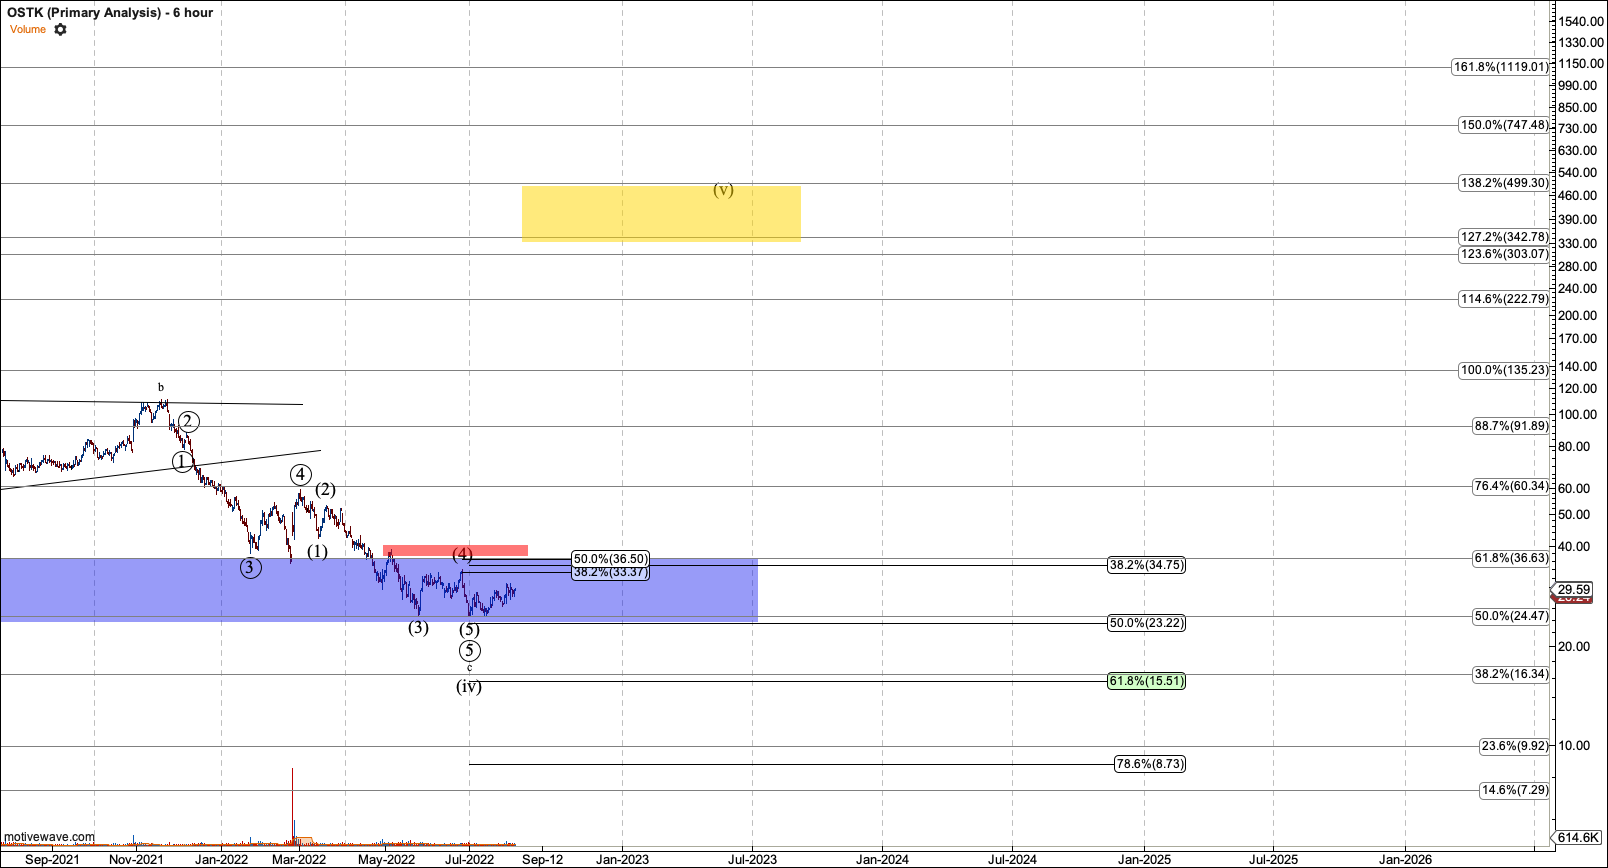
6. OSTK- For this chart to turn bullish it needs to hold its recent low but I have no sign a bottom is in.
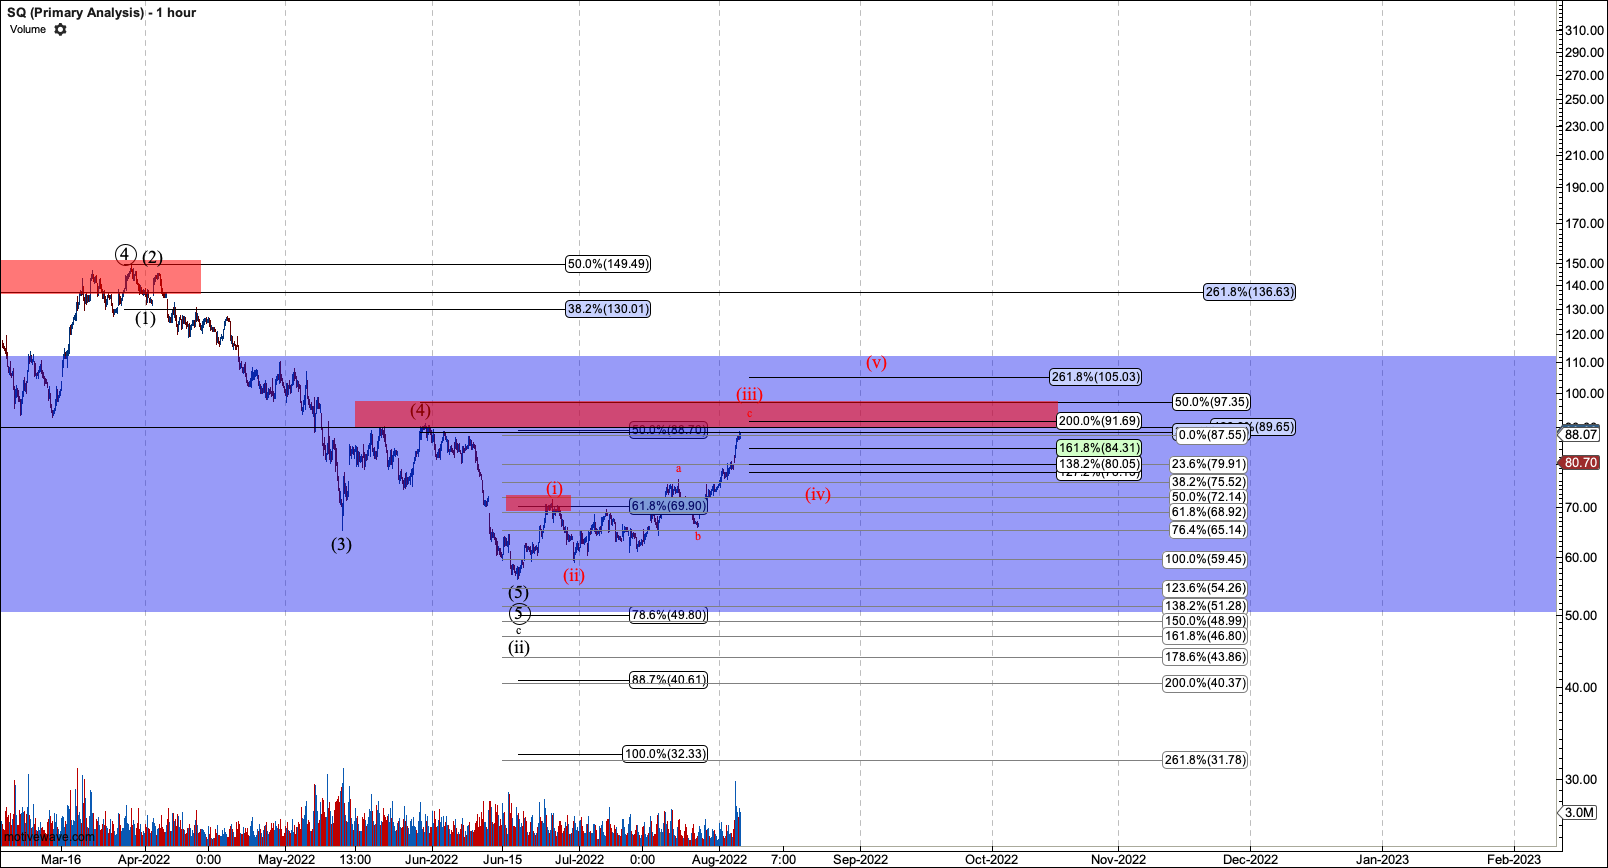
7. SQ is still stretching in the red third. If it can form a fourth and fifth after, the third it likely bottomed.
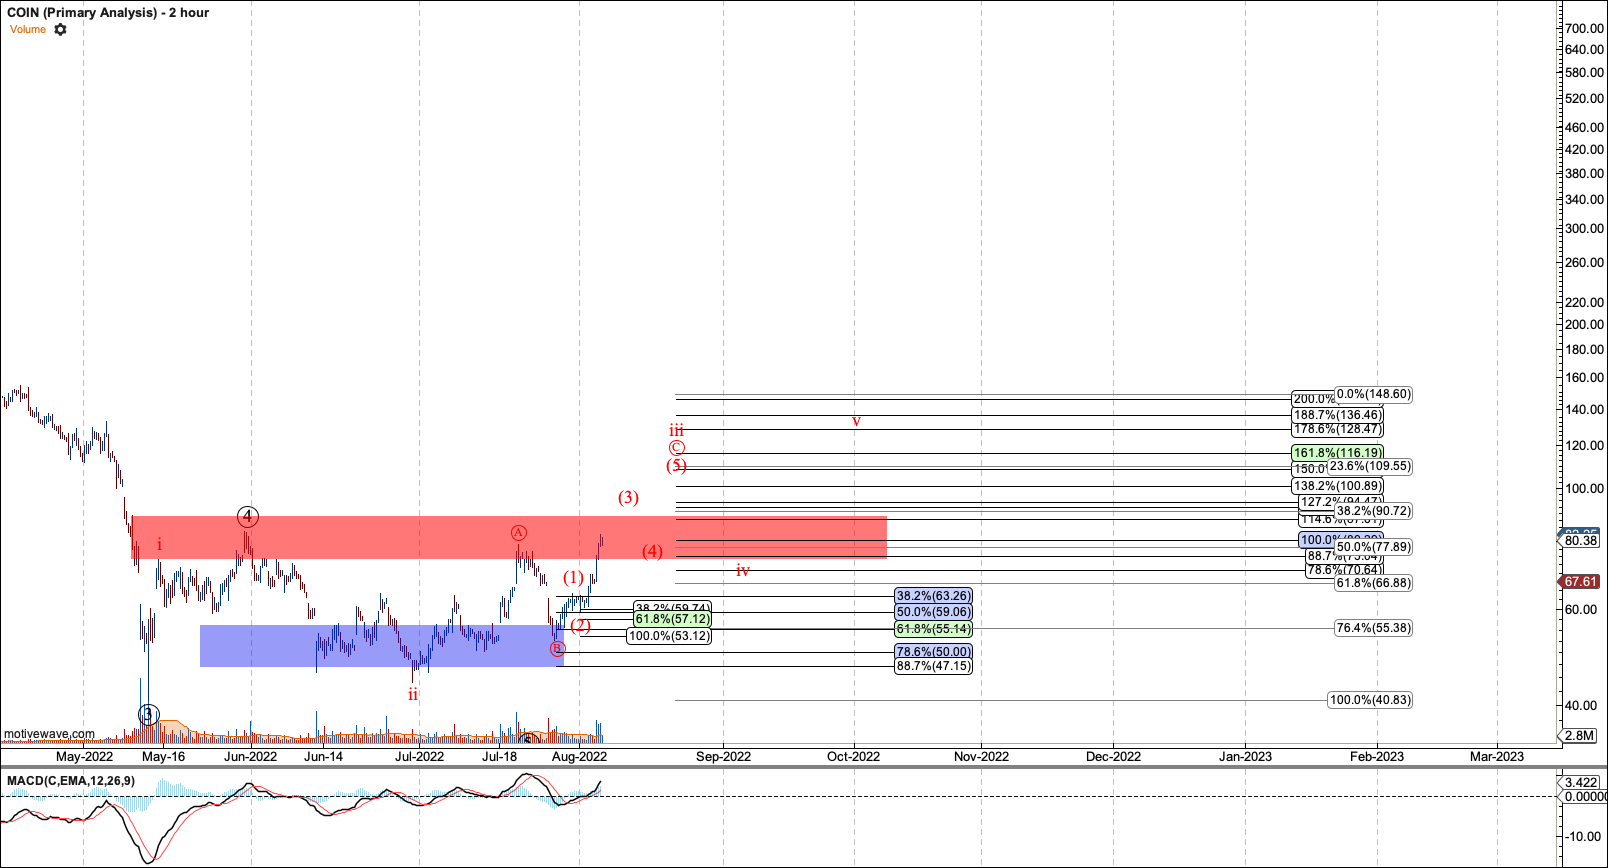
8. COIN is making good headway in the third of the third, but will need all five waves to indicate a bottom is in. At this point (V) can hit $115-116.
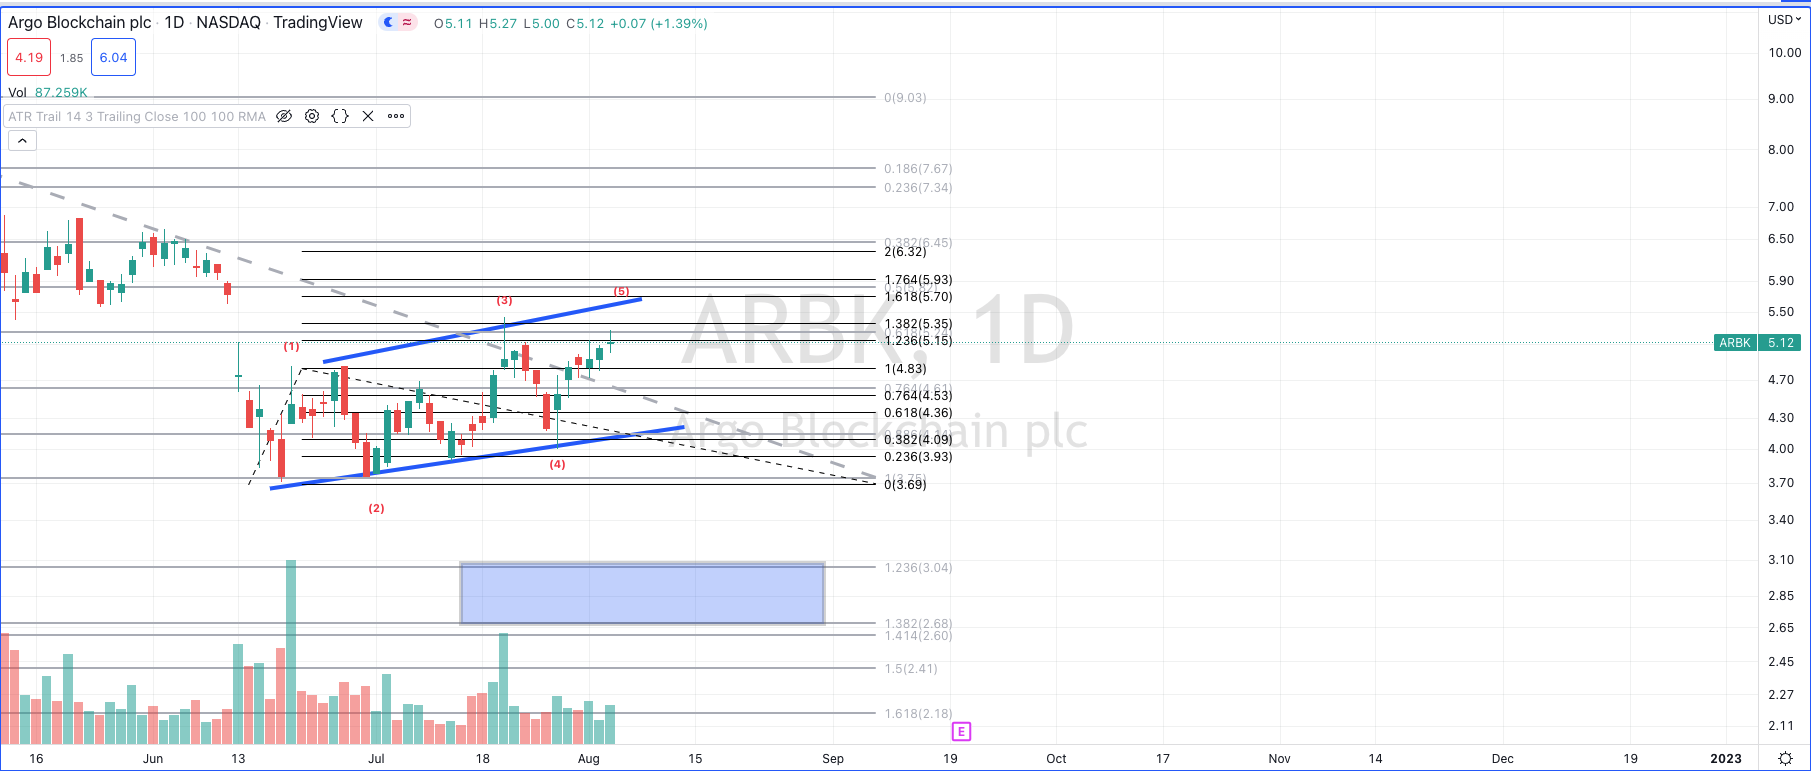
9. ARBK still needs a fifth wave in the $5.70 which would be the first indication a bottom is in.
Equity Charts I'm Stalking
NA
