We Are At Yet Another Metals Inflection Point
I am sending this update out earlier than usual as I believe we are approaching an inflection point now in the metals complex.
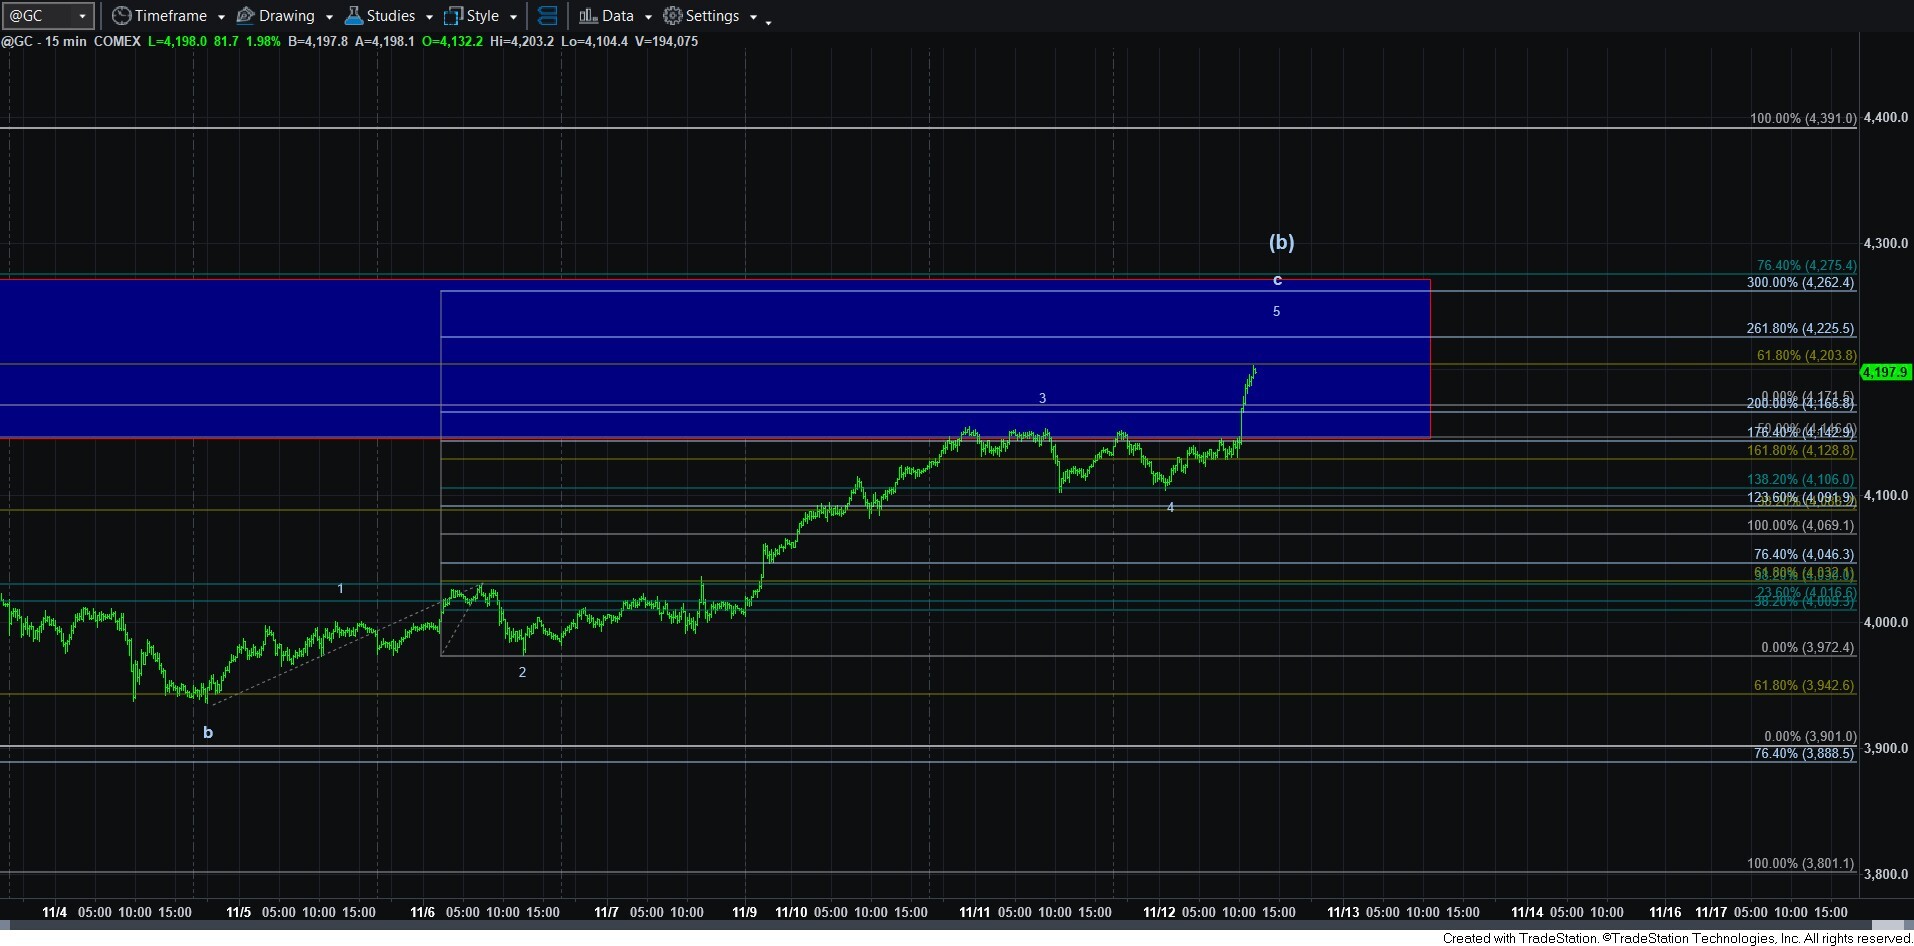
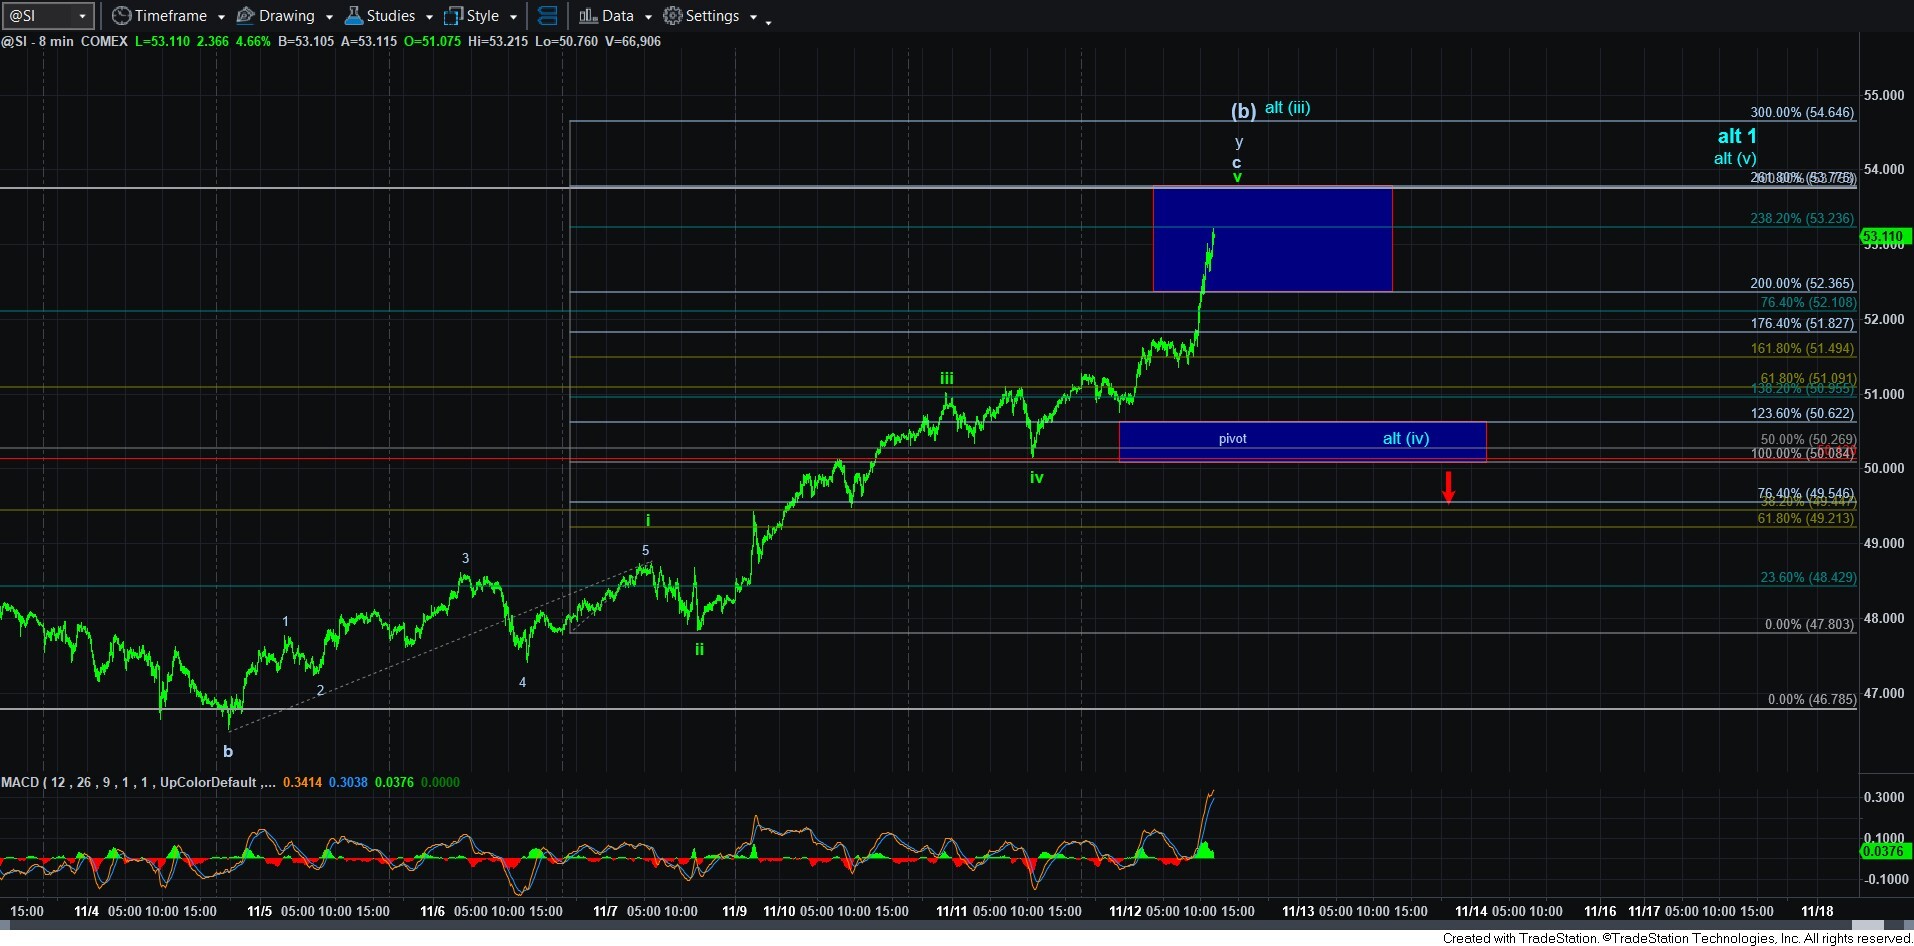
Based upon the last few week’s price action, it was not easy to maintain an expectation of a bigger (b) wave rally. However, we have now finally seen what I had wanted to see these last few weeks. And, now that we have, we are approaching a test for our primary count.
As you know, our primary count had the initial decline in the complex as an (a) wave, with this rally being a (b) wave, which was structured as an a-b-c move higher. As c-waves are most commonly 5-wave structures, we now seem to be completing a 5-wave structure for the respective c-waves, which should also complete this a-b-c corrective (b) wave rally.
Interestingly, while silver is almost at its prior all-time highs, gold is now just getting to the .618 retracement of the prior decline. I want to remind you that once silver actually begins its 5th wave higher north of 60, the price action we see in gold will tell us if the blow off top we recently experienced was the final top in this rally (my alternative for now), or if we do indeed have a 5th wave higher high coming in gold too. As of this time, I am still not sure, but I am siding with the 5th wave count for a higher high for now.
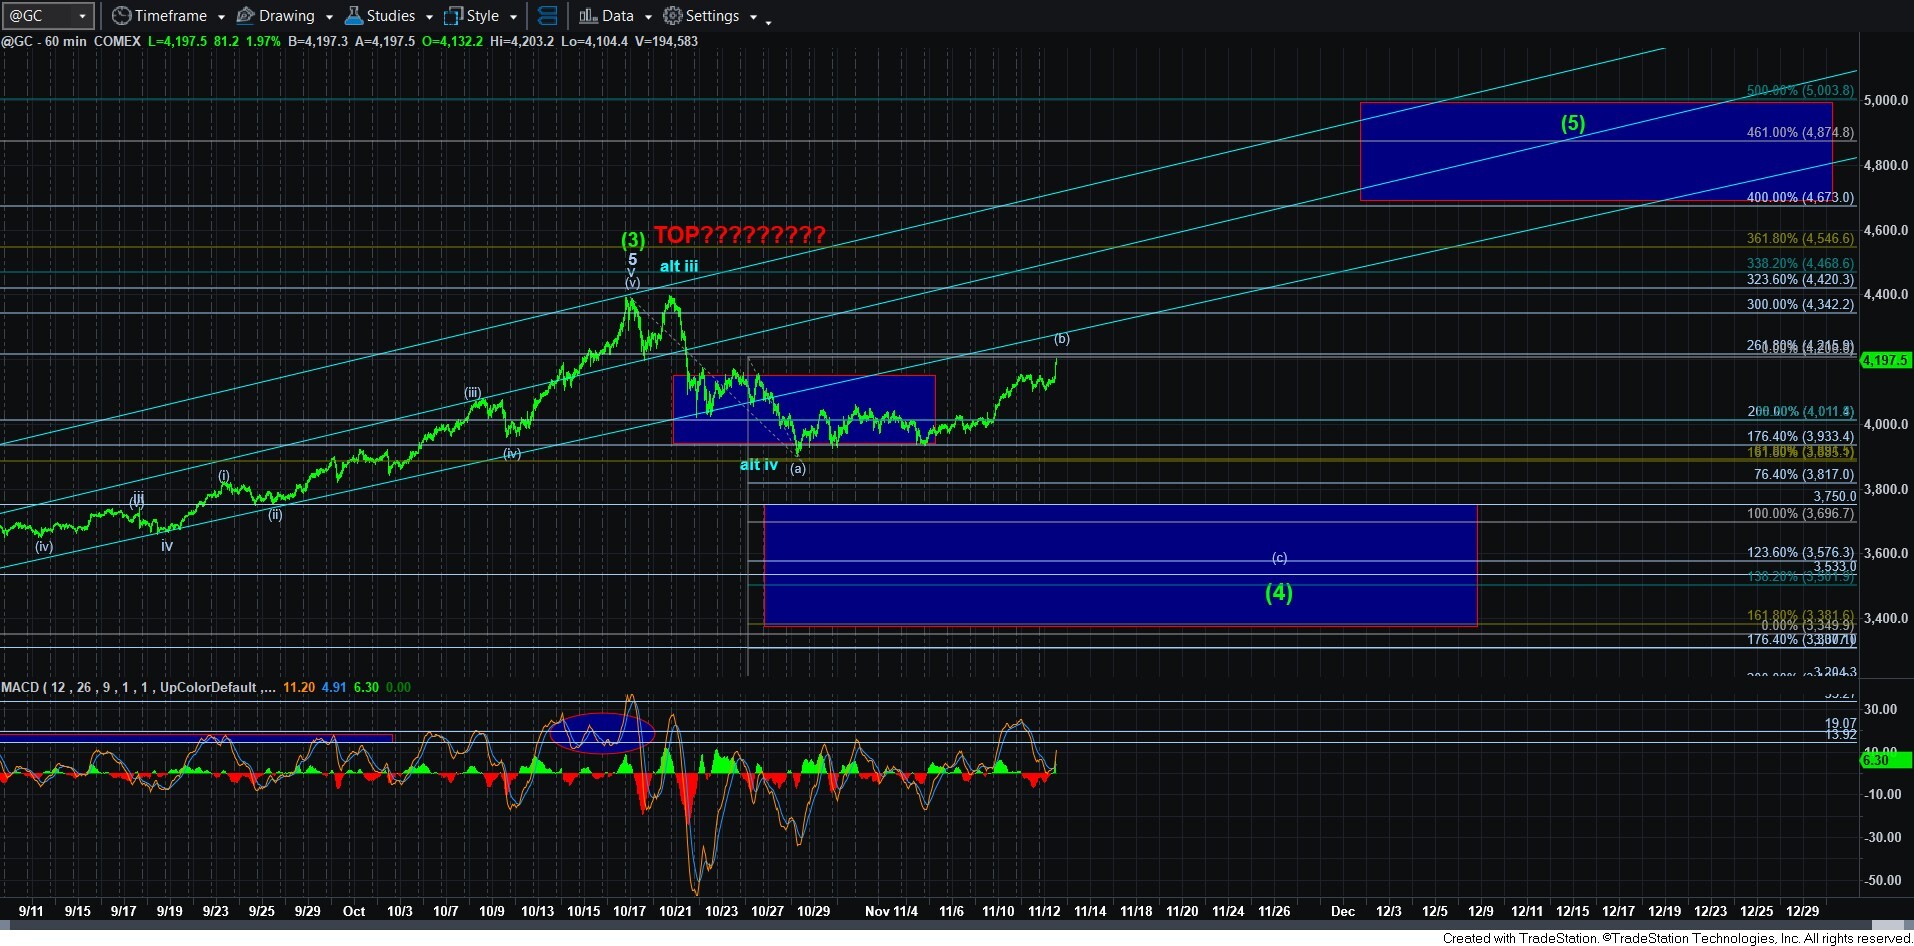
Yet, I have to again note that all these structures would look before with one more decline in a (c) wave in the coming weeks. To remind you again, since (c) waves are most commonly standard 5-wave structures, we need to see an initial 5-wave move down to suggest that the (c) wave has begun.
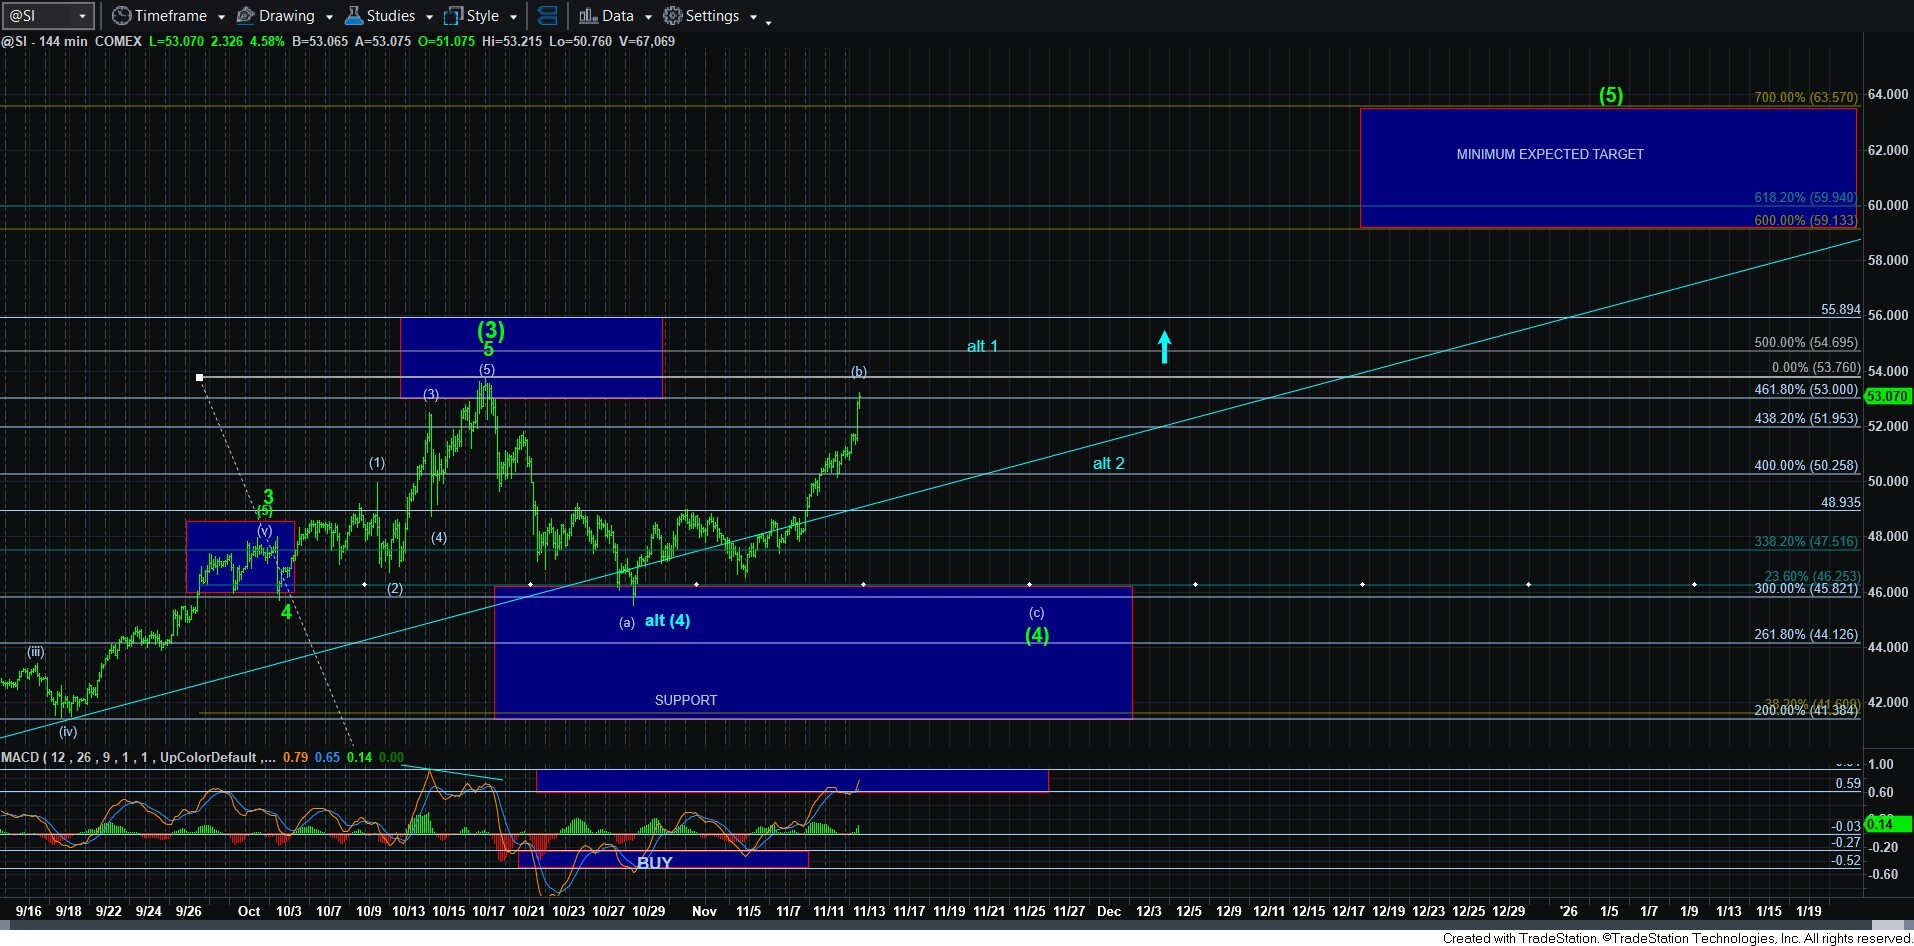
Also, take note that I have now added a bullish alternative to the silver chart, which suggests that the (4) is done. It is clearly NOT my preference for a number of reasons. But, if the market should fill out more of a (iv)(v) as I am showing on the 8-minute silver chart, we may have to take that count a bit more seriously. Moreover, this pattern would likely project to the 75/80 region. However, for now, I am seeking a 5-wave decline and an impulsive break down below the pivot to suggest that the (c) wave down has begun.
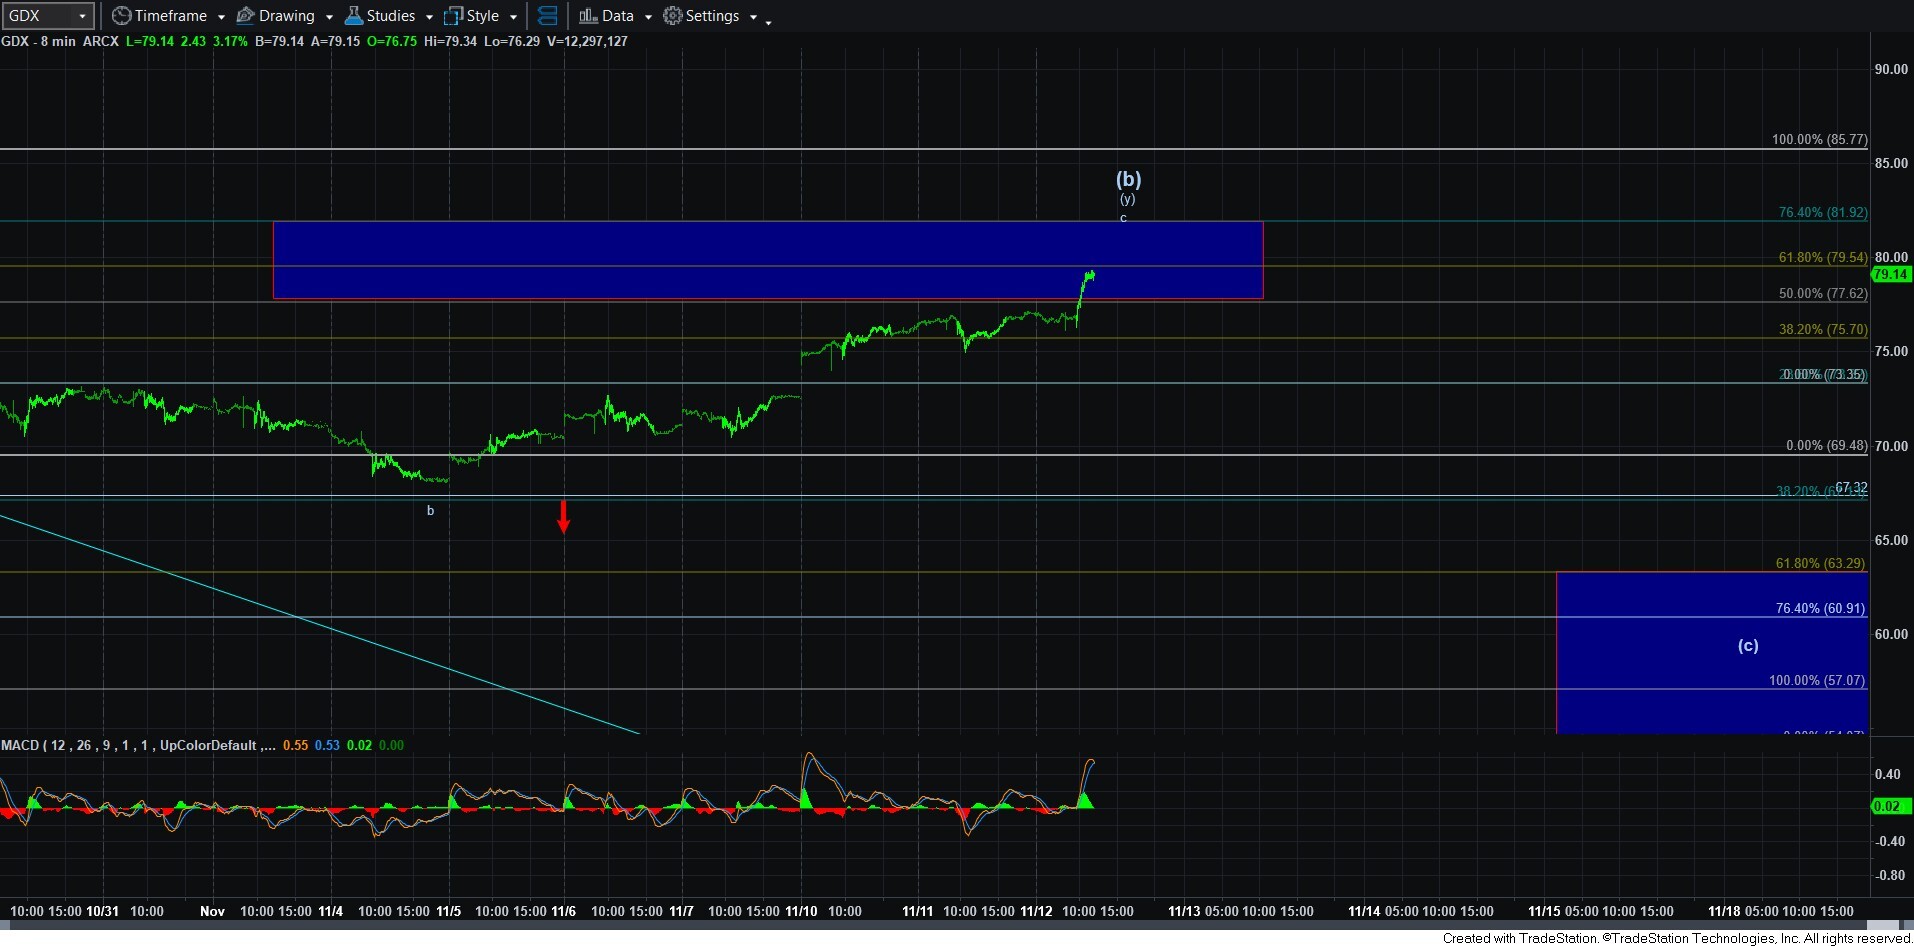
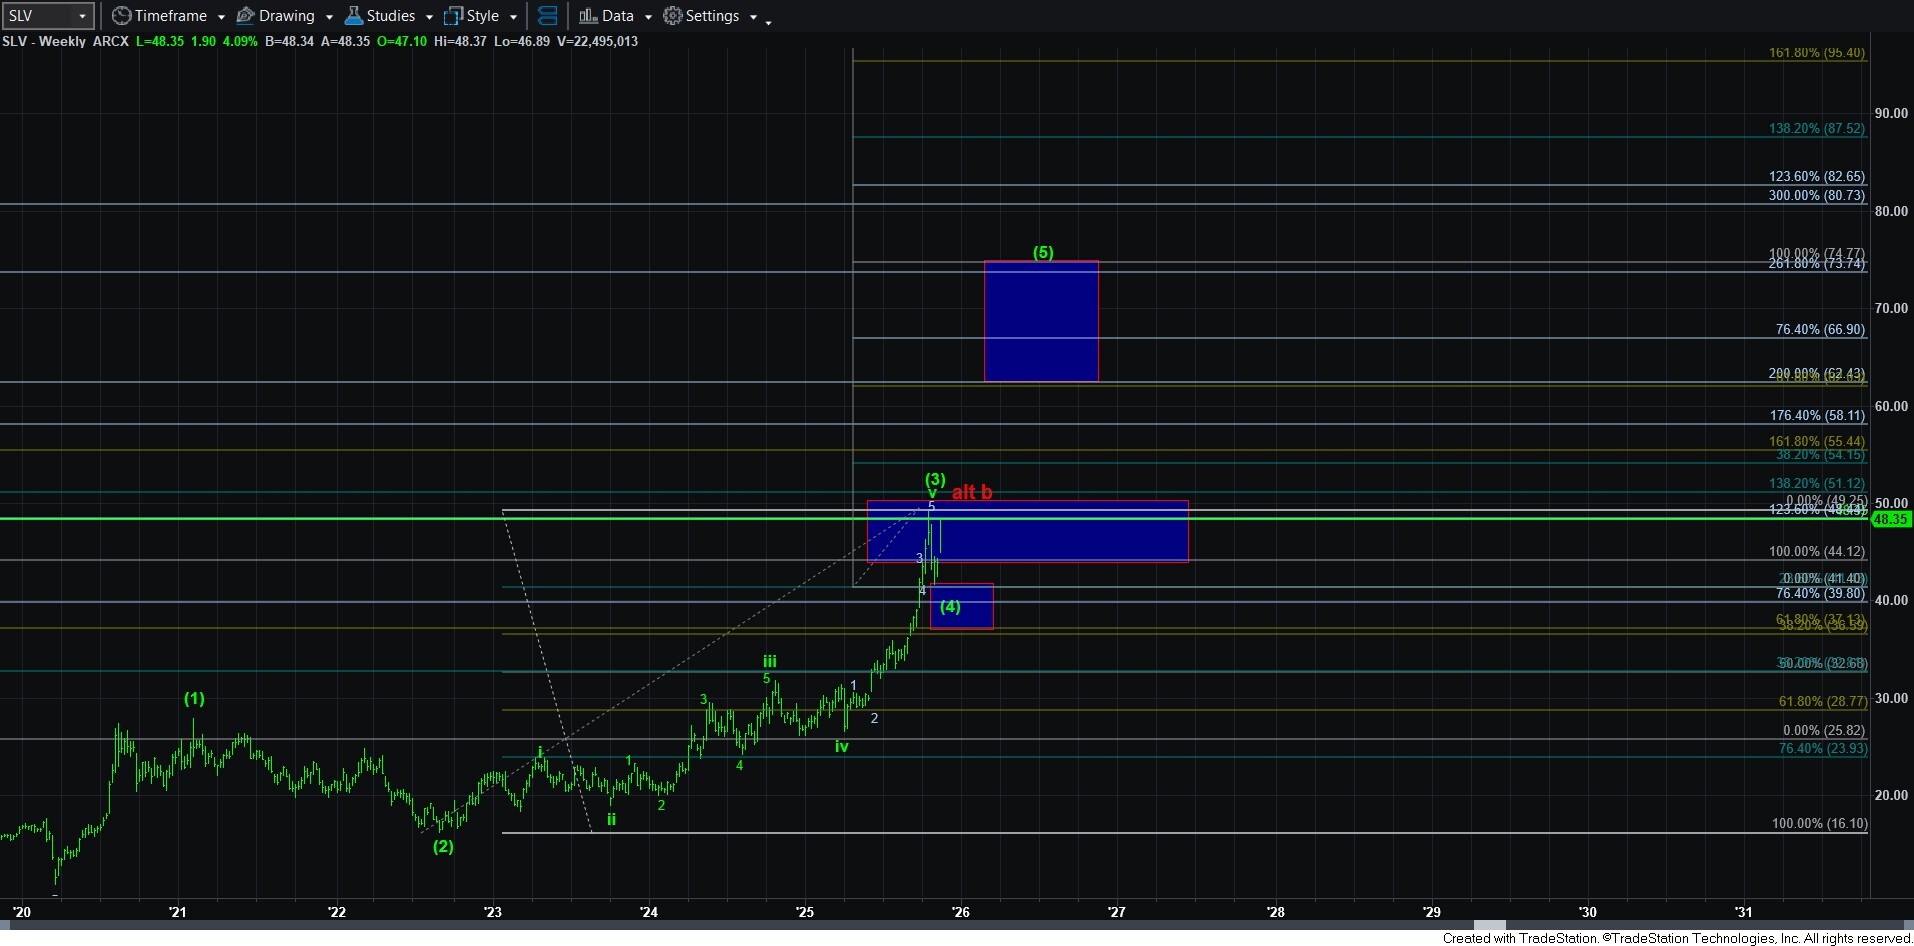
In silver, because we have come up so high, we can see a double bottom of sorts, wherein the (c)=(a) wave target would be in the same general region of the (a) wave bottom. Of course, the (c) wave can extend much further and take us to the bottom of support, but we will need to see a very extended 5th of 3rd wave in that (c) wave to suggest that to be the case. For now, I am targeting the upper end of our support box on the 144-minute chart.
In gold, the ideal target remains in the 3400/3500 region, but there is potential we may hold the top of the support box on the 60-minute GC chart just south of the 3750 region.
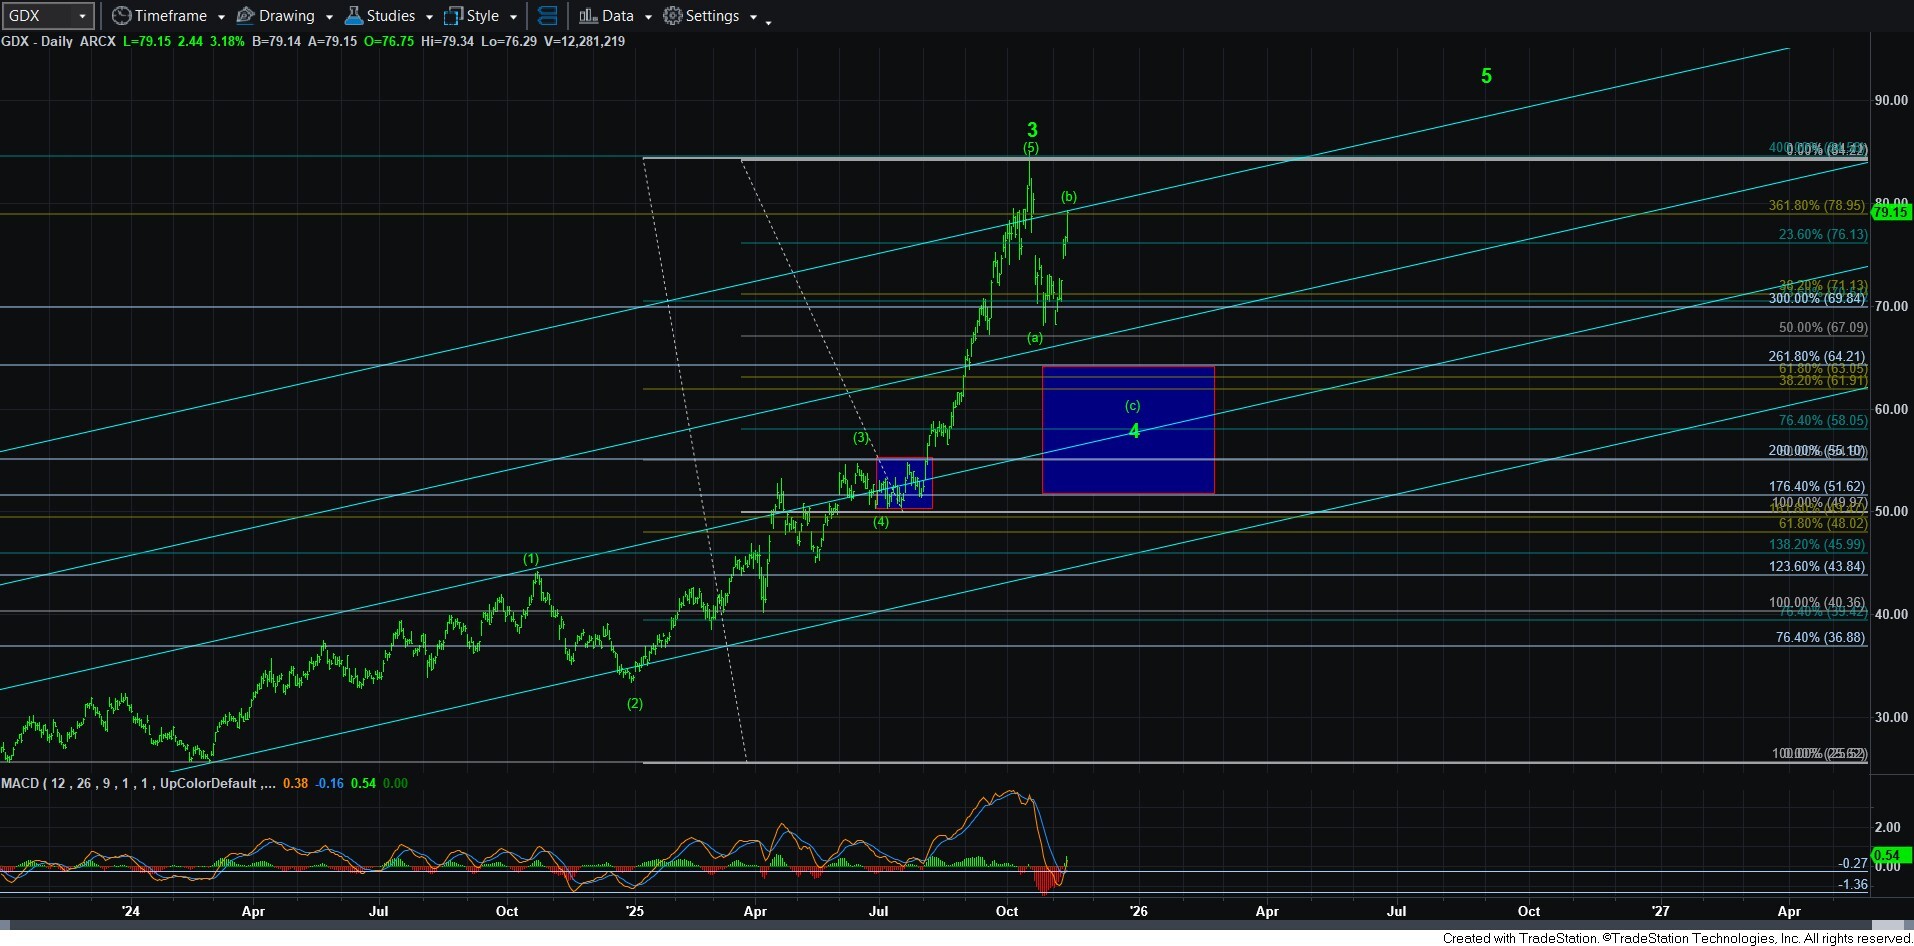
And, in GDX, I would prefer a drop to at least the 63 region, but it can also extend as low as the low 50’s. Again, it will all depend on the size of the 5th wave of the 3rd wave in the (c) wave.
So, at this time, I am assuming we are putting the final touches and squiggles on the c-wave of the (b) wave rally we have sought these last few weeks. And, we are on the lookout now for an initial impulsive 5-wave decline to signal that the (c) wave decline has begun. Overall, please keep in mind that it is not likely that the metals bull market cycle has yet completed, and I believe it has one more major rally before this bull market cycle ends. So, at least for now, pullbacks still remain buying opportunities.