We Are At Another Metals Inflection Point
The depth of the pullback has now become a bit more than I had ideally wanted to see. But, what else is new in this market. Until a break out is seen, it continues to frustrate us all.
It is quite clear, based on some of the posts I see, that many of you are also quite frustrated with this market. And, rightfully so. This market has been moving sideways for the last year, and has already invalidated several break-out set ups during that time. I can assure you that I share your frustration, as mine is even multiplied by 3500+ fold. But, these frustrations often become quite evident right before we see a market turn.
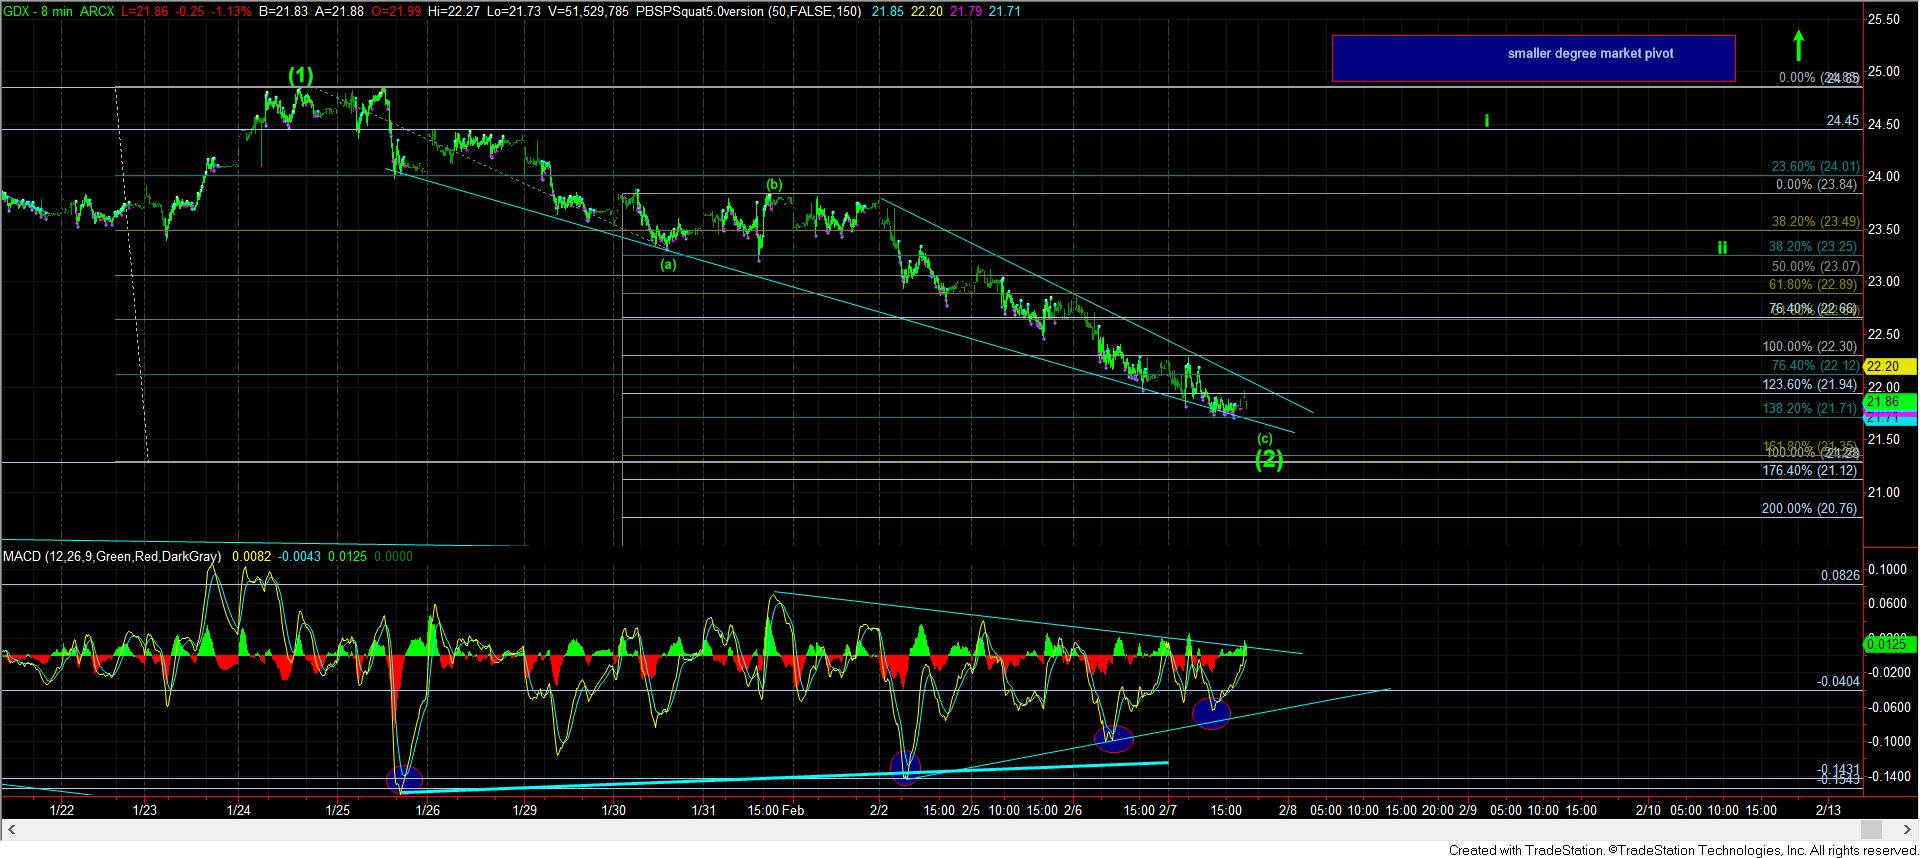
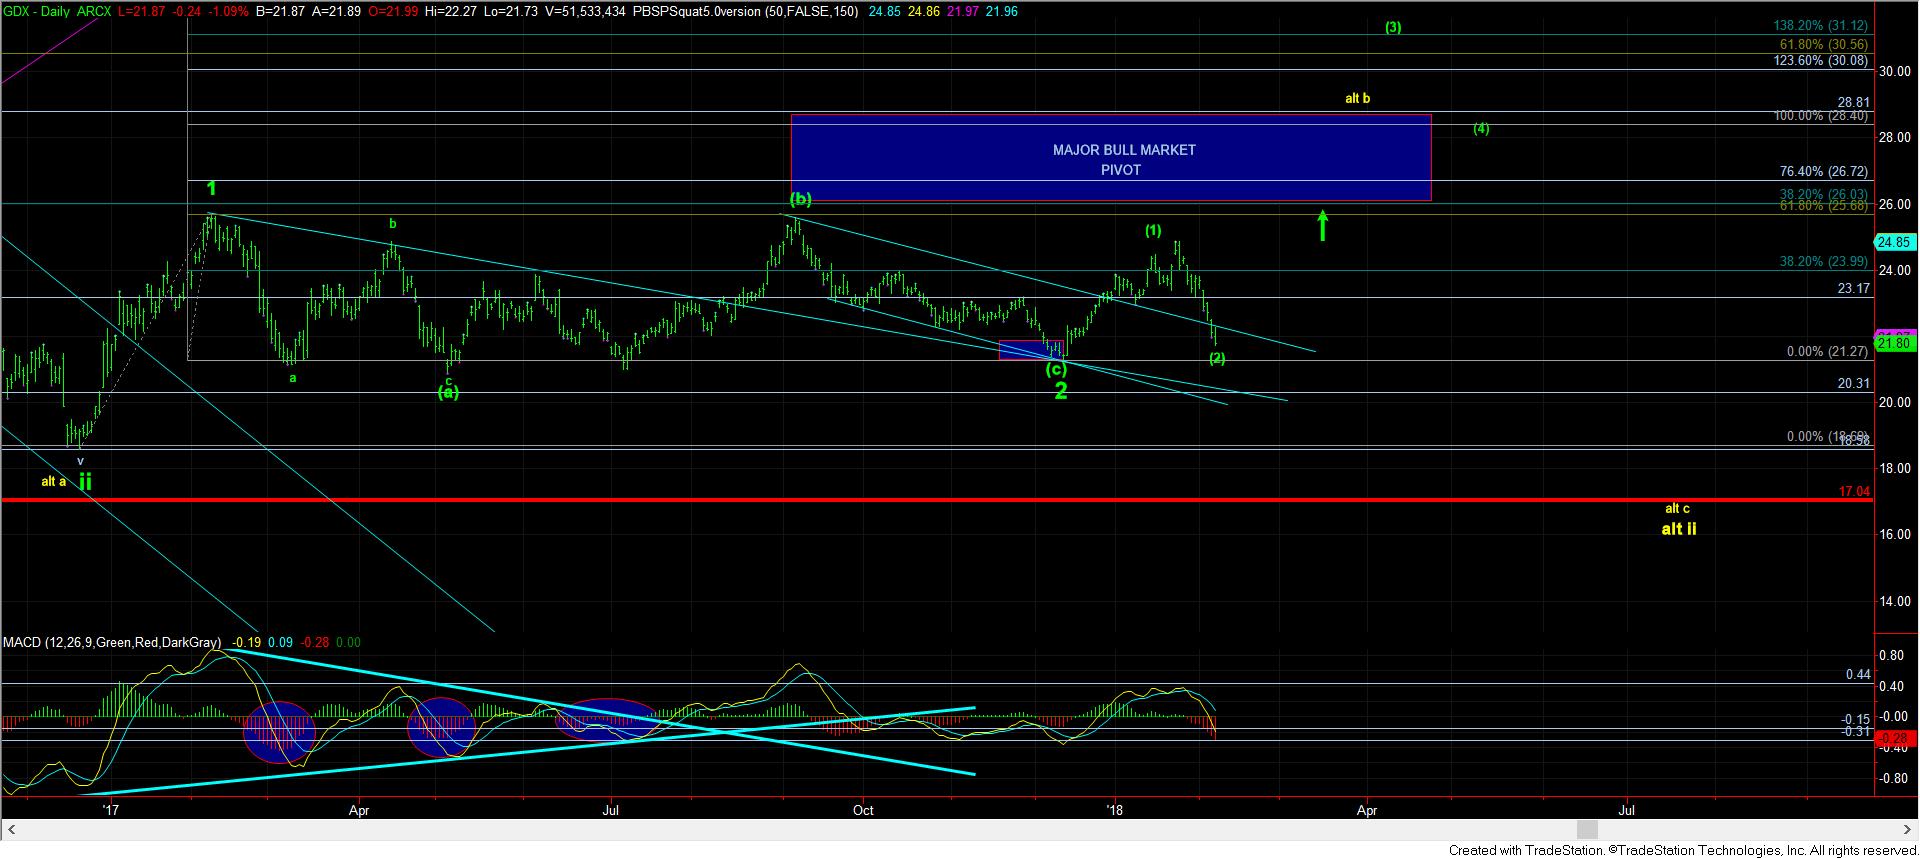
Let’s start with what is truly concerning to me. The GDX has certainly dropped much lower than I had wanted to see in this 2nd wave. In fact, it has even now dropped below the .764 retracement of wave (i). Moreover, if you look at the daily chart, you will see that it has now fallen back into the trend channel from which it broke out. There are generally not positive developments.
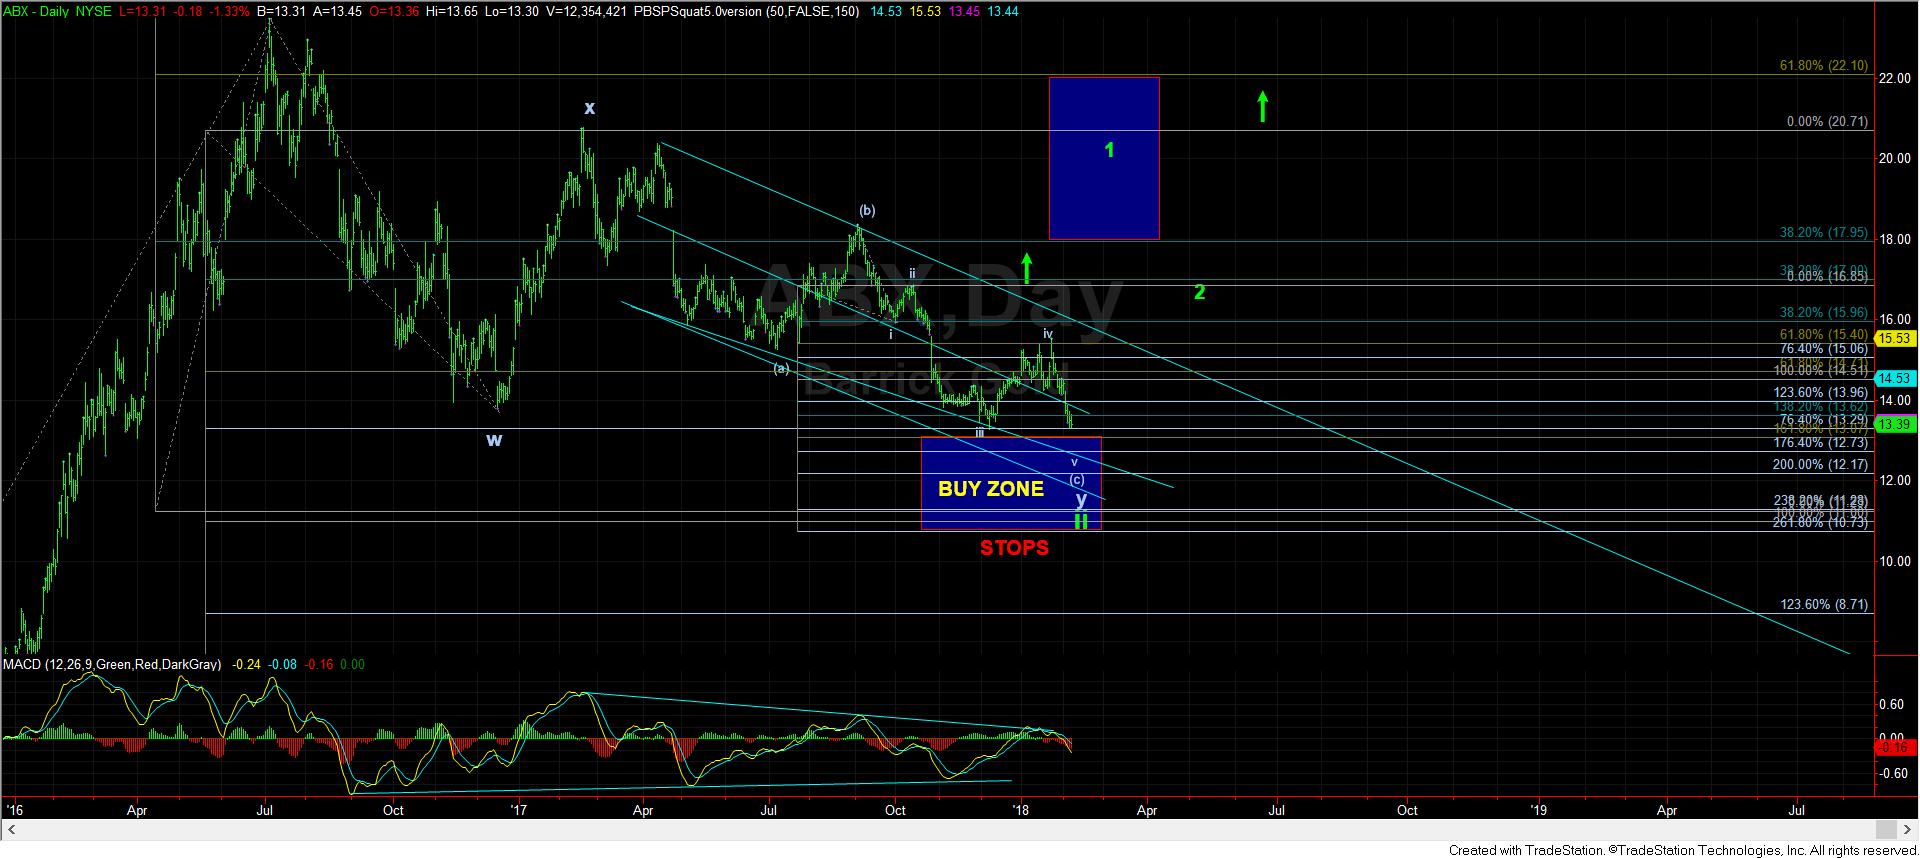
So, when I asked myself why the GDX has been underperforming the GLD so much, I decided to take a look at the ABX again. And, as you can see from the attached chart, we have dropped right back into the long-term support zone. I would imagine this has been acting as a drag on the GDX. But, remember, as long as the ABX holds this support, especially when we consider the long-term positive divergences on this daily chart, it portends a strong rally taking hold once it completes this downside.
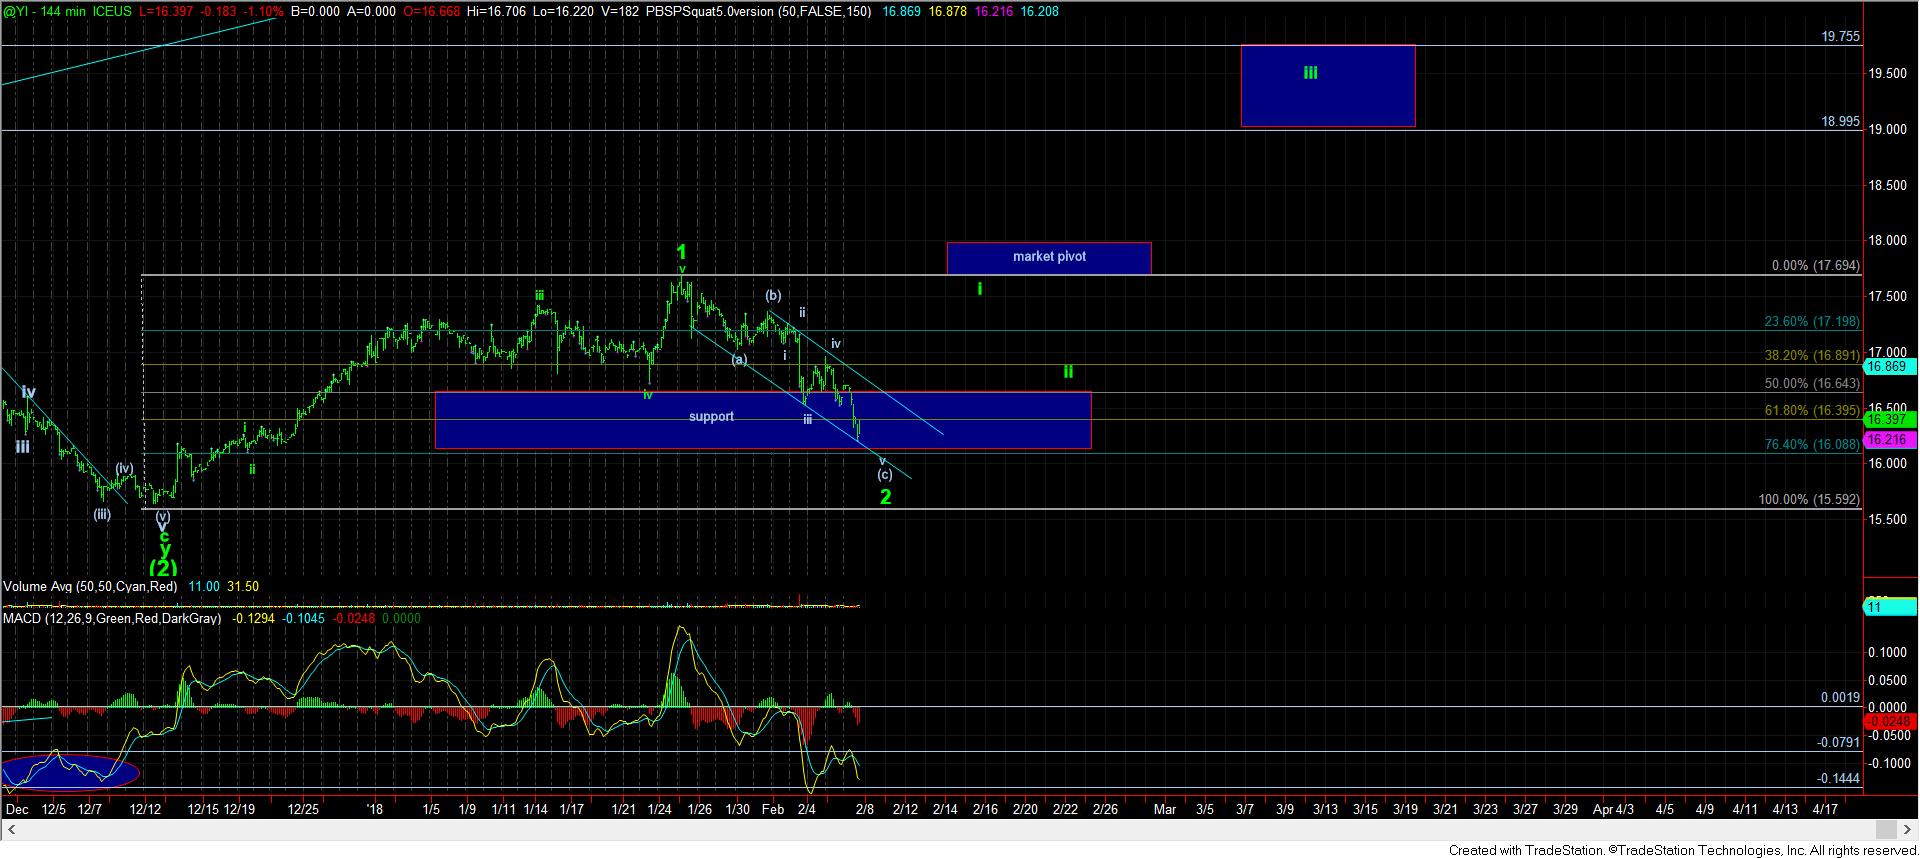
As far as the positives in the market, the GDX has a full (a)(b)(c) pullback wherein (c)=1.382*(a). Moreover, we have positively divergent technicals on the smaller time frames. We also have an almost completed (a)(b)(c) structure in silver, which may still need a final micro 4-5 in wave v of (c). But, with the positively divergent technicals being evident on the 144-minute chart, it often portends a reversal.
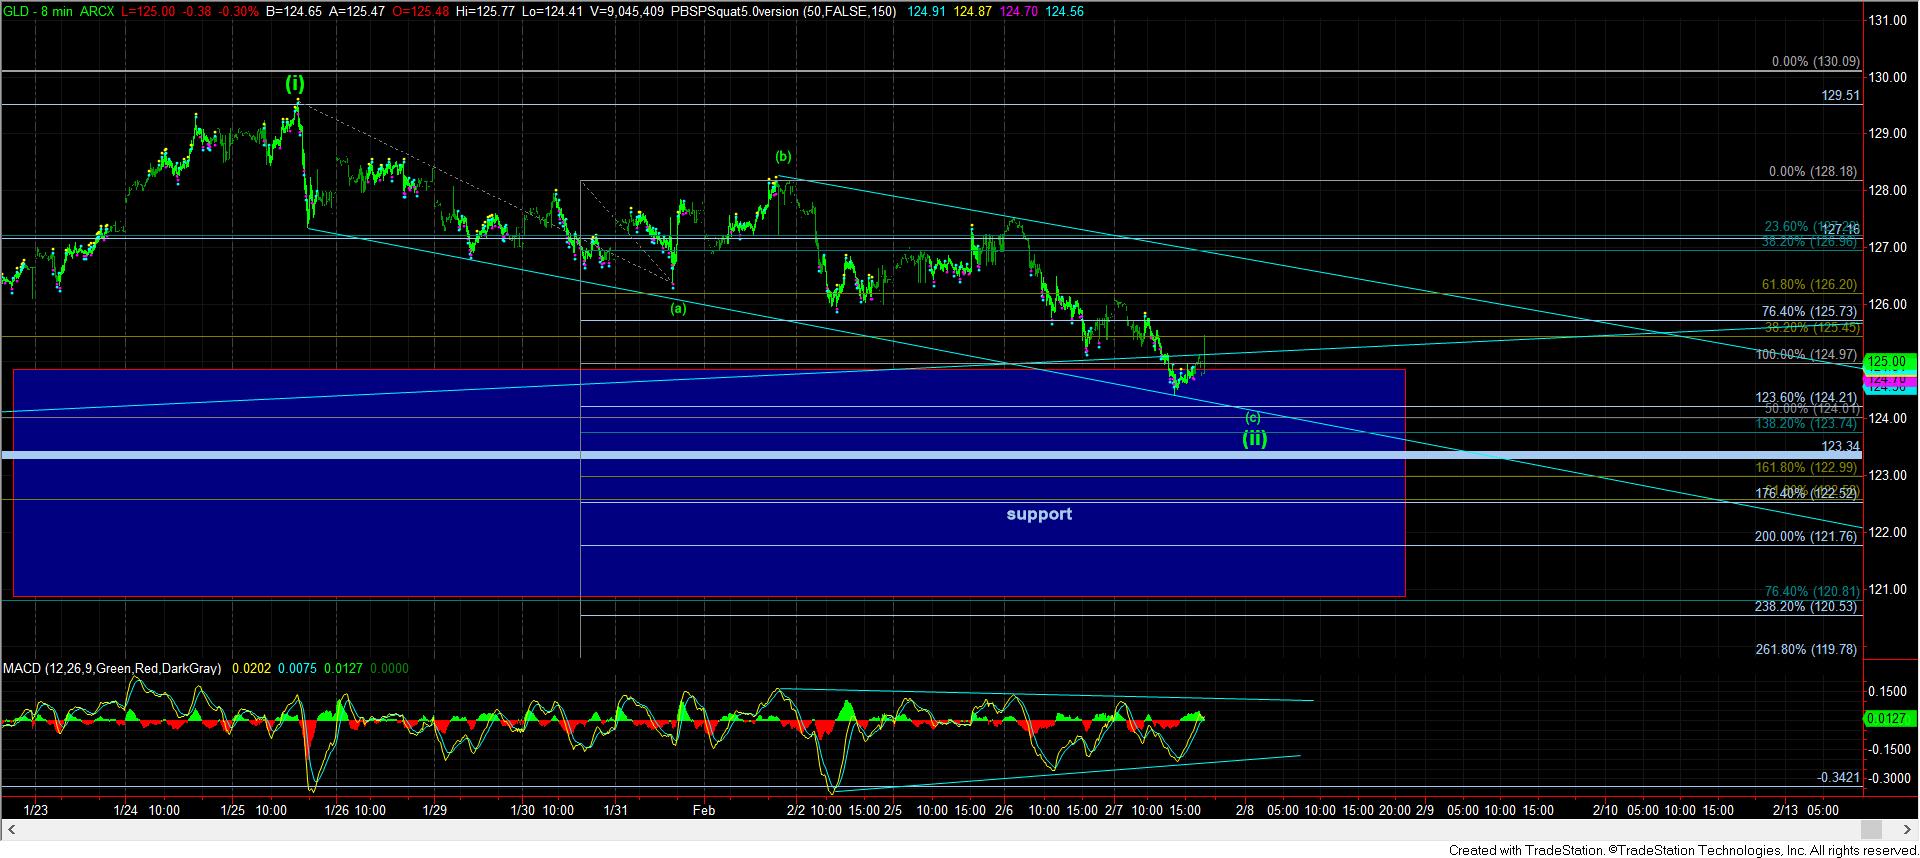
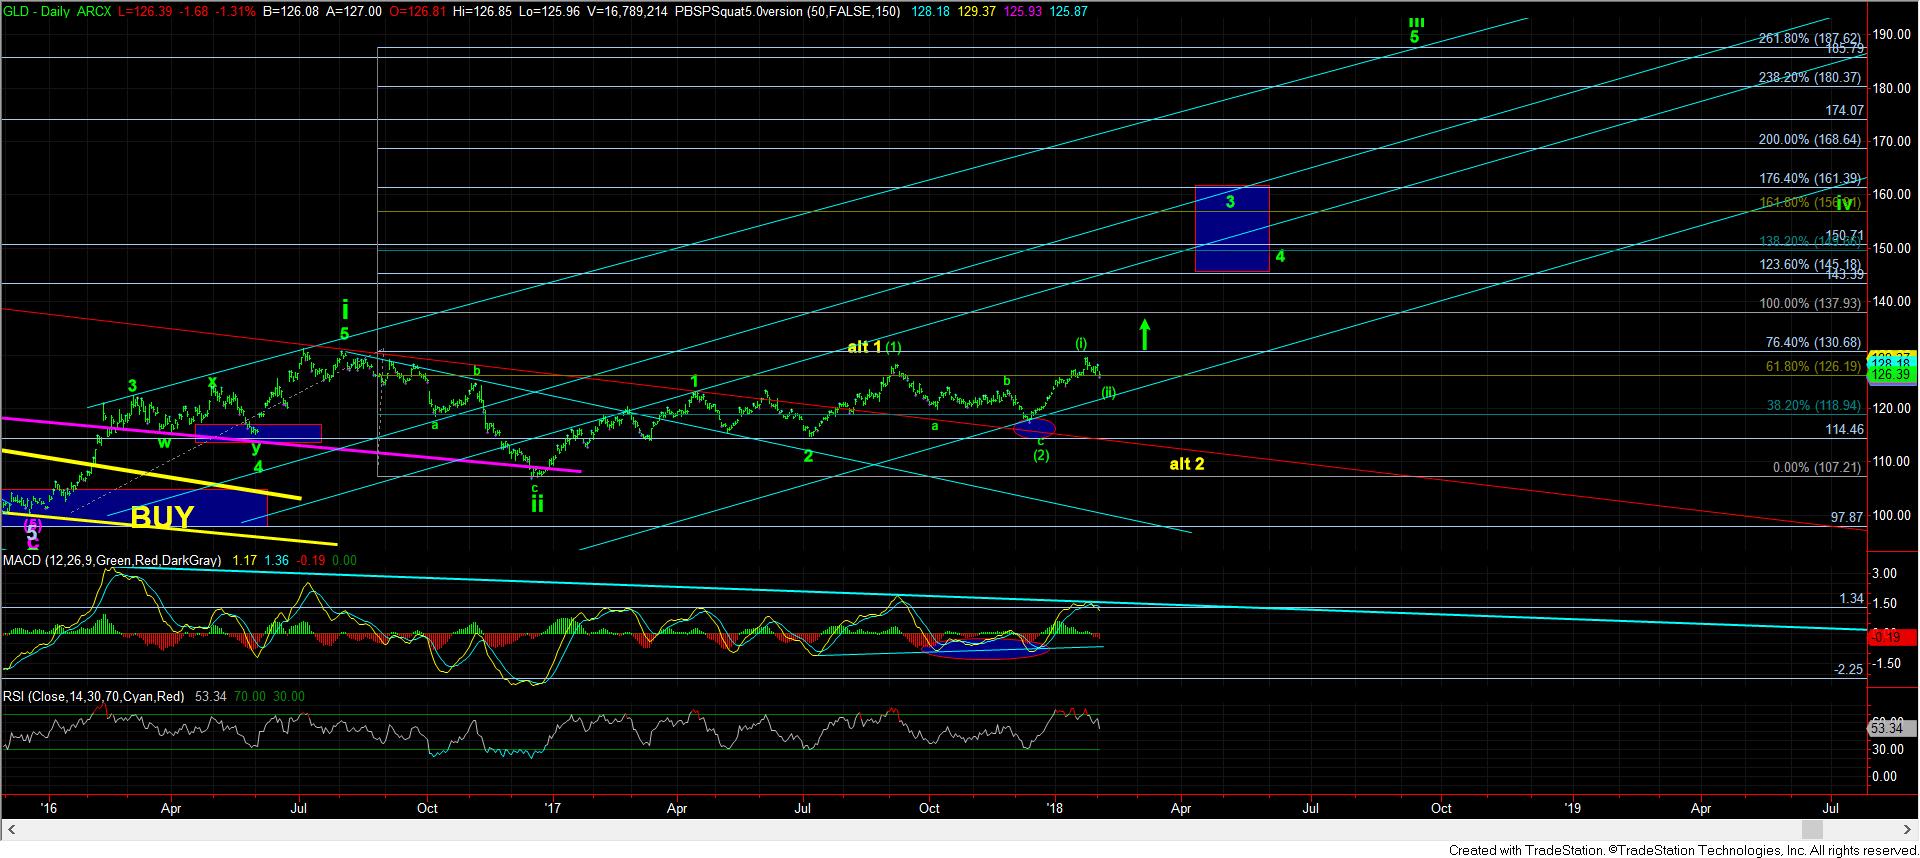
This brings me to the most bullish indication and that is the GLD chart. As you can see from the attached 8-minute chart, we have finally moved into the support region for wave (ii), and it, too, is exhibiting positive divergences on its smaller degree time frames.
At the end of the day, as long as the GDX does not break below the 21.28 level, it retains a valid, albeit deeply retraced, (1)(2) structure.
As I have noted many times before, I cannot tell you whether the market will capitalize on this set up, especially when it has invalidated several of such set ups back in 2017. And, if it does not, it does open the door to seeing the 17 region. But, it does seem that we are at another inflection point, and we should be within days of our answer. Yet, based upon the extent of where we are in the ABX pullback, I don’t think it is a high probability that we see that low even in the event of a break down.
So, for now, I am going to maintain my expectation of an imminent turn around in this complex, potentially by the end of this week.